
 ?Mathematical formulae have been encoded as MathML and are displayed in this HTML version using MathJax in order to improve their display. Uncheck the box to turn MathJax off. This feature requires Javascript. Click on a formula to zoom.
Abstract
Whey protein isolate (WPI)-ascorbic acid (AA) solutions were used to generate powders using spray drying technology. The powders changed color during storage. In this study, spray-dried powders with different ratios of WPI to AA were aged under different conditions. Significant redness generation was observed by heating spray-dried WPI-ascorbic acid powders up to 80 °C rapidly, and redness was generated over a longer time (up to 3 to 5 days) at room temperature. This change in redness was used to develop a packaging indicator for tracking temperature and time, which may be used to indicate the degree of food freshness by visual observation. Another application was to make the aged powders into tablets, and red liquid extracts have been leached out of the tablets into aqueous solutions. The colors of the solutions with the aged WPI-AA powders and their red extract changed at different pHs (from 3 to 11). These extracts were coated onto paper to create low toxicity pH indicators for food testing.
1. Introduction
Health and safety are key trends for the food industry.[Citation1,Citation2] Food traceability is now a legal requirement in some countries.[Citation3] It contributes to a chain of responsibility throughout the entire food supply chain.[Citation4] Food safety requires the development of accurate, cost-effective, rapid, reliable, noninvasive, and nondestructive methods or devices to evaluate the real-time freshness of food products.[Citation5] Extending shelf life, improving quality, providing information, and warning about possible safety problems are also important aims in food safety.[Citation4]
Microbial contamination causes reductions in food shelf life, and it increases the possibility of food-borne illnesses. For consumers, the changed texture, flavor and color of the food may be unacceptable. To deal with this problem, some food sensors[Citation6–8] have been developed, which also help to mitigate food waste.[Citation9] With the help of specific reactions, food sensors may be used to indicate food quality or safety. The pH of the chemical environment for foods can be changed by microbial spoilage.[Citation10] When food is stored, transported or distributed, a pH indicator can be used to monitor its pH condition and give information about its quality. An indicator may respond through visible color development in response to pH changes.[Citation11,Citation12] The pH may be detected using an indicator, and a simple, low-cost, rapid and environmentally friendly sensor is helpful.[Citation5] In order to detect volatile compounds that are acidic or basic, changes in the visual appearance of some pH dyes may be considered. Colorimetric pH indicator dyestuffs may be used, including bromothymol blue, bromophenol blue, bromocresol purple, methyl red, bromocresol green, methyl orange, methyl yellow, phenol red.[Citation13] As pH indicators, methyl red (MR) and bromocresol purple (BCP) are toxic.
Spray drying is an efficient drying method to produce powders.[Citation14–16] During spray drying, feed solutions of mixed materials are atomized by compressed air, and the droplets are quickly dried into powder particles in a gas within a few seconds. Because of the rapid drying process, the color of spray-dried powders may not change significantly with controlled operating conditions.[Citation17] Ascorbic acid is an antioxidant, and can be easily oxidized to dehydroascorbic acid and degraded to other products,[Citation18] which are chemically active with proteins and amino acids, causing Maillard browning reactions.[Citation19] For many foods, their rate of spoilage is a function of temperature. When food is transported or stored, a cold chain is commonly used. When being loaded or uploaded, food can be exposed to temperature changes. Foods may be exposed to damaging temperatures, which may affect their quality. Recording the temperature-time history of food can help to indicate this situation.[Citation20,Citation21] Redness process of spray-dried WPI can be used to design a type of time-temperature indicator, which can monitor the degree of freshness. The aim of this study is to use the color change phenomenon of spray-dried WPI and AA powders to design food safety spoilage indicators, which can monitor the freshness of food products. There are two main applications, including a temperature history tracking indicator and pH values detecting indicator for the food. The relationship between the two applications is that they both start from the color change phenomenon of spray-dried WPI and AA solutions, and they both use the same basic Maillard reactions for the different applications. The indicators can be detected by visual observation, which may help to enhance food safety.
2. Materials and methods
2.1. Chemicals and materials
Whey protein isolate (WPI) (Balance Ultra-Filtered Ion Exchange, unflavored; Nutrition information per 100 g: 92 g protein, 0.4 g fat, and 0.5 g carbohydrates) was purchased from Vitaco Health, Australia. L-Ascorbic Acid (vitamin C, analytical reagent), hydrochloric acid (HCl, 32%, laboratory-grade), and sodium hydroxide (NaOH, reagent grade) were purchased from Chem-Supply, Australia. Filter paper (Whatman No 1001090, United Kingdom) was used to prepare a dye label. Deionized water was used as the solvent. Sodium hydroxide or hydrochloride acid solution was used to adjust the pH to the desired value over the pH range from 3 to 11.
2.2. Spray drying
For the spray drying of WPI and AA solutions, 10 g WPI, and 0.5 or 1 g AA, for ratios of ascorbic acid to whey protein isolate of 1:20 and 1:10, respectively, were dissolved in 100 mL distilled water as the feed solution at the room temperature of 20 °C, and then spray dried by using a Büchi Mini Spray Dryer B-290 (Büchi, Switzerland). The operating conditions for spray drying included a main airflow rate of 38 m3/h (aspirator setting of 100%), a pump rate of 8 mL/min (25% of the maximum rate) and a nozzle airflow rate of 540 L/h (45 on the nozzle rotameter scale with 0.55 bar pressure drop). A two-fluid atomizer was used with a 0.7 mm nozzle tip and a 1.5 mm nozzle cap. An inlet air temperature of 150 °C was used, while the outlet temperatures were recorded (70 ± 2 °C). Freshly spray-dried particles were collected from a vessel at the bottom of the cyclone and immediately stored in a desiccator to avoid moisture absorption.
2.3. Maillard reactions during heating
The aging process for all the samples involved heating them in an oven (Labec Laboratory Equipment ODWF24-SD, Australia) at 80 °C for 2 h, and this process showed significant differences in their colors (redness).
2.4. Indicator solution
An indicator solution was prepared by using a concentration of 0.005 g/mL of red powders that were spray-dried WPI and AA with a mass ratio of 10 to 1 or 0.5. These powders were mixed with deionized water at room temperature (20 ± 2 °C). The pHs of the solutions were adjusted to 3.0, 4.0, 5.0, 6.0, 7.0, 8.0, 9.0, 10.0 and 11.0 by using HCl or NaOH, with the assistance of a pH meter (Mettler Toledo M300, Australia). The beakers containing red WPI-AA solutions were placed on a hot plate stirrer (Thermoline Scientific HSD330, Australia). A magnetic stirring bar (BRAND® round) was used to mix the solution when the pH value changed.
2.5. Tableting and indicator coating solution
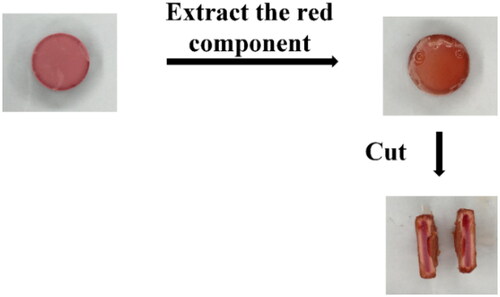
Tablets with an identical weight of 0.5 g were prepared by manually introducing powders into a flat-faced punch of a manual hydraulic press (Specac 15 T, United Kingdom) at a compression pressure of 310 MPa. A desktop tableting machine was used, and the internal diameter of the tableting die was 12.7 mm, which was the diameter of the tablets. In tableting, the dwell time was 1 min for all the samples when the required compression pressure was achieved. The dissolution test for a tablet was performed in 50 mL of solution. In order to achieve the desired coating solution, 24 h were used to carry out the extraction process of the redness component. After this extraction, the color of the supernatant liquor was strongly red, indicating the presence and concentration of a redness component. The liquor supernatant was collected and then was centrifuged at a rotational speed of 6,000 rpm (using a C1006 benchtop centrifuge, Thermoline Scientific, Australia) for 5 min using 15 mL centrifuge tubes.
2.6. Indicator label
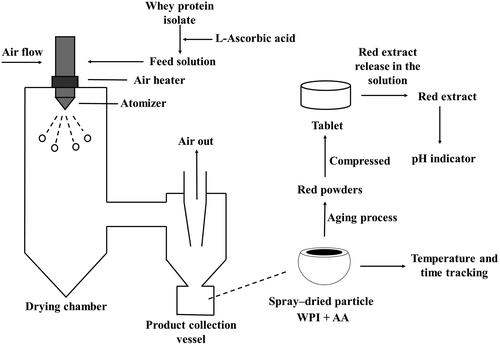
An indicator label was obtained by casting the indicator coating from the previous step onto Whatman filter papers (GE Healthcare No 1001090, United Kingdom) and drying the papers in a 60 °C oven for about 2 h. A plastic box with 6 cm length, 6 cm width and 2.5 cm height was used for the coating process. The red solution just covered the filter paper, and then the label was dried in the oven at 60 °C. This process was repeated until 50 mL of the extracted red solution was used. Red filter papers were made in a rectangular shape for producing pH indicator labels. These labels may be easily observed visually.[Citation22] The overall process for producing the indicator labels is shown in .
Figure 1. The procedure used to generate the indicators.
2.7. Fourier transform infrared (FTIR) spectroscopy
FTIR spectroscopy was used to investigate the functional groups for the spray-dried samples. The specimen was placed on the detector of a single bounce diamond ATR in a Nicolet 6700 FTIR spectrometer (Thermo Fisher Scientific, Australia). The FTIR spectra used a resolution of 4 cm−1 with 128 scans.
2.8. Scanning electron microscopy (SEM)
The spray-dried samples were placed onto a carbon tape on an aluminum sample stab. After Au-coating for 60 s at 18 mA by a Quorum-SC7620 Mini Sputter Coater (Quorum Technologies, United Kingdom), the morphologies of the samples were observed using a Phenom-Prox SEM (Phenom-World, Netherlands) in the detector mode for backscattered electrons with an operating voltage of 10 kV and an operating pressure of 1 Pa. The images were captured by the Phenom-World default software.
2.9. Color analysis
The samples were stored at room temperature (20 ± 2 °C, controlled by an air conditioner) to study the rate of color change. Analyzing the color of the spray-dried WPI and ascorbic acid was carried out through a standard lighting box as discussed in the previous research [Citation23] with four fluorescent lamps. Samples were stored in plastic tubes (Polystyrene cuvettes), with sizes of 4.5 cm (height) × 1.2 cm (length) × 1.2 cm (width) and in plastic sealed bags (Polyethylene) with sizes of 40 mm (width) × 50 mm (length) (1.5 inches × 2 inches) for color analysis. The photos from a digital camera were transferred to a computer for MATLAB analysis. For the MATLAB analysis, three regions of 100 by 100 pixels were used to assess the L, a and b values (color parameters) for the collected photos according to the CIELAB sphere.[Citation24] The L, a and b values are lightness (0 ∼ 100 from black to white), redness/greenness (−100 ∼ 100 from greenish to reddish colors) and yellowness/blueness (−100 ∼ 100 from bluish to yellowish colors), respectively. Moreover, some other values also provide valuable information, including the color difference (E) and the chroma (C), which may be calculated from the color values (E2 = L2 + a2 + b2; C2 = a2 + b2).
3. Results and discussion
3.1. Color changed of spray-dried powders
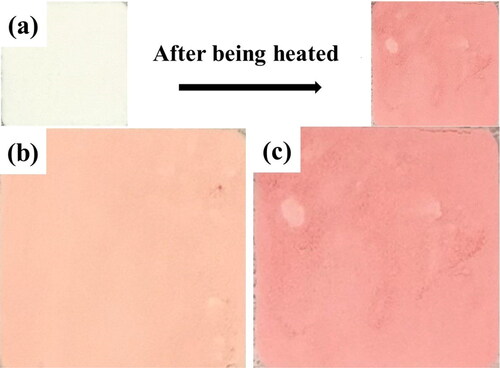
The powders of whey protein isolate and L-ascorbic acid were generated through the spray drying process. The colors of the spray-dried powders became red when heated, as shown in . The reason may be the Maillard reaction between WPI and L-Ascorbic acid, producing formyl threosyl pyrroles.[Citation25,Citation26] The mass ratio of WPI to AA determines the relative quantities of different reaction groups, which further determines the extent of redness for the powders. Therefore, the colors of the powders are different in .
Figure 2. (a) Heating in an oven; colors with different mass ratios of WPI to AA (b) 10 to 0.5; (c) 10 to 1 (2 h aging at 80 °C oven).
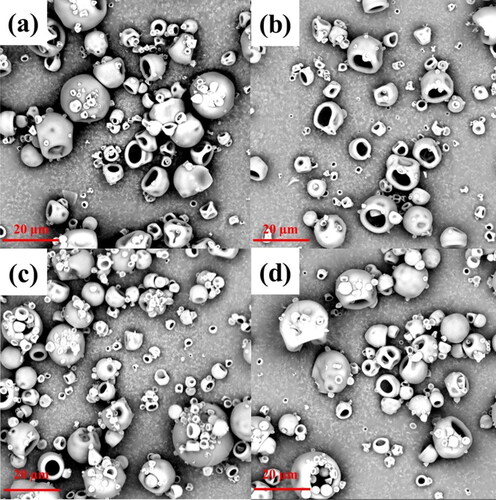
The particle morphology of the spray-dried WPI and AA powders is shown in the SEM images (). The shapes of the powders are spherical with holes, and the spheres are often collapsed. In the spray drying process, WPI is a surface-active material. The protein may be preferentially present on the surfaces of the particles due to different mechanisms.[Citation27,Citation28] The protein is flexible, allowing the warm expanded particles to collapse, forming the shapes found here.[Citation29]
Figure 3. SEM images of the spray-dried WPI powders with different concentrations of ascorbic acid: (a, b) 10 to 0.5, (c, d) 10 to 1 before and after aging (Maillard reaction). Scale bars: 20 μm. Operating conditions of aging: the temperature was 80 °C; the aging time was 2 h.
3.2. Color changes in the powders as a function of time
3.2.1. Room temperature
The colors of the spray-dried WPI and AA powders changed at room temperature. summarizes the color changes of powders as functions of time with different packaging methods.
Figure 4. (a) Color analysis of collected powders (10 WPI: 1 AA) stored at 20 °C with different packaging methods; (b) Comparison of the trends in the a values for different samples; Comparison of the a values from experiments and fitting with the second-order model for: (c) plastic tube; and (d) plastic bag.
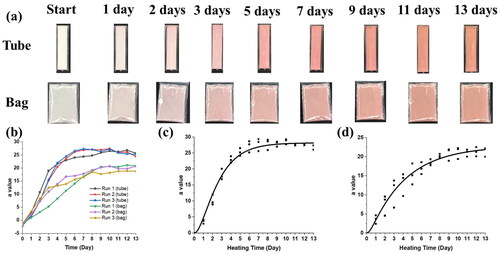
In the LAB color space, a represents the color component green – red, so that the a value may be used to show the changing color of the powders, as shown in .
In order to represent the changes in the color as functions of time with mathematical functions, the curves of this process may be represented as first-order and second-order equations, as shown in EquationEqs. (1)(1)
(1) and Equation(2)
(2)
(2) , respectively. If the color change-time curve of WPI-AA spray-dried powders has a monotonic change in slope, then fitting to a first-order equation is more appropriate. If the curve is sigmoidal (S shaped), then fitting to a second-order equation is more reasonable.
(1)
(1)
Here, “start point” is the starting value for the parameter a; “total change” is the overall change in the a value; and τ is a first-order time constant with units of minutes or days.
Based on the discussion in the supporting data, the time-series response is overdamped. Therefore, EquationEq. (2)(2)
(2) is used for second-order analysis.[Citation30]
(2)
(2)
where y0 is the starting value (delay) for the parameter a; Kp is the overall change (gain) in the a value; ζ is a damping factor; and τ is a second-order time constant with units of days.
For the packaging method using the plastic tube, the results from fitting with the first-order equation are shown in . The values R2 for the first and second-order kinetics are calculated by the software Origin when the experimental results are fitted. R2 is the coefficient of determination. Compared with the first-order equation, the R-square value is significantly higher for fitting with the second-order equation in . The values of R2 are higher than 0.9, which means the statistical model can be used to predict the outcome very well. Therefore, the second-order equation has been used to estimate and track the time for the color change.
Table 1. Results from fitting with the first-order equation for the packaging of spray-dried WPI and AA powders in plastic tubes at room temperature.
Table 2. Results from fitting with the second-order equation for the packaging of spray-dried WPI and AA powders in plastic tubes at room temperature.
Packaging the spray-dried WPI and AA in the plastic bag shows different color-changing curves as a function of time. shows the results of fitting to the second-order equation for the powders in the plastic bags.
Table 3. Results from fitting with the second-order model for the packaging of spray-dried WPI and AA powders in plastic bags at room temperature.
show the curves from the second-order equations for tube packaging and bag packaging, respectively, and shows the corresponding mathematical information about the fitting values for the results.
Table 4. Average values for second-order fitting with different packaging methods at room temperature.
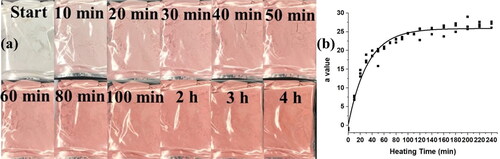
3.2.2. Increasing temperature
Increasing the environmental temperature causes a quicker color change in the spray-dried WPI and AA powders. shows the aging process of bag-packaged WPI- AA powders at 80 °C. For plastic bag packaging, the time constant for spray-dried powders is 1.2 ± 0.3 days at 20 °C, while the time constant is 33 ± 2 min at 80 °C as shown in . The temperature affects the redness process of the powders, so that combining different fitting lines of color change at different temperatures may help to track the time-temperature change more accurately.
Figure 5. (a) Heat spray-dried WPI:AA (10:1) powders at 80 °C in the oven; (b) The corresponding a values change with time and its first-order fitting line (R2 is 0.964).
For higher temperature conditions, the color change of samples as functions of time has a direct increase in the initial period, so first-order kinetics fits more appropriately. EquationEquation (3)(3)
(3) shows the results of a first-order fitting for the aging process of WPI-AA powders at 80 °C (the time t has units of minutes).
(3)
(3)
3.2.3. Applications
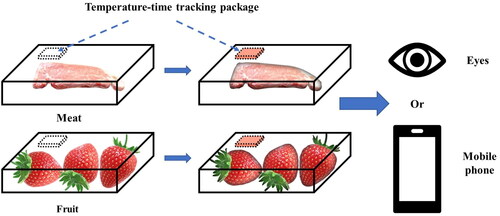
These redness processes for spray-dried WPI and AA materials can be used to develop intelligent packaging in the form of a food indicator to monitor the freshness status by tracking the time-temperature history in this study. This material is safe compared with other indicator materials, such as bromothymol blue or methyl red.[Citation4] Even if the indicator package degrades during transportation, relatively low health risks are likely to occur for people and for the environment. For food products, such as meat, vegetables or fruits, this intelligent packaging method may be used to track the time-temperature history based on the color change, which would be convenient for customers, as shown in . Customers can understand the state of the food products easily through visual observation. Different packaging methods, including tube and bag, affect the heat and mass transfer process, which further affects the color change of the powders under different temperatures. Therefore, the time-temperature sensor can be modified by changing the packaging methods for various applications. The time may be estimated more accurately by using the fitting lines, as shown in . When being scanned by a mobile phone, a QR code can be used to introduce information, including production date, packaging methods, calibrations and so on. Then, using a mobile phone to take pictures of indicating packages can help to analyze the time-temperature history more accurately via mobile phone applications.
Figure 6. Schematic diagram for the applications of the spray-dried WPI and AA materials.
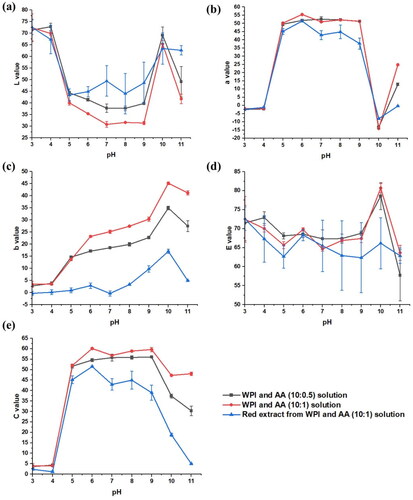
3.3. Color changes of the solutions in different pH environments
In this work, a simple mixture with only ascorbic acid and WPI has been studied over a range of ratios from 1:20 to 1:10 (AA: WPI). The red extract has been obtained from the WPI-AA tablets as shown in , and the extraction process has been discussed in Section 2.5.
Figure 7. The release process for the red component from tablets.
The colors of the solutions made from the spray-dried WPI-AA powders with different mass ratios, and the red extracts at different pH values were studied at room temperature (20 ± 2 °C). The 2 h 80 °C aged spray-dried powders with different WPI and AA ratios were added to deionized (DI) water, which was close to pH 6 initially. The HCl was used to gradually reduce the pH of the solution, while the NaOH was used to increase the pH. The pH of the red extract was also changed by the same process. The solution was observed to have different colors at various pHs between pH 3 and pH 11, as shown in . Initially, the pH was close to 6, and the solution was red. For the WPI and AA solutions, the redness was more turbid than the red extract. When the pH was decreased by adding HCl, the color changed significantly at a pH of 4, and the solution became completely clear and transparent. By using NaOH solution to increase the pH value of the solution, it became yellow at a pH of 10, and this change was shown in a decrease in the a value and an increase in the b value, as shown in . When the pH was further increased to 11, the solutions became brown. In terms of applications, people can judge the pH value of the solution based on observing the color, which is easy and safe.
Figure 8. The color change for the extracts at different pHs.
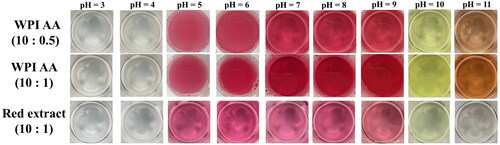
Figure 9. LAB analysis of the solutions under different pH conditions.
shows the FTIR spectra of samples under different pH conditions, while shows the FTIR spectra of pure ascorbic acid and FTIR spectra of spray-dried WPI with different pHs. The spray-dried WPI powders at a constant pH have the same FTIR spectra as the spray-dried WPI under acidic or alkaline conditions. After adding the NaOH solution, the group around a wavelength of 1400 cm−1 appeared in the FTIR measurements (). The structure of formyl threosyl pyrrole is described by Nagaraj & Monnier[Citation26] as shown in , and the (-COOH) group can generate the (-COO−) group in alkaline conditions. It has been reported that the (-COO−) group symmetrically stretches around (1400 cm−1),[Citation31] so these components may have been generated at high pH, showing a higher peak. By decreasing the pH value, the peak appeared around a wavelength of 1000 cm−1. The reason may be associated with the bending of the (C-O-C) (1023 cm−1) group,[Citation32] or out-of-phase C-C-O (1075–1000 cm−1) stretching,[Citation33] or (C-N) (1090–1040 cm−1) stretching,[Citation33] or (-OH) deformation (1030–1010 cm−1),[Citation32] which may be generated under acidic conditions and contribute to the peak around 1000 cm−1. The color changes at various pHs are caused by different functional groups and conformational changes in the proteins.
Figure 10. (a) FTIR spectra of the samples at different pHs; (b) FTIR spectra for pure ascorbic acid and spray-dried WPI at different pH values; (c) and (d) structure of the formyl threosyl pyrrole (FTP).[Citation26]
![Figure 10. (a) FTIR spectra of the samples at different pHs; (b) FTIR spectra for pure ascorbic acid and spray-dried WPI at different pH values; (c) and (d) structure of the formyl threosyl pyrrole (FTP).[Citation26]](/cms/asset/23b07361-6192-4d85-93cc-5b089e91e88a/ldrt_a_2175214_f0010_c.jpg)
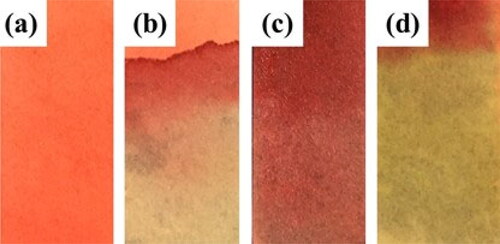
3.4. Indicator labels
Compared with spray-dried WPI and AA powders or their solutions, an indicator label is relatively easy to carry and use under different conditions. This pH indicator label was produced by the method described in Section 2.6. The pH indicator label has the advantage of not degrading quickly due to microbiological action. In contrast, the corresponding solution may degrade due to microbiological changes over the time scale of days. shows the color changes of the indicator labels at different pHs, which can help to determine the acidity or alkalinity of unknown solutions by visual observation. These solutions may include any drinks or any water in the natural environment. The indicator label may be safer, compared with most pH test papers, such as thymol blue, methyl orange or methyl red, which include toxic chemicals. This new pH indicator is simple, rapid, low-cost and has relatively low safety impacts on human health or the environment.
Figure 11. The pH indicator labels under different conditions: (a) blank; (b) HCl solution; (c) water; (d) NaOH solution.
4. Conclusions
After the aging process, the spray-dried whey protein and L-ascorbic acid powders underwent a color change and became red. By using this characteristic, a packaging indicator of temperature and time tracking was developed. The color change indicates the fresh status of the food, which can be observed by visual observation. With first-order and second-order fitting equations, the time can be tracked more accurately with the help of a simple look-up system. With the feature of color changes at different pHs, the spray-dried WPI and AA powders and their red extracts have been used to produce a new low-toxicity pH indicator, which can indicate the pH value by visual observation. These indicators are simple, low-cost and environmentally friendly.
Author contribution statement
Chao Zhong: Conceptualization, Methodology, Formal analysis, Investigation, Writing - original draft; Songwen Tan: Conceptualization, Methodology, Investigation; Zelin Zhou: Investigation, Methodology; Xia Zhong: Investigation; Timothy Langrish: Resources, Writing - review & editing, Supervision.
Disclosure statement
No potential conflict of interest was reported by the author(s).
Data availability statement
The data that supports the findings of this study are available from the corresponding author upon reasonable request.
Additional information
Funding
References
- Sonneveld, K. What Drives (Food) Packaging Innovation? Packag. Technol. Sci. 2000, 13, 29–35. DOI: 10.1002/(SICI)1099-1522(200001/02)13:1 < 29::AID-PTS489 > 3.0.CO;2-R.
- Byrne, D.V. Current Trends in Food Health and Safety in Cross-Cultural Sensory and Consumer Science. Foods 2021, 10, 965. DOI: 10.3390/foods10050965.
- Kher, S. V.; Frewer, L. J.; de Jonge, J.; Wentholt, M.; Davies, O. H.; Luijckx, N. B. L.; Cnossen, H. J. E. Perspectives on the Implementation of Traceability in Europe. Br. Food J. 2010, 112, 261–274. DOI: 10.1108/00070701011029138.
- Nopwinyuwong, A.; Trevanich, S.; Suppakul, P. Development of a Novel Colorimetric Indicator Label for Monitoring Freshness of Intermediate-Moisture Dessert Spoilage. Talanta 2010, 81, 1126–1132. DOI: 10.1016/j.talanta.2010.02.008.
- Rukchon, C.; Nopwinyuwong, A.; Trevanich, S.; Jinkarn, T.; Suppakul, P. Development of a Food Spoilage Indicator for Monitoring Freshness of Skinless Chicken Breast. Talanta 2014, 130, 547–554. DOI: 10.1016/j.talanta.2014.07.048.
- Choi, S.; Eom, Y.; Kim, S. M.; Jeong, D. W.; Han, J.; Koo, J. M.; Hwang, S. Y.; Park, J.; Oh, D. X. A Self-Healing Nanofiber-Based Self-Responsive Time-Temperature Indicator for Securing a Cold-Supply Chain. Adv. Mater. 2020, 32, 1907064. DOI: 10.1002/adma.201907064.
- Meng, J.; Qian, J.; Tang, Y. A Solid-State Time-Temperature Indicator Used in Chilled Fresh Pork Monitoring. Packag. Technol. Sci. 2018, 31, 353–360. DOI: 10.1002/pts.2328.
- Wu, D.; Zhang, M.; Chen, H.; Bhandari, B. Freshness Monitoring Technology of Fish Products in Intelligent Packaging. Crit. Rev. Food Sci. Nutr. 2021, 61, 1279–1292. DOI: 10.1080/10408398.2020.1757615.
- Weston, M.; Geng, S.; Chandrawati, R. Food Sensors: Challenges and Opportunities. Adv. Mater. Technol. 2021, 6, 2001242. DOI: 10.1002/admt.202001242.
- Yoshida, C. M. P.; Maciel, V. B. V.; Mendonça, M. E. D.; Franco, T. T. Chitosan Biobased and Intelligent Films: Monitoring PH Variations. LWT - Food Sci. Technol. 2014, 55, 83–89. DOI: 10.1016/j.lwt.2013.09.015.
- Weston, M.; Phan, M. A. T.; Arcot, J.; Chandrawati, R. Anthocyanin-Based Sensors Derived from Food Waste as an Active Use-by Date Indicator for Milk. Food Chem. 2020, 326, 127017. DOI: 10.1016/j.foodchem.2020.127017.
- Zhai, X.; Li, Z.; Zhang, J.; Shi, J.; Zou, X.; Huang, X.; Zhang, D.; Sun, Y.; Yang, Z.; Holmes, M.; et al. Natural Biomaterial-Based Edible and PH-Sensitive Films Combined with Electrochemical Writing for Intelligent Food Packaging. J. Agric. Food Chem. 2018, 66, 12836–12846. DOI: 10.1021/acs.jafc.8b04932.
- Kirkbright, G. F.; Narayanaswamy, R.; Welti, N. A. Fibre-Optic PH Probe Based on the Use of an Immobilised Colorimetric Indicator. Analyst 1984, 109, 1025–1028. DOI: 10.1039/an9840901025.
- Mirlohi, M.; Manickavasagan, A.; Ali, A. The Effect of Protein Drying Aids on the Quantity and Quality of Spray Dried Sugar-Rich Powders: A Systematic Review. Dry. Technol. 2022, 40, 1068–1082. DOI: 10.1080/07373937.2020.1856131.
- Fröhlich, J. A.; Spiess, M.; Hinrichs, J.; Kohlus, R. Nozzle Zone Agglomeration in Spray Dryers: Process Dependency of the Fines Mass Flow and Its Importance for Agglomerate Formation. Dry. Technol. 2022. DOI: 10.1080/07373937.2022.2111439.
- Linke, T.; Happe, J.; Kohlus, R. Laboratory-Scale Superheated Steam Spray Drying of Food and Dairy Products. Dry. Technol. 2022, 40, 1703–1714. DOI: 10.1080/07373937.2020.1870127.
- Wang, Y.; Shi, X.; Ren, W.; Wu, F.; Zhao, L.; Du, R.; Lin, X.; Wang, Y. The Effect of Plant-Derived Peptides on the Hot-Melt Stickiness of Herbal Extracts during Spray Drying. Dry. Technol. 2022. DOI: 10.1080/07373937.2022.2106239.
- Golubitskii, G. B.; Budko, E. V.; Basova, E. M.; Kostarnoi, A. V.; Ivanov, V. M. Stability of Ascorbic Acid in Aqueous and Aqueous-Organic Solutions for Quantitative Determination. J. Anal. Chem. 2007, 62, 742–747. DOI: 10.1134/S1061934807080096.
- Seacheol, M.; Krochta, J. M. Ascorbic Acid-Containing Whey Protein Film Coatings for Control of Oxidation. J. Agric. Food Chem. 2007, 55, 2964–2969. DOI: 10.1021/jf062698r.
- Pal, A.; Kant, K. Smart Sensing, Communication, and Control in Perishable Food Supply Chain. ACM Trans. Sen. Netw. 2020, 16, 1–41. DOI: 10.1145/3360726.
- Do Nascimento Nunes, M. C.; Nicometo, M.; Emond, J. P.; Melis, R. B.; Uysal, I. Erratum: Improvement in Fresh Fruit and Vegetable Logistics Quality: Berry Logistics Field Studies. Philos. Trans. R. Soc. A Math. Phys. Eng. Sci. 2014, 372, 2022. DOI: 10.1098/rsta.2014.0212.
- Kuswandi, B.; Nurfawaidi, A. On-Package Dual Sensors Label Based on PH Indicators for Real-Time Monitoring of Beef Freshness. Food Control 2017, 82, 91–100. DOI: 10.1016/j.foodcont.2017.06.028.
- Zhong, C.; Tan, S.; Langrish, T. Redness Generation via Maillard Reactions of Whey Protein Isolate (WPI) and Ascorbic Acid (Vitamin C) in Spray-Dried Powders. J. Food Eng. 2019, 244, 11–20. DOI: 10.1016/j.jfoodeng.2018.09.020.
- Sant’Anna, V.; Gurak, P. D.; Ferreira Marczak, L. D.; Tessaro, I. C. Tracking Bioactive Compounds with Colour Changes in Foods – A Review. Dye. Pigment 2013, 98, 601–608. DOI: 10.1016/j.dyepig.2013.04.011.
- Matiacevich, S. B.; Santagapita, P. R.; Buera, M. P. Fluorescence from the Maillard Reaction and Its Potential Applications in Food Science. Crit. Rev. Food Sci. Nutr. 2005, 45, 483–495. DOI: 10.1080/10408390591034472.
- Nagaraj, R. H.; Monnier, V. M. Protein Modification by the Degradation Products of Ascorbate: Formation of a Novel Pyrrole from the Maillard Reaction of l-Threose with Proteins. Biochim. Biophys. Acta (BBA)/Protein Struct. Mol. 1995, 1253, 75–84. DOI: 10.1016/0167-4838(95)00161-M.
- Wang, S.; Langrish, T. A Review of Process Simulations and the Use of Additives in Spray Drying. Food Res. Int. 2009, 42, 13–25. DOI: 10.1016/j.foodres.2008.09.006.
- Wang, S.; Langrish, T. A. G. A Distributed Parameter Model for Particles in the Spray Drying Process. Adv. Powder Technol. 2009, 20, 220–226. DOI: 10.1016/j.apt.2009.03.004.
- Vehring, R. Pharmaceutical Particle Engineering via Spray Drying. Pharm. Res. 2008, 25, 999–1022. DOI: 10.1007/s11095-007-9475-1.
- Shinskey, F. G. G. Process Control Systems: Application, Design and Tuning. McGraw-Hill, Inc: New York. 1990.
- Mizuguchi, M.; Nara, M.; Kawano, K.; Nitta, K. FT-XR Study of the Ca2+-Binding to Bovine α-Lactalbumin. Relationships between the Type of Coordination and Characteristics of the Bands Due to the Asp COO- Groups in the Ca2+-Binding Site. FEBS Lett. 1997, 417, 153–156. DOI: 10.1016/S0014-5793(97)01274-X.
- Yohannan Panicker, C.; Tresa Varghese, H.; Philip, D, FT-IR, FT-Raman and SERS Spectra of Vitamin C. Spectrochim. Acta - Part A Mol. Biomol. Spectrosc. 2006, 65, 802–804. DOI: 10.1016/j.saa.2005.12.044.
- Patnaik, P. Dean’s Analytical Chemistry Handbook, 2nd ed.; McGraw-Hill handbooks, McGraw-Hill: New York, 2004.