
 ?Mathematical formulae have been encoded as MathML and are displayed in this HTML version using MathJax in order to improve their display. Uncheck the box to turn MathJax off. This feature requires Javascript. Click on a formula to zoom.
Abstract
Amyloid fibrillation is the root cause of several neuro as well as non-neurological disorders. Understanding the molecular basis of amyloid aggregate formation is crucial for deciphering various neurodegenerative diseases. In our study, we have examined the lysozyme fibrillation process using nano-infrared spectroscopy (nanoIR). NanoIR enabled us to investigate both structural and chemical characteristics of lysozyme fibrillar species concurrently. The spectroscopic results indicate that lysozyme transformed into a fibrillar structure having mainly parallel β-sheets, with almost no antiparallel β-sheets. Features such as protein stiffness have a good correlation with obtained secondary structural information showing the state of the protein within the fibrillation state. The structural and chemical details were compared with transmission electron microscopy (TEM) and circular dichroism (CD). We have utilized nanoIR and measured infrared spectra to characterize lysozyme amyloid fibril structures in terms of morphology, molecular structure, secondary structure content, stability, and size of the cross-β core. We have shown that the use of nanoIR can complement other biophysical studies to analyze the aggregation process and is particularly useful for studying proteins involved in aggregation to help in designing molecules against amyloid aggregation. Specifically, the nanoIR spectra afford higher resolution information and a characteristic fingerprint for determining states of aggregation.
Communicated by Ramaswamy H. Sarma
Introduction
Understanding the mechanism of protein folding which renders proteins in their functional state is of fundamental importance. Some proteins fail to fold correctly, misfold and aggregate under various cell conditions and result in a wide range of diseases (Dobson, Citation2001; Pepys, Citation2006). Protein misfolding and aggregation is the molecular and biochemical basis of pathological conditions in many neurodegenerative diseases including Alzheimer’s disease, Parkinson’s disease, Huntington’s disease, amyotrophic lateral sclerosis and others (Fatima, Islam, Ahmad, & Salahuddin, Citation2017; Stefani, Citation2004). These neurodegenerative diseases are often associated with the extracellular insoluble deposits called amyloid fibrils that can lead to the damage of tissues (Kelly, Citation1998). Amyloid fibrils along with non-fibrillar oligomers populate in the brain of patients and produce the cytotoxic effect (Bucciantini et al., Citation2002; Campioni et al., Citation2010; Meyer-Luehmann et al., Citation2008; Xue et al., Citation2009). The complexity of these protein aggregation diseases, despite progress toward understanding aggregation, is difficult to determine (Lansbury & Lashuel, Citation2006). Although the pathway by which an amyloidogenic protein assembles into amyloid fibrils remains poorly understood, a growing body of evidence suggests that the formation of linearly ordered protein aggregates involves structural intermediates that assemble into increasingly complex quaternary structures, including amyloid protofilaments, which ultimately assemble into amyloid fibrils (Chiti & Dobson, Citation2006; Kelly, Citation1998). Surprisingly, the formation of fibrils does not depend on the amino acid sequence, overall structure, and function of the protein and consists of a core structure mainly containing cross-β-fiber (Sunde et al., Citation1997; Sunde & Blake, Citation1997). Although, the understanding of diseased proteins such as amyloid peptides (Aβ) (Dutta & Basu, Citation2020; Grasso, Leanza, Morbiducci, Danani, & Deriu, Citation2019; Shuaib, Saini, Goyal, & Goyal, Citation2020; Turner, Mutter, & Platts, Citation2019) and their inhibition (Ghorbani, Soleymani, Allahverdi, Shojaeilangari, & Naderi-Manesh, Citation2019; Liu, Ma, Sang, & Lu, Citation2019; Narang, Goyal, & Goyal, Citation2019) is documented, there is still a need to explore the fibrillation process for better therapeutics.
Lysozymes have been studied extensively and their physiochemical properties have been examined in detail. Lysozymes are suitable as a model protein to elucidate the mechanism of amyloid fibril formation. Lysozyme is also associated with familial lysozyme systemic amyloidosis, where amyloid deposits form in patients due to mutations in the protein (Dumoulin, Kumita, & Dobson, Citation2006; Pepys et al., Citation1993). The amyloidogenic mutations are unstable forming partly folded intermediates, with transformation of the mainly helical native fold to the amyloid fibril cross-β fold (Furkanet al., Citation2019; Masino et al., Citation2011; Swaminathan, Ravi, Kumar, Kumar, & Chandra, Citation2011).
NanoIR spectroscopy is a newly developed analytical technique, providing chemical analysis using infra-red (IR) laser as well as spatial resolution via atomic force microscopy (AFM) (A. Dazzi, Prazeres, Glotin, & Ortega, Citation2005). The IR radiation interaction with the sample locally heats the sample, which leads to rapid thermal expansion of the sample. This local expansion is detected by the cantilever tip and can be measured, making it possible to extrapolate the amplitudes and oscillations for further analysis (Dupas, Gremaud, Kulik, & Loubet, Citation2001). Recently, poly-glutamine (polyQ) repeat containing proteins involved in Huntington’s disease were studied detailing their fibrillar aggregates and provided novel insights into the molecular and structural basis of aggregation and toxicity (Ruggeri et al., Citation2016). Similarly, aggregation of the Josephin domain of ataxin-3, implicated in spinocerebellar ataxia-3, was investigated and characterized (Ruggeri et al., Citation2015). This study describes the associated oligomeric and fibrillar species formed during amyloid aggregation. With the ability to obtain spatially resolved IR spectra, high-resolution chemical images collected at specific IR wavenumbers and the ability to control IR excitation laser, it is possible to obtain pertinent information regarding molecular orientation in electrospun nanofibers (Dazzi et al., Citation2012).
In this work, we used nanoscale infrared spectroscopy to study the lysozyme aggregation and fibrillization. We correlated the morphological, mechanical and secondary structural properties of lysozyme aggregates at the nanometer scale. The study of the amyloidogenic structures revealed the formation of β-sheet formation during fibrillation. We have used other biophysical techniques like transmission electron microscopy and circular dichroism to complement and validate the results. The fibrils were produced by incubating the protein at high temperatures. Lysozyme is a common model protein for studies of amyloidogenesis, as it easily forms amyloid-like fibrils with β-pleated sheet structure under various conditions (Antosova et al., Citation2011; Gazova, Siposova, Kurin, Mučaji, & Nagy, Citation2013; Swaminathan et al., Citation2011). Our results delineate the characteristic features of different species of fibrils and also highlight the use of nanoIR for characterizing such amyloid fibrils or aggregates.
Material and methods
Formation of lysozyme fibrils
Hen egg-white lysozyme was prepared in distilled water adjusted to pH 2 with HCl. The final protein concentration was 1 mM (molecular weight of lysozyme =14.3 kDa, extinction coefficient, ε1% =26.4 at 280 nm). Aliquots were incubated at 65 °C for 21 days to allow sufficient fibrillization to occur (Harte et al., Citation2015; Krebs et al., Citation2000) and sample was taken at various day intervals. Control lysozyme was prepared fresh on the day at room temperature at pH 2.
NanoIR measurements
Nanoscale IR spectra were recorded using a Nano-IR2 platform (Anasys, CA, USA) that combines high-resolution AFM and a tunable infrared laser (OPO laser). A background IR spectra were measured at 100% IR laser power where three single spectra were collected and averaged at 4 cm−1 spectral resolution. The protein samples were deposited on a coverslip glass surface. The samples were left in a nitrogen gas chamber to dry. The AFM-IR measurements were performed in contact mode using a gold-coated cantilever with a nominal radius of 25 nm probes, Model: PR-EX-nIR2-10, resonance frequency (kHz): 13 +/−4 kHz, spring constant (N/m): 0.07 − 0.4 Nm−1. The AFM-IR probes are gold coated, microfabricated silicon probes that are ∼450 microns long. AFM images were collected with a scan rate of 1 Hz and an area of 60 µm X 60 µm was investigated. AFM-IR spectra were acquired within a wavenumber range of 1200–1800 cm−1, using 16 scans per spectrum and 4 cm−1 spectral resolution. Multiple spectra were collected from different regions using the array mode function with an achievable spatial resolution of 30 nm and the spectra were averaged from at least 20 measurements. AFM-IR chemical images were recorded at IR power of 8.1% and oscillating frequency centered at 200 kHz with a spatial resolution of 10 nm. The Nano-IR imaging was performed with a rate line of 0.1–1 Hz. The AFM, IR spectra and images were treated using the built-in Anasys software (Analysis Studio v3.14, 2017). The height and infrared peak and amplitude images were first-order flattened. The spectra were smoothed using a Savitzky–Golay filter and drawn with Origin PRO 8, 2018. All measurements were performed at room temperature.
Mechanical properties analysis
The mechanical properties of the samples were measured by a new method known as amplitude modulation frequency modulation (AM-FM) carried out by a MFP-3D AFM system (Oxford Instruments Asylum Research, USA) using an AC160TS cantilever with tip - Al reflex coated Veeco model–OLTESPA (Olympus, Japan). This mode is an extension of standard Tapping mode, while the cantilever is excited simultaneously at a fundamental resonant frequency and another eigenmode. The mechanical properties were determined by tracking the frequency and amplitude-shift of other eigenmodes. The obtained frequency shift Δf was used for estimating the interaction stiffness ΔkFM
by the approximation
(1)
(1)
where kc represents the spring constant of the cantilever and fc is the frequency of the eigenmode of the cantilever. A general Hertz model describing the contact mechanics between the tip and sample was used to obtain the Young’s modulus and stiffness of the analyzed sample. The calibration of the cantilever and calculation of its elasticity was carried out using polystyrene standard with known Young’s modulus (3.3 GPa). This obtained cantilever elasticity was then used for obtaining absolute values of Young’s modulus of analyzed samples.
Transmission electron microscopy (TEM)
Lysozyme solutions of 10 μM concentration were applied to carbon-coated copper grids, blotted, washed, negatively stained with 2% uranyl acetate, and air-dried. The grids were analyzed with an FEI Talos F200C transmission electron microscope operating at an accelerating voltage of 80 kV. The images were analyzed by TEM imaging and analysis software provided with the microscope.
Circular dichroism (CD)
To investigate the secondary structural content in lysozyme with increasing fibrillation and their change as a function of temperature, CD experiments were carried out. CD spectra were obtained using a Chirascan CD spectrometer (Applied Photophysics) equipped with a water bath to control the temperature at 25 °C. The temperature for the experiments was controlled with a Peltier temperature control unit (Quantum northwest). The concentration of lysozyme was 10 μM. Cells with path lengths of 1 mm were used for far-UV (from 190 to 250 nm) data acquisition. Three scans were averaged to obtain each spectrum and the final spectra of lysozyme were obtained by subtracting it from buffer spectra. The results were plotted as mean residue ellipticity (MRE) in deg.cm2.dmol−1.Secondary structure determination from the far-UV CD spectra was performed by using the CONTIN with spectral basis sets derived by Sreerama and Woody (Sreerama & Woody, Citation1993).
For thermal melting experiments, temperature scans were done with temperatures starting from 25°C to 90°C, with a temperature ramp of 3 °C/min. Heat-induced spectral changes were followed at two different wavelengths, 222 (for α-helices) and 218 nm (for β-sheets).
Principal component analysis
We performed the PCA by using an eigen-decomposition procedure on mean-centered data, using the ‘prcomp’ function in ‘stats’ package, ‘factoextra’ package (version 1.0.5, https://cran.r-project.org/web/packages/factoextra/index.html) and ‘plot3D’ (version 1.1.1, https://cran.r-project.org/web/packages/plot3D/index.html) package for visualizing the PCA plots in R (version 3.4.4). Analysis was performed on smoothed and baseline corrected spectra.
Hierarchical cluster analysis (HCA)
HCA was applied to compare the 2 sets of spectral samples from day 1 to 21 of the experiment based on the PCA projections in 3-dimensional score space using the ‘A2R’ package (http://addictedtor.free.fr/packages/A2R/lastVersion/html/A2Rplot.html) in R. HCA was used to group samples of spectra that displayed the same degree of similarity by calculating the Euclidean distance between all the data points using Ward’s algorithm. The result was visualized in a dendrogram.
Machine learning for nano IR
To discriminate the two species (lysozyme oligomers and lysozyme fibrils) we used an interpretable tree-based machine learning model enabled by Random Forests(Breiman, Citation2001) based on ratios of spectral features (such as amide I, amide II, amide III, parallel β-sheet, antiparallel β-sheet and band at 1400 cm−1). Random Forest (RF) adopts ensemble based supervised white-box learning techniques and its algorithm applies the general technique of bagging or bootstrapped aggregating(Breiman, Citation1996) to decision tree learners and is an ultimately collection of decision trees.
Results
Amyloid formation is linked to various human diseases, although the detailed mechanisms causing amyloid formation still remain a challenge, primarily due to their nanoscale dimensions and heterogeneous nature. NanoIR allows direct measurements and correlation of the biophysical properties of protein aggregates at the nanoscale level.
Morphological characteristics of lysozyme oligomers and fibrils
The formation of lysozyme amyloid fibrils is well documented and can be achieved by high temperature and low pH conditions (Kar et al., Citation2016; Vuong et al., Citation2013). We formed lysozyme amyloid fibrils under acidic condition, at pH 2.0, incubating the protein sample at 65 °C. We deposited the lysozyme sample on glass coverslip and incubated it in a nitrogen stream for 1 h before measuring the height and spectra ). The height and deflection of day 21 fibrils differed compared to day 1 (). The day 21 fibrils were thick and long with an average height of 215 nm and average cross-sectional dimensions (in-plane distances) up to ≈ 11.5 µm while the average surface cross-section (surface distance) ≈ 11.74 µm (). At day 1, lysozyme forms blobs, which were thin and small, representing higher oligomeric species. The morphology of day 1 oligomers had height (vertical distance) ranging from 15 to 20 nm and average cross-sectional dimensions (in-plane distances) up to ≈530 ± 120 nm while the average surface cross-section (surface distance) ≈ 560 ± 140 (). The day 1 feature were distinct from day 21, representing two different species. A statistical analysis of the day 1 species’ height compared with that of day 21 species showed that their average height increased as a function of the incubation time during the process of fibrillization. The oligomeric species at day 1 had an average height of ∼ 15.2 nm, while the fibrils at day 21 had an average height of ∼191 nm (). Similar results were observed for ataxin-3 fibrils (Masino et al., Citation2011) which recapitulated the process of fibrillation undergoing various stages with higher oligomeric and protofilaments as intermediates. Spectra were collected from the coverslip glass substrate and compared with the protein samples spectra in order to eliminate any possible effect of the underlying substrate ().
Figure 1. Surface topography (height), and IR absorption pattern (deflection) of the lysozyme fibrils/oligomers. (a) Height and (b) deflection on day 21. (c) Height and (d) deflection on day 1. Data contributing to the IR-absorption map were acquired at a wavenumber of 1650 cm−1. The lysozyme sample was prepared in distilled water adjusted to pH 2 with HCl. The protein samples with the final protein concentration of 1 mM, were deposited on a cover slip glass surface and the samples were left in a nitrogen gas chamber to dry before nanoIR measurements.
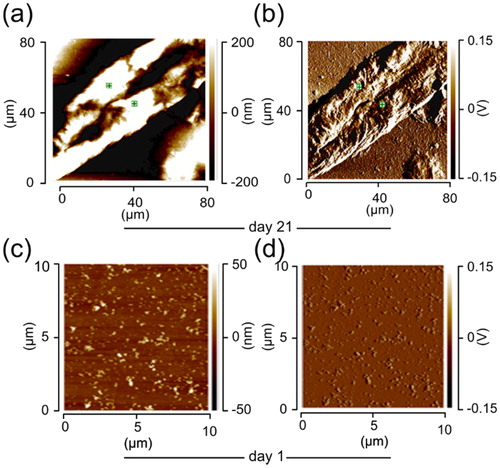
Figure 2. Stiffness and Young’s modulus of lysozyme fibrils. The day 1 lysozyme was shown in red color, having the lowest stiffness as well as Young’s modulus. The days 3, 10 and 21 were shown in maroon, blue and yellow color, respectively.
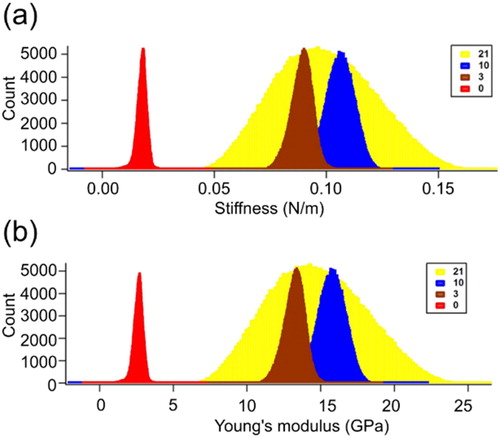
Amplitude modulation-frequency modulation (AM-FM) was implemented, along with nanoIR AFM, to obtain the mechanical characteristics of fibrils and other structural species. The stiffness and related Young’s modulus were measured to analyze the relative fibrillation of lysozyme (). The stiffness increased with fibrillation (). The day 21 fibrils show broad stiffness compared with lysozyme fibrils or oligomeric species obtained from shorter incubations. The stiffness at day 1 was ∼0.02 (N/m) and increased gradually reaching a maximum at day 10 and maintaining the stiffness up to day 21 with a value of ∼0.085 (N/m). The mean value of Young’s modulus for day 21 fibrils was 14.5 GPa, which is similar to day 10 fibrils (). The stiffness, as well as Young’s modulus of monomeric lysozyme (day 1) is significantly lower compared to fibrillar structures of lysozyme.
Differential structural features of lysozyme species
The morphology map of the protein samples was used to guide the AFM tip to different points of the substrate to collect their respective IR absorption spectra (). This approach was used to investigate, analyze and compare the protein secondary structure of lysozyme proteins at day 21 and day 1 as well as to analyze their mechanical and biochemical differences. The average of the IR spectrum for day 21 and 1 are shown in , respectively. The IR absorption spectra were collected in the range of 1200–1800 cm−1 which is characteristic for amide bands I, II and III of proteins.
Figure 3. nanoIR absorption spectra acquired at two different days. The amide I, II and III regions of the spectra were highlighted, which were used to derive the secondary structure content of the lysozyme at day 21 and day 1. (a) and (b) represent the various number of the spectra taken of the lysozyme sample. (c) and (d) represent averaged spectra of (a) and (b).
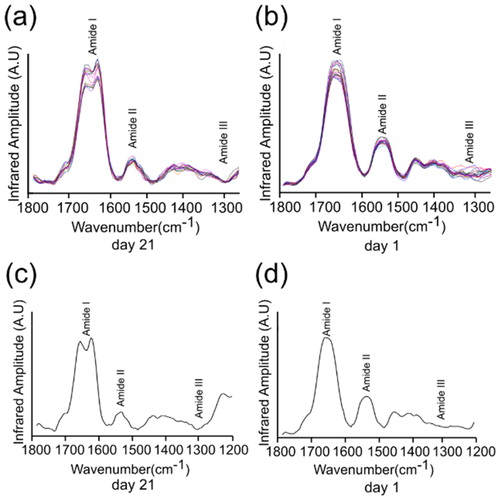
Amide I, II and III spectral bands were used to study protein secondary structure. Amide I band primarily arises from backbone C = O stretching vibrations in the spectral range of 1700–1600 cm−1 and was found to vary in position, line shape and intensity based on the backbone conformation and secondary structure of the protein (Baldassarre, Li, Eremina, Goormaghtigh, & Barth, Citation2015; Barth, Citation2007). Amide I band is composed of many assignments such as β-sheet within 1635–1610 cm−1; random coil at 1645–1630 cm−1; α-helical at 1660–1650 cm−1; antiparallel β-sheet and β-turn within 1695–1665 cm−1 (Supplementary Table 1).
IR spectra were collected from several representative regions of the fibrillar lysozyme sample. At day 21, it was dominated by amide I absorption in the range of 1600–1700 cm−1 (). The IR spectra of day 1 were also dominated by amide I absorption in the range of 1600-1700 cm−1 with strong absorption of amide II band at 1540 cm−1, (). Curve deconvolution of the average IR spectrum was used to estimate protein secondary structure content ( for day 21 and for day 1; )
The parallel β-sheet/α-helical and antiparallel β-sheet/α-helical ratios were 35.00% and 12.32%, respectively, for day 1, while it was 43.75% and 0.3766%, respectively, for day 21, indicating the presence of α-helix as well as β-sheet. The amide III band at 1300 cm−1 was coupled with a second IR band arising at ≈1400–1450 cm−1 and the relative ratio of these two bands provides information about the oligomerization and aggregation behavior of the protein (Roeters et al., Citation2017; Ruggeri et al., Citation2016). The relative ratio of the peak at 1400–1450 cm−1/amide III band at 1300 cm was 2.671.
There was a significant increase in the parallel β-sheet structure at ≈1625 cm−1 for day 21 compared to day 1. The ratio of parallel β-sheet/α-helical was 43.75% for day 21 whereas it was 35% for day 1, indicating a shift toward forming more parallel β-sheet strands. The absorption at ≈1440–1400 cm−1 becomes very strong in the day 21 spectra with a relative ratio (1400–1450 cm−1/amide III band at 1300 cm−1) of 55.45. The ratio was 2.67 in day 1 suggesting that the day 21 lysozyme species was significantly different from day 1 species. Spectral signature analysis of amide I band of day 21 showed that the antiparallel β-sheet at ≈1695 cm−1/parallel β-sheet at ≈1625 cm−1 was 0.00860 whereas at day 1 it was 0.3520. The antiparallel β-sheet at 1695 cm−1/parallel β-sheet at 1625 cm−1 on day 21 was close to zero (≤ 0.05) and associated with an increased 1400–1450 cm−1/amide III ratio, indicating a characteristic fibrillar species while day 1 represented higher oligomeric form.
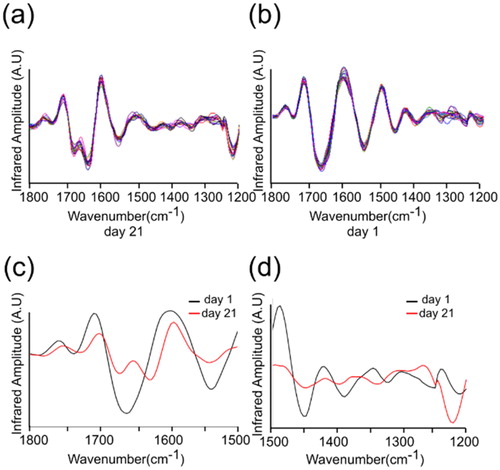
The quantification showed that amide I band peak in the lysozyme samples at day 1 appeared at 1655 cm−1 (α-helical structure conformations), and the band significantly shifted in the lysozome samples at day 21 and appeared at ≈1625 cm−1 (parallel β-sheet structure) (). The relative distribution of amide I components can be determined from the second-derivative of the IR spectra (). The second-derivative spectra also revealed that the amide I band of lysozome samples at day 21 was shifted from ≈1655 cm−1 (α-helical structure) to ≈1625 cm−1 (parallel β-sheet conformation) ().
Figure 4. The second derivative absorption spectra acquired at two different days, day 21 and day 1. (a) The day 21 spectra taken from wavenumber 1800 to 1200 cm−1. (b) The day 1 spectra taken from wavenumber 1800 to 1200 cm−1. (c) Averaged spectra of (a) and (b) representing wavenumber from 1800 to 1500 cm−1. (d) Averaged spectra of (a) and (b) representing wavenumber from 1500 to 1200 cm−1.
Dynamics of lysozyme during fibrillation
CD spectra of lysozyme were collected and analyzed in far-UV regions at various time intervals. The spectra were taken after 24 h (day 1) was significantly different from the monomeric lysozyme (day 0) (). The spectrum of native lysozyme (day 0) had a high content of α-helical structure as indicated by ellipticity signals at 208 and 222 nm. During fibrillation, monomeric proteins undergo internal structural rearrangement with a cross β-sheet quaternary structure. The far-UV spectra of day 21 indicated the typical β-sheet containing protein (Kar et al., Citation2016) and are the fingerprint of amyloid fibrils (). To analyze the features of the structural changes, secondary structure compositions of the protein were calculated from the CD spectra (Supplementary Table 2). The α-helical content decreased with fibrillation and the content of β-sheet structure increased as also observed in nanoIR studies. These results suggest that the conformation of lysozyme transforms from an α-helical structure to a β-sheet structure during fibrillation.
Figure 5. Secondary structural dynamics and morphological features. (a) Far-UV CD spectra of lysozyme at various day intervals. The spectra were measured using a Chirascan CD spectrometer at 25 °C. The concentration of lysozyme was 10 μM and the cell path lengths were of 1 mm were used for far-UV (from 190 to 250 nm) data acquisition. Three scans were averaged to obtain each spectrum and final spectra of lysozyme was obtained by subtracting it from buffer spectra. (b) The TEM images of lysozyme amyloid fibrils. Electron micrograph showing the morphological features of a negatively stained preparation of 10 μM lysozyme incubated at 65 °C for various days. Amyloid fibrils of lysozyme have linear and unbranched structural morphology.
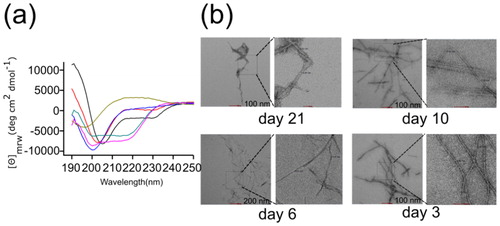
Visualization of lysozyme was also performed with TEM, where the typical morphology of amyloid fibrils was observed. We observed the fibrillar structure from day 3. The TEM images of the lysozyme fibrils () were linear and unbranched with similar morphology comparing samples from different incubation times. The mature fibrils were twisted with an average diameter of around 8 − 12 nm. All known amyloid fibrils, regardless of the nature of the main protein component or the source of the fibrils, are about 10 nm wide, and have no branch points (Sunde & Blake, Citation1997). Similarly, in the electron micrographs, the lysozyme precipitates displayed a typical amyloid protofilament form, having a diameter of 70 Å with no branching (Goda et al., Citation2000).
Chemometric and hierarchial clustering of lysozyme fibrils/oligomers
We performed principal components analysis (PCA) to distinguish the spectral differences measured between the samples on day 21 and day 1. PCA helps in deciphering the subtle differences within the spectra as well as in background reduction (Ruggeri et al., Citation2015, Citation2016). The IR spectrum of wavelengths between wavenumbers 1750 cm−1 and 1270 cm−1 were used for PCA analysis. The score plots from the PCA analysis represent the spectra of these samples in a 3-dimensional space of PCs. The score plot enabled analysis showing that the first PC captures more than 95% of the total variance in the data while the second and third PCs capture 2% and 1.4% of the total variance in the data, respectively (). The loadings plot shows which wavelengths are responsible in the data set for the maximum degree of separation inside this spectral collection (). The loading corresponding to PC1 is negatively correlated with all the wavelengths as observed in and PC1 helps to clearly distinguish the spectral samples belonging to the day 1 experiment (negative values in PC1 dimension i.e. oligomers from the spectra for the day 21 experiment) (positive values in PC1 dimension i.e. amyloid fibrils as depicted in ). PC1 can explain majority of the regions of the spectra considered during chemometric analysis (). In particular, PC1 has high R2 and hence can explain well the regions between the wavelengths 1750–1620, 1590–1510, and 1480-1370. PC 2 has a contribution in the wavelengths between 1620 and 1590 cm−1 and wavelengths between 1370 and 1300 cm−1. Similarly, PC3 can explain variations in the regions between the wavelengths 1300–1270 cm−1. All other principal components would be associated with the noise in the spectral collection as these 3 PCs together explain approximately 99% of the variance in the data ().
Figure 6. Chemometric and hierarchial analysis of IR spectra. (a) Variance plot of the IR spectra of lysozyme showing the amount of variance captured by each principal component. (b) PCA score plot. (c) Loading plot for the IR spectra ensemble of lysozyme fibrillation. (d) Cumulative proportion plot for the IR spectra ensemble of lysozyme fibrillation. (e) Hierarchical clustering of the spectra for the two different lysozyme fibrils type.
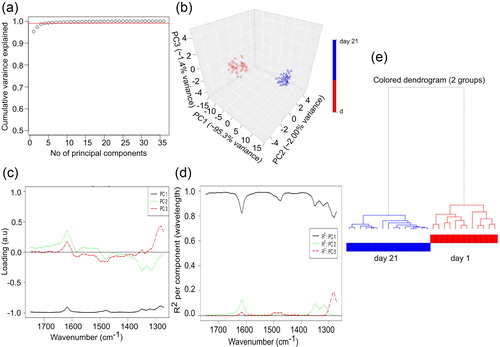
We next generated a hierarchical dendrogram of all the spectral samples belonging to the day 1 and day 21. For each cluster, we generated the representative low-dimensional embedding for that cluster by taking a mean over all the points in Figure 8b that belong to either day 1 or day 21. We then generated a dendrogram using the ‘A2Rplot’ function from the A2R package (‘Generic plot function for package A2R,’ n.d.) in R. The resulting dendrogram was showcased in .
In order to identify differences based on ratios of distinct features (such as amide I, amide II, amide III, parallelβ-sheet, antiparallel β sheet, etc.), we used a tree-based machine learning model namely Random Forests (Breiman, Citation2001). The RF algorithm applies the general technique of bagging or bootstrapped aggregating (Breiman, Citation1996) and has been shown to work well on many bioinformatics problems (Mall, Cerulo, Bensmail, Iavarone, & Ceccarelli, Citation2017; Mall, Cerulo, et al., Citation2018; Mall, Ullah, Kunji, Ceccarelli, & Bensmail, Citation2018). We investigated the ratios to distinguish the oligomers from fibril samples and plotted the variables (). We also plotted the decision trees () and it showed that when the output prediction for a leaf node is 1, it means that all the samples which satisfy this particular condition based on the feature value (e.g. antiparallel β-sheet/parallel β-sheet < 0.056), will be predicted as case samples (amyloid fibrils). Similarly, if the prediction value is 0, it means that all samples reaching this leaf node are control. If the predicted value is less than 0.5, it means that these are controls, while if the value is greater than 0.5, then it means it is a case sample. We further displayed the difference between the ratios of antiparallel β-sheet to parallel β-sheet in oligomers versus fibrils ().
Discussions
NanoIR spectroscopic technique provides chemical mapping whereby the nanoIR spectra represent the protein biochemical makeup(Dazzi et al., Citation2012; Müller et al., Citation2014 ). The technique enabled the acquisition of distinct spectra from each protein at a very high spatial resolution. This advantage makes the technique valuable in comparison to the conventional infrared techniques, which averages the structural and biochemical information over the sample( Barth, Citation2007; Dazzi & Prater, Citation2017; Dazzi et al., Citation2012 ). Morphological, nanomechanical and IR analyses of homogenous and pure lysozyme samples, which were incubated in tightly controlled conditions at high resolution, were determined. The morphology of the protein samples at day 1 and 21 was characterized in relation to their height, width and topography. In addition, the nanomechanical properties, such as stiffness and Young’s modulus values of the protein samples, were quantitatively determined.
Our results displayed four key criteria for lysozyme fibrils. The first feature was IR spectra by two maxima at ≈ 1610–1630 cm−1, which are characteristic for parallel β-sheet conformation and almost no absorption at ≈1680 cm−1 which would represent antiparallel β-sheet structure(Roeters et al., Citation2017; Ruysschaert & Raussens, Citation2018). The second feature was the intensity ratio at 1695 cm−1 and 1630 cm−1, which was 0.00860, (≤ 0.25), indicating that parallel β-sheet structure plays a primary role in the formation of the fibrils. These results were also supported by the machine learning model (RF model), which indicated that if the ratio of antiparallel β-sheet/parallel β-sheet < 0.056, then the protein will be in fibrillar form. The second derivative of the amide I spectra for the protein at day 21 showed that the β-sheet absorption was at ≈ 1610–1630 cm−1, which can be attributed to longer β-strands formation as well as more planar sheet formation of the fibrils(Ruysschaert & Raussens, Citation2018). Our results are in good agreement with Ruysschaert and Raussens(Ruysschaert & Raussens, Citation2018) where they reported major differences between the different aggregates of the amyloid protein by attenuated total reflection FTIR (ATR-FTIR) and primarily associates with their secondary structure (antiparallel β-sheet is characteristic for oligomers and parallel β-sheet is characteristic for fibrils). Their results indicated that there was a severe reduction in the antiparallel β-sheet content at ≈1695 cm−1 and the 1695/1630 intensity ratio was ≤0.05, which indicates that the β-sheet content was mainly parallel β-sheet structure. The secondary structure quantification, based on amide I spectra, reveals the shifting of monomeric to the fibrillar structure, accompanied by the change from α-helical dominated species to mainly parallel β-sheet species.
The monomeric lysozyme contains four α-helical structures and mainly anti-parallel β-sheet (Vaney, Maignan, Riès-Kautt, & Ducruix, Citation1996). During the fibrillation of lysozyme, an increase in β-sheet content occurs gradually, as highlighted by CD as well as IR studies. The increase in β-sheet content is consistent with previous results on lysozyme by other groups (Chaari, Fahy, Chevillot-Biraud, & Rholam, Citation2015; Frare et al., Citation2009; Malisauskas et al., Citation2003) and indicates the common feature during amyloid fibrillation.
The IR and AFM results indicated that an increase in parallel β-sheet contents is the main factor affecting the protein fibrils(Makky, Bousset, Polesel-Maris, & Melki, Citation2016; Ruggeri et al., Citation2016). Moreover, our results strongly suggest that oligomerization and/or aggregation is mainly associated with the formation of β-sheet. It also indicates that increasing the parallel β-sheet will increase the protein stiffness and stabilize the protein structure. In our observation, the appearance of parallel β-sheets correlated with the presence of fibrils which were also observed in studies of α-synuclein oligomer and fibril production(Celej et al., Citation2012; Cerf et al., Citation2009). The transition from helical to β-sheet leads to the formation of amyloid fibrils where the majority of them adopt parallel β-sheet conformation, which distinguishes them from oligomer forms having antiparallel along with parallel conformation(Lashuel, Overk, Oueslati, & Masliah, Citation2013). The day 1 lysozyme, containing a parallel β-sheet structure along with antiparallel β-sheet conformation, transitions to day 21 having only parallel β-sheet conformation, which highlights its fibrillar conformation.
The major finding observed is that the fibrils of day 21 have mainly parallel β-sheet while oligomers of day 1 have both parallel and anti-parallel β-sheet. We were able to distinguish variant conformational forms using a relatively novel technique (nanoIR) for mechanical characterization of early-stage and late stage amyloid aggregation of lysozyme. The correlation between the structural transformation and protein stiffness was significant. The amide I band absorption changes from one peak to two peaks during fibrillation processs indicating the formation of fibrils, although a systematic study is needed to probe this transformation during fibrillation process.
NanoIR allowed us to distinguish the spectra of lysozyme fibrils at various stages of fibrillation. NanoIR technique can be used to investigate and characterize the amyloidogenic structures, giving complementary biologically relevant information. This technique provides detailed insights at better resolution with distinct spectral features and can complement other biophysical techniques to better understand the amyloid structures. Fibrillation characterization, which contains various species, is central to understanding how proteins misfold and aggregate for better amyloidosis therapy.
Supplemental Material
Download PDF (563.8 KB)Supplemental Material
Download MS Word (697.2 KB)Acknowledgements
P. R. K and Z. I. were supported by Qatar Biomedical Research Institute under the award IGP2 (2014-004). The publication of this article was funded by the Qatar National Library.
Disclosure statement
No potential conflict of interest was reported by the author(s).
Related Research Data
References
- Antosova, A., Chelli, B., Bystrenova, E., Siposova, K., Valle, F., Imrich, J., … Gazova, Z. (2011). Structure-activity relationship of acridine derivatives to amyloid aggregation of lysozyme. Biochimica et Biophysica Acta (Bba)—General Subjects, 1810(4), 465–474. doi:10.1016/j.bbagen.2011.01.007
- Baldassarre, M., Li, C., Eremina, N., Goormaghtigh, E., & Barth, A. (2015). Simultaneous fitting of absorption spectra and their second derivatives for an improved analysis of protein infrared spectra. Molecules, 20(7), 12599–12622. doi:10.3390/molecules200712599
- Barth, A. (2007). Infrared spectroscopy of proteins. Biochimica et Biophysica Acta - Bioenergetics, 1767(9), 1073–101. doi:10.1016/j.bbabio.2007.06.004.
- Breiman, L. (1996). Bagging predictions. Machine Learning, 24(2), 123–140. doi:10.1023/A:1018054314350
- Breiman, L. (2001). Random Forrests. Machine Learning, 45(1), 5–32. doi:10.1023/A:1010933404324
- Bucciantini, M., Giannoni, E., Chiti, F., Baroni, F., Formigli, L., Zurdo, J., … Stefani, M. (2002). Inherent toxicity of aggregates implies a common mechanism for protein misfolding diseases. Nature, 416(6880), 507–511. doi:10.1038/416507a
- Campioni, S., Mannini, B., Zampagni, M., Pensalfini, A., Parrini, C., Evangelisti, E., … Chiti, F. (2010). A causative link between the structure of aberrant protein oligomers and their toxicity. Nature Chemical Biology, 6(2), 140–147. doi:10.1038/nchembio.283
- Celej, M. S., Sarroukh, R., Goormaghtigh, E., Fidelio, G. D., Ruysschaert, J.-M., & Raussens, V. (2012). Toxic prefibrillar α-synuclein amyloid oligomers adopt a distinctive antiparallel β-sheet structure. Biochemical Journal, 443(3), 719–726. doi:10.1042/BJ20111924
- Cerf, E., Sarroukh, R., Tamamizu-Kato, S., Breydo, L., Derclaye, S., Dufrêne, Y. F., … Raussens, V. (2009). Antiparallel β-sheet: A signature structure of the oligomeric amyloid β-peptide. Biochemical Journal, 421(3), 415–423. doi:10.1042/BJ20090379
- Chaari, A., Fahy, C., Chevillot-Biraud, A., & Rholam, M. (2015). Insights into kinetics of agitation-induced aggregation of hen lysozyme under heat and acidic conditions from various spectroscopic methods. PLoS One, 10(11), e0142095. doi:10.1371/journal.pone.0142095
- Chiti, F., & Dobson, C. M. (2006). Protein Misfolding, Functional Amyloid, and Human Disease. Annual Review of Biochemistry, 75(1), 333–366. doi:10.1146/annurev.biochem.75.101304.123901
- Dazzi, A., & Prater, C. B. (2017). AFM-IR: Technology and applications in nanoscale infrared spectroscopy and chemical imaging. Chemical Reviews, 117(7), 5146–5173. doi:10.1021/acs.chemrev.6b00448
- Dazzi, A., Prater, C. B., Hu, Q., Chase, D. B., Rabolt, J. F., & Marcott, C. (2012). AFM-IR: Combining atomic force microscopy and infrared spectroscopy for nanoscale chemical characterization. Applied Spectroscopy, 66(12), 1365–1384. doi:10.1366/12-06804
- Dazzi, A., Prazeres, R., Glotin, F., & Ortega, J. M. (2005). Local infrared microspectroscopy with subwavelength spatial resolution with an atomic force microscope tip used as a photothermal sensor. Optics Letters, 30(18), 2388. doi:10.1364/OL.30.002388
- Dobson, C. M. (2001). Protein folding and its links with human disease. Philosophical Transactions of the Royal Society of London. Series B: Biological Sciences, 356 (1406), 133–145. doi:10.1098/rstb.2000.0758
- Dumoulin, M., Kumita, J. R., & Dobson, C. M. (2006). Normal and aberrant biological self-assembly: Insights from studies of human lyspzyme and its amyloidogenic variants. Accounts of Chemical Research, 39(9), 603–610. doi:10.1021/ar050070g
- Dupas, E., Gremaud, G., Kulik, A., & Loubet, J. L. (2001). High-frequency mechanical spectroscopy with an atomic force microscope. Review of Scientific Instruments, 72(10), 3891–3897. doi:10.1063/1.1403009
- Dutta, M. S., & Basu, S. (2020). Identifying the key residues instrumental in imparting stability to amyloid beta protofibrils–a comparative study using MD simulations of 17–42 residues. Journal of Biomolecular Structure and Dynamics, 1–26. doi:10.1080/07391102.2019.1711192.
- Fatima, M. T., Islam, Z., Ahmad, E., & Salahuddin, P. (2017). Emerging targets and latest proteomics based therapeutic approaches in neurodegenerative diseases. Current Protein & Peptide Science, 19(9), 858–875. doi:10.2174/1389203718666170731114757
- Frare, E., Mossuto, M. F., de Laureto, P. P., Tolin, S., Menzer, L., Dumoulin, M., … Fontana, A. (2009). Characterization of oligomeric species on the aggregation pathway of human lysozyme. Journal of Molecular Biology, 387(1), 17–27. doi:10.1016/j.jmb.2009.01.049
- Furkan, M., Siddiqi, M. K., Zakariya, S. M., Khan, F. I., Hassan, M. I., & Khan, R. H. (2019). In Vitro elucidation of the antiaggregatory potential of diosminover thermally induced unfolding of hen egg white lysozyme; a preventive quest for lysozyme amyloidosis. International Journal of Biological Macromolecules., 129, 1015–1023. doi:10.1016/j.ijbiomac.2019.02.107
- Gazova, Z., Siposova, K., Kurin, E., Mučaji, P., & Nagy, M. (2013). Amyloid aggregation of lysozyme: The synergy study of red wine polyphenols. Proteins: Structure, Function, and Bioinformatics, 81(6), 994–1004. doi:10.1002/prot.24250
- Ghorbani, M., Soleymani, H., Allahverdi, A., Shojaeilangari, S., & Naderi-Manesh, H. (2019). Effects of natural compounds on conformational properties and hairpin formation of amyloid-β42 monomer: Docking and molecular dynamics simulation study. Journal of Biomolecular Structure and Dynamics, 1–13. doi:10.1080/07391102.2019.1664934
- Goda, S., Takano, K., Yutani, K., Yamagata, Y., Nagata, R., Akutsu, H., … Namba, K. (2000). Amyloid protofilament formation of hen egg lysozyme in highly concentrated ethanol solution. Protein Science, 9(2), 369–375. doi:10.1110/ps.9.2.369
- Grasso, G., Leanza, L., Morbiducci, U., Danani, A., & Deriu, M. A. (2019). Aminoacid substitutions in the glycine zipper affect the conformational stability of amyloid beta fibrils. Journal of Biomolecular Structure and Dynamics, 1–8. doi:10.1080/07391102.2019.1671224
- Harte, N. P., Klyubin, I., McCarthy, E. K., Min, S., Garrahy, S. A., Xie, Y., … Mok, K. H. (2015). Amyloid oligomers and mature fibrils prepared from an innocuous protein cause diverging cellular death mechanisms. Journal of Biological Chemistry, 290(47), 28343–28352. doi:10.1074/jbc.M115.676072
- Kar, R. K., Gazova, Z., Bednarikova, Z., Mroue, K. H., Ghosh, A., Zhang, R., … Bhunia, A. (2016). Evidence for Inhibition of Lysozyme Amyloid Fibrillization by Peptide Fragments from Human Lysozyme: A Combined Spectroscopy, Microscopy, and Docking Study. Biomacromolecules, 17(6), 1998–2009. doi:10.1021/acs.biomac.6b00165
- Kelly, J. W. (1998). The alternative conformations of amyloidogenic proteins and their multi-step assembly pathways. Current Opinion in Structural Biology, 8(1), 101–106. doi:10.1016/S0959-440X(98)80016-X
- Krebs, M. R. H., Wilkins, D. K., Chung, E. W., Pitkeathly, M. C., Chamberlain, A. K., Zurdo, J., … Dobson, C. M. (2000). Formation and seeding of amyloid fibrils from wild-type hen lysozyme and a peptide fragment from the β-domain. Journal of Molecular Biology, 300(3), 541–549. doi:10.1006/jmbi.2000.3862
- Lansbury, P. T., & Lashuel, H. A. (2006). A century-old debate on protein aggregation and neurodegeneration enters the clinic. Nature, 443(7113), 774–779. doi:10.1038/nature05290
- Lashuel, H. A., Overk, C. R., Oueslati, A., & Masliah, E. (2013). The many faces of α-synuclein: From structure and toxicity to therapeutic target. Nature Reviews Neuroscience, 14(1), 38–48. doi:10.1038/nrn3406
- Liu, F., Ma, Z., Sang, J., & Lu, F. (2019). Edaravone inhibits the conformational transition of amyloid-β42: Insights from molecular dynamics simulations. Journal of Biomolecular Structure and Dynamics, 1–12. doi:10.1080/07391102.2019.1632225
- Makky, A., Bousset, L., Polesel-Maris, J., & Melki, R. (2016). Nanomechanical properties of distinct fibrillar polymorphs of the protein α-synuclein. Scientific Reports, 6(1), 37970. doi:10.1038/srep37970
- Malisauskas, M., Zamotin, V., Jass, J., Noppe, W., Dobson, C. M., & Morozova-Roche, L. A. (2003). Amyloid protofilaments from the calcium-binding protein equine lysozyme: Formation of ring and linear structures depends on pH and metal ion concentration. Journal of Molecular Biology, 330(4), 879–890. doi:10.1016/S0022-2836(03)00551-5
- Mall, R., Cerulo, L., Bensmail, H., Iavarone, A., & Ceccarelli, M. (2017). Detection of statistically significant network changes in complex biological networks. BMC Systems Biology, 11(1), 32. doi:10.1186/s12918-017-0412-6
- Mall, R., Cerulo, L., Garofano, L., Frattini, V., Kunji, K., Bensmail, H., … Ceccarelli, M. (2018). RGBM: Regularized gradient boosting machines for identification of the transcriptional regulators of discrete glioma subtypes. Nucleic Acids Research, 46(7), e39–e39. doi:10.1093/nar/gky015
- Mall, R., Ullah, E., Kunji, K., Ceccarelli, M., & Bensmail, H. (2018). An unsupervised disease module identification technique in biological networks using novel quality metric based on connectivity, conductance and modularity. F1000Research, 7, 378. doi:10.12688/f1000research.14258.1
- Masino, L., Nicastro, G., De Simone, A., Calder, L., Molloy, J., & Pastore, A. (2011). The Josephin domain determines the morphological and mechanical properties of ataxin-3 fibrils. Biophysical Journal, 100(8), 2033–2042. doi:10.1016/j.bpj.2011.02.056
- Meyer-Luehmann, M., Spires-Jones, T. L., Prada, C., Garcia-Alloza, M., de Calignon, A., Rozkalne, A., … Hyman, B. T. (2008). Rapid appearance and local toxicity of amyloid-β plaques in a mouse model of Alzheimer’s disease. Nature, 451(7179), 720–724. doi:10.1038/nature06616
- Müller, T., Ruggeri, F. S., Kulik, A. J., Shimanovich, U., Mason, T. O., Knowles, T. P. J., & Dietler, G. (2014). Nanoscale spatially resolved infrared spectra from single microdroplets. Lab Chip, 14(7), 1315–1319. doi:10.1039/C3LC51219C
- Narang, S. S., Goyal, D., & Goyal, B. (2019). Inhibition of Alzheimer’s amyloid-β42 peptide aggregation by a bi-functional bis-tryptoline triazole: Key insights from molecular dynamics simulations. Journal of Biomolecular Structure and Dynamics, 1–14. doi:10.1080/07391102.2019.1614093
- Pepys, M. B. (2006). Amyloidosis. Annual Review of Medicine, 57(1), 223–241. doi:10.1146/annurev.med.57.121304.131243
- Pepys, M. B., Hawkins, P. N., Booth, D. R., Vigushin, D. M., Tennent, G. A., Soutar, A. K., … Hsuan, J. J. (1993). Human lysozyme gene mutations cause hereditary systemic amyloidosis. Nature, 362(6420), 553–557. doi:10.1038/362553a0
- Roeters, S. J., Iyer, A., Pletikapić, G., Kogan, V., Subramaniam, V., & Woutersen, S. (2017). Evidence for intramolecular antiparallel beta-sheet structure in alpha-synuclein fibrils from a combination of two-dimensional infrared spectroscopy and atomic force microscopy. Scientific Reports, 7(1), 41051. doi:10.1038/srep41051
- Ruggeri, F. S., Longo, G., Faggiano, S., Lipiec, E., Pastore, A., & Dietler, G. (2015). Infrared nanospectroscopy characterization of oligomeric and fibrillar aggregates during amyloid formation. Nature Communications, 6(1), 7831. doi:10.1038/ncomms8831
- Ruggeri, F. S., Vieweg, S., Cendrowska, U., Longo, G., Chiki, A., Lashuel, H. A., & Dietler, G. (2016). Nanoscale studies link amyloid maturity with polyglutamine diseases onset. Scientific Reports, 6(1), 31155. doi:10.1038/srep31155
- Ruysschaert, J. M., & Raussens, V. (2018). ATR-FTIR analysis of amyloid proteins. Methods in Molecular Biology (Clifton, N.J.) , 1777, 69–81. (Vol. doi:10.1007/978-1-4939-7811-3_3
- Shuaib, S., Saini, R. K., Goyal, D., & Goyal, B. (2020). Impact of K16A and K28A mutation on the structure and dynamics of amyloid-β 42 peptide in Alzheimer’s disease: Key insights from molecular dynamics simulations. Journal of Biomolecular Structure and Dynamics, 38(3), 708–721. doi:10.1080/07391102.2019.1586587
- Sreerama, N., & Woody, R. W. (1993). A self-consistent method for the analysis of protein secondary structure from circular dichroism. Analytical Biochemistry, 209(1), 32–44. doi:10.1006/abio.1993.1079
- Stefani, M. (2004). Protein misfolding and aggregation: New examples in medicine and biology of the dark side of the protein world. Biochimica et Biophysica Acta - Molecular Basis of Disease, 1739(1), 5-25. doi:1016/j.bbadis.2004.08.004.
- Sunde, M., & Blake, C. (1997). The structure of amyloid fibrils by electron microscopy and X-ray diffraction. In Advances in protein chemistry volume, 50, 123–159. 10.1016/S0065-3233(08)60320-4.
- Sunde, M., Serpell, L. C., Bartlam, M., Fraser, P. E., Pepys, M. B., & Blake, C. C. F. (1997). Common core structure of amyloid fibrils by synchrotron X-ray diffraction. Journal of Molecular Biology, 273(3), 729–739. doi:10.1006/jmbi.1997.1348
- Swaminathan, R., Ravi, V. K., Kumar, S., Kumar, M. V. S., & Chandra, N. (2011). Lysozyme: A model protein for amyloid research. Advances in Protein Chemistry and Structural Biology, 84, 63–111. doi:10.1016/B978-0-12-386483-3.00003-3.
- Turner, M., Mutter, S. T., & Platts, J. A. (2019). Molecular dynamics simulation on the effect of transition metal binding to the N-terminal fragment of amyloid-β. Journal of Biomolecular Structure and Dynamics, 37(17), 4590–4600. doi:10.1080/07391102.2018.1555490
- Vaney, M. C., Maignan, S., Riès-Kautt, M., & Ducruix, A. (1996). High-resolution structure (1.33 Å) of a HEW lysozyme tetragonal crystal grown in the APCF apparatus. Data and structural comparison with a crystal grown under microgravity from spaceHab-01 mission. Acta Crystallographica Section D Biological Crystallography, 52(3), 505–517. doi:10.1107/S090744499501674X
- Vuong, Q. V., Siposova, K., Nguyen, T. T., Antosova, A., Balogova, L., Drajna, L., … Gazova, Z. (2013). Binding of glyco-acridine derivatives to lysozyme leads to inhibition of amyloid fibrillization. Biomacromolecules, 14(4), 1035–1043. doi:10.1021/bm301891q
- Xue, W. F., Hellewell, A. L., Gosal, W. S., Homans, S. W., Hewitt, E. W., & Radford, S. E. (2009). Fibril fragmentation enhances amyloid cytotoxicity. Journal of Biological Chemistry, 284(49), 34272–34282. doi:10.1074/jbc.M109.049809