
 ?Mathematical formulae have been encoded as MathML and are displayed in this HTML version using MathJax in order to improve their display. Uncheck the box to turn MathJax off. This feature requires Javascript. Click on a formula to zoom.
Abstract
Fentanyl is a potent opioid analgesic, which for decades has been used routinely in surgical and therapeutic applications. In addition to its analgesic properties, fentanyl also possesses anesthetic properties, which are not well understood. Fentanyl is used in the general anesthesia process to induce and maintain anesthesia in combination with the general anesthetic propofol, which fentanyl is known to potentiate. As the atomic-level mechanism behind the potentiation of propofol is unclear, we have used classical molecular dynamics simulations to study the interactions of these drugs with the Gloeobacter violaceus ion channel (GLIC). This ion channel has been identified as a target for many anesthetic drugs. We identified multiple binding sites using flooding style and Gaussian accelerated molecular dynamics (GaMD) simulations, showing fentanyl acting as a stabiliser that holds propofol within binding sites. Our extensive GaMD simulations were also able to show the pathway by which propofol blocks the channel pore, which has previously been suggested as a mechanism for ion channel modulation. General anesthesia is a multi-drug process and this study provides the first insight into the interactions between two different drugs in the anesthesia process in a relevant biological environment.
Communicated by Ramaswamy H. Sarma
1. Introduction
The phenomenon of general anesthesia is a medically induced loss of consciousness which renders the patient immobile and non-responsive to painful stimulus, thereby allowing invasive surgical procedures to be performed under the safest possible conditions. The discovery of molecules which possess properties that induce anesthesia has caused significant advances within the field of medicine, but to date a lack of understanding remains of the molecular mechanisms which lead to general anesthesia. Early investigations into the mechanisms of anesthesia were carried out by Meyer (Meyer, Citation1899) and Overton (Overton, Citation1901) who proposed a lipid-mediated mechanism due to the correlation between the solubility of anesthetic molecules in oil and their potency. Consequently, studies have been performed on a large range of anesthetic molecules in different solvent environments, (Johansson & Zou, Citation1999; Taheri et al., Citation1991) which have followed the hypothesis laid down by Meyer and Overton, but several exceptions have been identified. (Cardoso et al., Citation1999; Fang et al., Citation1997; Koblin et al., Citation1995, Citation1994; North & Cafiso, Citation1997) Several studies have proposed that anesthetics cause alteration of specific membrane properties, such as the lateral pressure profile, which will affect membrane proteins whose function depends on a transition between conformational states that is accompanied by a depth-dependent change in cross sectional area. (Cantor, Citation1999; van den Brink-van der Laan et al., Citation2004) The specific locations adopted by anesthetics within the cellular membrane have also been investigated by Pohorille et al., who proposed that anesthetics reside at the lipid-water interface. (Pohorille et al., Citation1998) Although there is a wealth of published work examining the role of the lipid membrane, the main theory which has attracted the most attention in recent years is the direct binding of anesthetics to pentameric ligand-gated ion channels (pLGICs) or cys-loop receptors. pLGICs are of vital importance to life as they are responsible for converting synaptic chemical signals into electrical impulses within the peripheral and central nervous systems (Corringer et al., Citation2012) and as such they are targets for general anesthetics. (Campagna et al., Citation2003; Hemmings et al., Citation2005) Prokaryotic homologues of pLGICs have provided high-resolution crystal structures such as those from Gloeobacter violaceus (GLIC). (Bocquet et al., Citation2009; Hilf & Dutzler, Citation2009) Crystal structures of GLIC have also been identified that show binding of various general anesthetics, including ethanol, (Sauguet et al., Citation2013) ketamine, (Pan et al., Citation2012) desflurane, (Nury et al., Citation2011) and propofol, (Fourati et al., Citation2018; Nury et al., Citation2011) to the extracellular and transmembrane domains of the protein structure. These discoveries have provided the strongest evidence thus far that anesthetics exert their main function by modulating the activity of these ion channels.
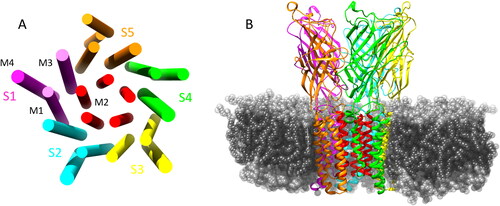
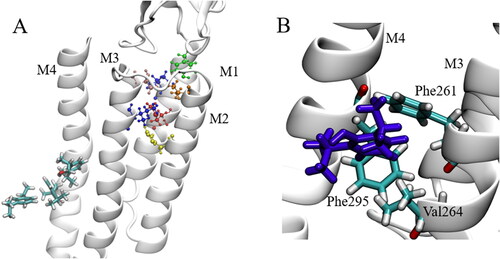
The Gloeobacter violaceus ion channel is a pentameric ligand-gated ion channel which is composed of five identical subunits (S1 - S5) forming a homopentameric ion channel, where each subunit possesses an extracellular domain (ECD) and a transmembrane domain (TMD). The TMD of each subunit consists of four α-helices (M1 - M4) which span the entirety of the phospholipid membrane in which the GLIC is inserted. The M2 α-helices are orientated towards the center of the pore which forms the ion-conducting channel. This is illustrated in . Propofol is an intravenous general anesthetic, which is widely used to induce and maintain general anesthesia, often in combination with the opioid analgesic fentanyl, (Bajwa et al., Citation2010; Bell et al., Citation1994; Todd et al., Citation1993) as it facilitates rapid and safe anesthesia with stable hemodynamics and relatively few negative side effects. The role of fentanyl is to provide the analgesic component to the general anesthesia process, although fentanyl does possess anesthetic properties itself and has been used as the main component in general anesthesia. (Sebel et al., Citation1981; Stanley & Webster, Citation1978) Fentanyl has also been shown to potentiate the anesthetic effect of propofol, (Vuyk, Citation1997; Lichtenbelt et al., Citation2004; Smith et al., Citation1994) but knowledge of the specific interactions between propofol and fentanyl at the molecular level is lacking. Understanding the interactions between these drugs at their site of action, however, could lead to further development of safer and more efficient anesthetic drugs which will reduce the risk of anesthesia-related complications and help uncover the mechanisms behind this phenomenon.
Figure 1. (A) Graphical representation of the transmembrane α helical domains showing the 5 symmetric subunits and the ion conducting M2 helices (red). (B) GLIC structure in the membrane environment, some lipids removed for clarity of TMD.
In this paper we utilise two enhanced sampling molecular dynamics (MD) simulation techniques, namely conformational flooding and Gaussian accelerated molecular dynamics (GaMD), to probe the interactions between fentanyl and propofol at the GLIC channel. GLIC was chosen for study as several structures have been published that show propofol binding, (Fourati et al., Citation2018; Nury et al., Citation2011) and we propose that fentanyl could also act in this channel in combination with propofol. To the best of our knowledge, no MD simulations have been performed on this combination of drug molecules with GLIC. From our simulations we were able to identify multiple sites in GLIC where both drug molecules appear to act and alter the protein mobility and flexibility.
2. Materials and methods
2.1. System preparation and MD simulations
All systems prepared for the MD simulations were based on the high-resolution open-state crystal structure (PDB: 4HFI) of GLIC. (Sauguet et al., Citation2013) The structure was embedded in a DOPC lipid bilayer and fully hydrated with TIP3P (Jorgensen et al., Citation1983) water using the CHARMM-GUI web server (Jo et al., Citation2008; Wu et al., Citation2014) and data from the orientation of proteins in membranes (OPM) database. (Lomize et al., Citation2012) DOPC was chosen as it was used previously by the publishers of the crystal structure. (Sauguet et al., Citation2013) Each system has the approximate dimensions of 128 × 130 x 180 Å where the z-axis is normal to the bilayer, and contains 1 GLIC, 307 DOPC lipids, and ∼54,000 water molecules. Sodium and chloride ions were added to give a 150 mM salt concentration. 50 propofol and 10 fentanyl were added to the aqueous solution for the flooding and GaMD simulations. Each system contained ∼230,000 atoms.
Protonation states of the ionisable residues of the protein were assigned based on the calculations performed by Bocquet et al. (Bocquet et al., Citation2009) Parameters and atomic point charges for each drug molecule were assigned using the antechamber program which is freely available with AmberTools program, and is compatible with the General Amber ForceField (GAFF) (Wang et al., Citation2004) for small organic molecules.
All MD simulations were performed using the CUDA enabled Amber16 (Case et al., Citation2016) molecular dynamics package. The ff14SB forcefield (Maier et al., Citation2015) was used for the protein, solvent and ions, the lipid14 forcefield (Dickson et al., Citation2014) was used for the lipids and the GAFF2 forcefield (Wang et al., Citation2004) was used for the drug molecules. The systems were energy minimised for 20,000 steps (10,000 steepest descent then 10,000 conjugate gradient). Heating was conducted in two stages, where stage 1 involved heating the system to 100 K in the NVT ensemble with the protein, lipids and drug molecules restrained with a force constant of 10.0 kcal/mol Å2. Stage 2 involved heating the system slowly to 303 K in the NPT ensemble, again with the protein, lipids and drugs restrained with a force constant of 10.0 kcal/mol Å2. Equilibration was performed initially with multiple 2 ns simulations where the lipid restraints were gradually reduced from 10 to 0 kcal/mol Å2 over 22 ns. This procedure was then repeated while reducing restraints on the protein backbone totalling another 22 ns (44 ns in total). The unrestrained conformational sampling simulations were run for 1 μs and the GaMD simulations were run for 500 ns. 3 repeats for each method were carried out. One simulation was carried out on the pure GLIC structure as a control to determine if the system was constructed correctly, which was run for 500 ns. All simulations were carried out at a constant pressure of 1.0 atm, which was maintained using the anisotropic Berendsen method with a pressure relaxation time of 1.0 ps. The temperature was maintained at 303 K using the Langevin thermostat with a collision frequency of γ = 1.0 ps– 1. Three-dimensional periodic boundary conditions with the usual minimum image convention were used. The SHAKE algorithm was employed to constrain covalent bonds to hydrogen, allowing the use of a 2 fs time step. Electrostatic interactions were treated with the PME method using a cutoff of 10 Å. Data analysis was carried out using VMD, (Humphrey et al., Citation1996) CPPTRAJ (Roe & Cheatham, Citation2013, Citation2018) and in house scripts. Images were rendered using UCSF Chimera (Pettersen et al., Citation2004) and VMD. (Humphrey et al., Citation1996)
2.2. Flooding simulations
Simulation studies on the GLIC system in the past have mostly focused on the anesthetic binding site from the published crystal structure, (Nury et al., Citation2011) which often involved docking the drug molecule within the observed site. However, this methodology does not take into account the pathway of the drug molecule, or any other binding sites that can be occupied. We have investigated the possibility of these alternative binding sites and pathways by implementing three independent 1 μs flooding simulations in which 50 propofol molecules and 10 fentanyl molecules were added to the solvent phase of the last frame of the pure GLIC control simulation, which was used as the starting structure; this methodology is similar to other studies conducted on different anesthetics. (Arcario et al., Citation2017; Brannigan et al., Citation2010) The drug molecules were added to the system at random initial positions using the gmx insert-molecules tool available with the GROMACS package. (Van Der Spoel et al., Citation2005) Propofol was used in excess in our simulations to mimic the higher concentration of propofol in the general anesthesia process. We note that the ratio of opioid to anesthetic is higher here than would be used in surgery, but the goal of using a higher ratio is to increase the probability of finding a site of opioid-anesthetic interaction during the simulations. The MD flooding approach provides a dynamic, flexible and physical dock which is a significant advantage over traditional docking procedures. (Brannigan et al., Citation2010; Raju et al., Citation2013)
2.3. Gaussian accelerated molecular dynamics
GaMD is an accelerated MD method which allows unconstrained sampling and accurate reconstruction of the free-energy profiles, thereby allowing long timescale events which would normally occur over hundreds of microseconds to milliseconds to be probed in more realistic simulation times. (Miao & McCammon, Citation2017; Palermo et al., Citation2017) A full mathematical description of the methodology can be found in the original publication (Miao et al., Citation2015) and only a brief description will be given here. The enhanced conformational sampling provided by GaMD is obtained by adding a harmonic boost potential which reduces the energy barriers in the system. When the total system potential V() is lower than the reference energy E, the new potential V*(
) of the system is calculated as:
(1)
(1)
(2)
(2)
where k is the harmonic force constant. The two adjustable parameters E and k are automatically determined based on three principles. First, for any two arbitrary potential values V
(
) and V
(
) found on the initial energy surface, if V
(
) < V
(
), ΔV should be a monotonic function which allows the relative order of the biased potential to remain constant. Second, if V
(
) < V
(
), then the potential difference on the flattened energy surface should be smaller than that of the original. By a combination of the first two principles, we obtain:
(3)
(3)
where Vmin and Vmax are the system minimum and maximum potentials. The standard deviation of ΔV has to have a narrow distribution, so accurate re-weighting by cumulant expansion to the second order can be performed:
= k(E - Vavg)
where Vavg and
are the average and standard deviation of the system potential energies.
is the standard deviation of ΔV and
is a user-specified upper limit for accurate re-weighting.
We have carried out extensive tests to obtain suitable parameters for our systems. The system threshold energy was set to E = Vmax for all GaMD simulations. The dual-boost scheme was used, in which an acceleration potential is applied to the torsional terms and to the entire system potential. Vmax, Vmin, Vavg and were obtained from an initial 8 ns NPT simulation without boost potential. Each GaMD simulation then underwent a 40 ns run in which the boost potential was updated every 1.6 ns, thus reaching equilibration values. Production runs were carried out for 500 ns for all three simulations, in which each was started with random particle velocities. The same number of drug molecules as in the flooding simulations were included in the GaMD simulations. Trajectory frames were saved every 1 ps.
3. Results and discussion
3.1. Flooding
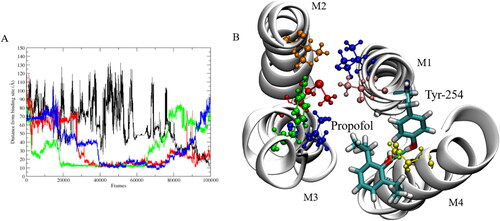
Almost instantly during the production runs, both drug molecules begin to partition into the membrane (), often forming small clusters in which multiple propofol molecules bind to one fentanyl molecule. To assess the structural stability of the GLIC structure within the membrane, the root mean squared deviation (RMSD) of the backbone of the protein was calculated to be less than 3.0 Å over the full length of the simulations and the average RMSD was 1.922 ± 0.209 Å, based on which the simulations were deemed to be stable as the protein remained in its native structure. Multiple binding regions were identified for propofol, where protein residues interacted with the anesthetic for several ns of the simulation. Of these potential interaction sites, only one was observed over multiple subunits for several hundred ns. This interaction site was located in the transmembrane domain (TMD) close to the experimentally identified site, see . The other sites, where shorter interactions were observed, most likely represent non-specific adhesion of propofol to the protein surface rather than a functional binding site. The site where most stability is observed is identical to that observed in a study carried out by Arcario et al., (Arcario et al., Citation2017) in which they observed desflurane binding to GLIC by forming a hydrogen-bond to Tyr-254 during their simulations. The stability associated with propofol at this site () is due to the formation of a hydrogen-bond between the hydrogen of the Tyr-254 hydroxyl group and the oxygen of the propofol hydroxyl group, which was calculated for the propofol interacting at subunit 3. The hydrogen-bond remains dominant over the full time in which the propofol molecule remains stable, which is approximately 400 ns. This stability was shown by calculating the distance between the propofol molecules observed to interact at this site in each subunit, and the center of mass (COM) of the experimental anesthetic binding site, in which propofol has been shown to bind. (Nury et al., Citation2011) The S3 propofol remains bound from ∼ 200 ns to ∼ 650 ns, where the hydrogen-bond to Tyr-254 contributes to propofol’s overall stability here. Three propofol molecules were observed to bind to the same site at the same time, and this asymmetric ligand binding has been shown to play a role in channel function. (Mowrey et al., Citation2013) Our distance calculations have shown that this binding site holds the propofol molecules at ∼ 10 Å from the deeper transmembrane site, indicating a possible transition pathway, although this was not observed to happen in any of our simulations. Throughout the flooding simulations, multiple bound anesthetics were observed at multiple subunits which helps to explain why large amounts of general anesthetic are required to induce the desired clinical effect. This observed behaviour strengthens the argument that these drugs indiscriminately bind to several targets. (Eckenhoff et al., Citation2002; Harrison, Citation2000; Herold & Hemmings, Citation2012)
Figure 2. (A) First and (B) final frame of 1 μs of production simulation. Blue represents fentanyl and red represents propofol.
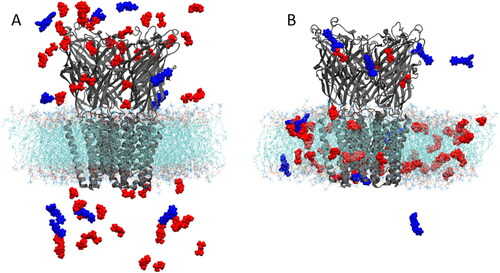
Figure 3. (A) Distance between interacting propofol molecules and COM of experimental binding site. (B) Snapshot showing the binding site in which propofol (licorice representation) interacts with Tyr-254 (licorice representation) and Asn-307 (yellow). The anesthetic binding site residues are shown; Tyr-193 (green), Ile-202 (blue), Met-205 (red), Val-242 (orange), Thr-255 (pink) and Ile-259 (blue). M1-M4 are the transmembrane helices located in each subunit. Hydrogen-bond between propofol and Tyr-254 shown by green dashed line.
An interesting observation made during our flooding simulations was propofol occupying the exact same binding site in the extracellular domain that the general anesthetic ketamine has been shown to occupy. (Pan et al., Citation2012) This site is approximately 10 Å below the orthosteric agonist-binding site in the extracellular domain. Ketamine binding in this site was also shown to modulate the function of the GLIC channel. (Ion et al., Citation2017) Previously identified sites for propofol were located in the upper transmembrane domain within a subunit (Nury et al., Citation2011) which is very different from that identified for ketamine, which is located ∼ 10 Å below the orthosteric agonist-binding site. We observed propofol binding in this extracellular site within the first 100 ns of simulation and it remains in this site for the rest of the 1 μs simulation, totalling ∼ 900 ns of residence time within the site. Propofol remains fairly mobile within the site with a RMSD of 5.0 ± 1.4 Å, which is due to the relatively small molecular volume of propofol (∼ 191 Å3) compared to the ketamine site (∼ 248 Å3) The residues within 4 Å of propofol displayed a RMSD of 1.7 ± 0.5 Å, which shows that the structure in this flexible loop region is fairly resilient to propofol binding. Identification of multiple binding sites presents a compelling case for the allosteric action of molecules which possess anesthetic properties.
3.2. GaMD
Our GaMD simulations were able to capture complete binding of one propofol molecule into the channel pore just above the hydrophobic gate region. Binding was captured within ∼ 50 ns in all three independent GaMD simulations, whereas this binding mode was not observed in any of our 1 μs flooding simulations. We found that propofol diffuses from the bulk solvent to the β-3 loop in the upper extracellular domain of subunit one, before moving to the β-8 loop between subunits one and two in the extracellular domain, and finally into the center of the M2 pore above the Ile-239 gating residues, see . By aligning the C-terminal domain of the GLIC, the RMSD of the diffusing propofol molecule relative to its position in the pore in the last simulation frame reaches a minimum of 1.1 Å. It forms hydrophobic interactions with several residues around the pore opening, see .
Figure 4. GaMD simulations captured pore binding of propofol: (A) 2 D (Ncontact, propofol RMSD) PMF calculated by reweighting the 500 ns GaMD simulation. (B) Pathway of propofol diffusion into the M2 helix pore in all three GaMD simulations. (C) Hydrogen-bonds formed between propofol and the GLIC, where bonds formed after 10000 steps are in the pore. Protein refers to short lived hydrogen-bonds formed on the protein exterior. Data combined from all three replicates. (D) Final frame snapshot showing propofol hydrogen-bonding to Thr-236 in S1.
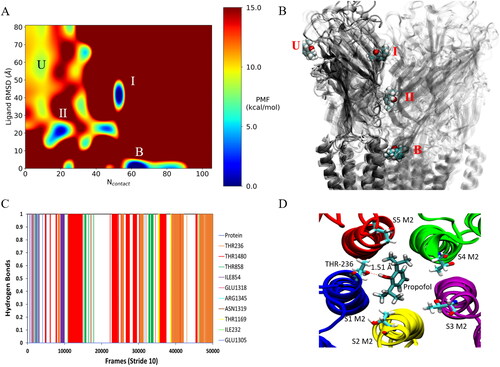
The boost potential applied during the GaMD simulations follows a Gaussian distribution and its distribution anharmonicity γ equals to 1.94 × 10– 2. The average and standard deviation of ΔV are 15.3 kcal/mol and 4.7 kcal/mol, respectively. Such narrow distribution will ensure accurate re-weighting for the free energy calculations using cumulant expansion to the 2nd order. Using the RMSD of propofol relative to the final frame pose and the number of protein heavy atoms that are within 5 Å of propofol (Ncontact), a 2 D potential of mean force (PMF) profile was calculated by re-weighting the three 500 ns GaMD simulations using the PyReweighting toolkit. (Miao et al., Citation2014) As the pore blocking pathway was observed in all three replicates, the data were combined to produce the PMF in . The re-weighted PMF allows us to identify four low-energy states: the unbound (”U”), intermediate 1 (”I”), intermediate 2 (”II”) and bound (”B”) states. The maximum energy was capped at 15 kcal/mol for clarity in identifying relevant states. The unbound state is located in a local energy well centred at ∼(10, 60 Å), the intermediate 1 state is centred at ∼(50, 40 Å), the 2nd intermediate state is centred at ∼(20, 20 Å) and the bound state is located at the global energy minimum ∼(60, 0 Å). We should note here that propofol binding within the M2 helix pore was observed in all three 500 ns GaMD simulations, so we can assume that calculated energies between individual states have a low degree of error due to limited sampling. Propofol forms hydrogen-bonds within the channel pore with residues Thr-236, Thr-1480, Thr-858 and Thr-1169 (). Hydrogen-bonds are also formed along the pathway to the pore with residues Ile-854, Arg-1345, Asn-1319 and Glu-1305.
Anesthetic transmembrane binding site
Most studies conducted on this system focus on the binding site which was observed in the original crystal structure, (Nury et al., Citation2011) for example using docking methods. To assess whether any propofol molecules in our GaMD simulations entered this site, we defined the binding site by the following residues: Tyr-193, Ile-198, Met-201, Val-238, Thr-251 and Ile-255. We used the center of mass (COM) of these binding site residues and computed the distance between this COM, and any propofol molecules which were identified as being close to the subunit by visual inspection in VMD. (Humphrey et al., Citation1996) During the calculations, a step size of 10 was used. shows the distances of the identified propofol molecules to the anesthetic transmembrane binding site. No molecules were identified for S2. shows multiple molecules competing at S1, although we notice that none of the molecules get close to the binding site. Stable regions are located between 10 and 20 Å from the experimentally observed site. We initially suspected that this distance was due to the propofol molecules interacting with each other and forming a small cluster, as was observed in our previous work. (Faulkner et al., Citation2020) Upon further investigation we observe this same distance for subunits S3 and S4 in which only one molecule has stable distances between 10 and 20 Å, which rules out the hypothesise that this is caused by intermolecular interaction. The data shown in were taken from one replicate in which the most interactions were observed. When we investigate the site at which the propofol molecules are stable, we observe a site formed by residues Phe-261, Phe-295 and Val-264 (). These residues block the passage of the propofol molecules into the upper region of the transmembrane domain. The Phe residues form π-π interactions with each other and the propofol molecule, which contributes to the stability observed here. If we are to take the crystal structure binding site as true, we must assume that longer time scales are required to observe binding, or an allosteric mechanism in which another binding site has to be occupied to allow passage of propofol through the Phe-261 Phe-295 site into the crystal binding site, although none of this was observed in 3 μs of cMD and 1.5 μs of GaMD. We should note here that no propofol molecules were observed to enter from the other side of the M4 helix (between M4 and M1). To investigate the dynamical consequences on GLIC induced by the drug molecules, we computed the distance between Asp-32 and Arg-192 which form a salt bridge. It has been suggested that salt bridge perturbation is important for channel functions; this was shown in a nAChR channel, (Xiu et al., Citation2005) and a GLIC where the volatile anesthetic halothane caused disruption of this salt bridge, which led to instability within the channel. (Chen et al., Citation2010) We did observe for multiple subunits, where drug molecules were present, that this salt bridge did not hold.
Figure 5. Calculated distances between the binding site COM and identified propofol molecules. Each line in the graphs represents a propofol molecule.
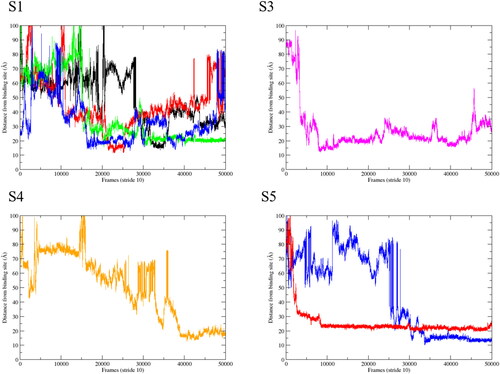
Figure 6. Interaction site of propofol at GLIC subunits: (A) Sites of propofol interaction in relation to the anesthetic binding site in which residues are coloured; Tyr (green), Ile (blue), Met (red), Val (orange), Thr (pink) and His (yellow). Propofol molecules are shown in licorice representation. (B) Blocking residues inhibiting the path to the anesthetic binding site, propofol (violet) shown in licorice representation.
To determine whether fentanyl and propofol share binding sites, we constructed density maps using the VOLMAP VMD plugin. (Humphrey et al., Citation1996) These density maps, shown in , were averaged over the whole simulation trajectories, apart from the first 50 ns which were discarded for system equilibration. Identified regions of high density therefore reflect locations, where drug molecules resided for a prolonged period of time. Density maps were computed for both the cMD flooding simulations and the GaMD simulations, which allowed us to determine if the accelerated simulations were able to discover binding sites which are unattainable from conventional simulations. The main difference that we observed between the classical molecular dynamics flooding simulations and the GaMD simulations is the occupation of the ion channel pore by propofol, which was observed in all 3 GaMD simulations. The pore is occupied by one propofol molecule which resides above the hydrophobic gating Ile-239 residues that form the top of the hydrophobic gate in GLIC (Zhu & Hummer, Citation2010). The molecule is mobile within the pore with a RMSD of 6.06 ± 0.76 Å. This propofol molecule blocks the majority of the pore, which disrupts the flow of water molecules through the pore. As stated, the pore-blocking molecule is mobile within the pore, where it mostly forms hydrogen-bonds with the threonine residues located at the top of the M2 helices. Hydrogen-bonding calculations show that these residues form the majority of the hydrogen-bonding interactions within the pore (). Only one propofol molecule was found to block the pore in each GaMD simulation. The general anesthetic isoflurane has been shown to block the pore of GLIC and nAChR as a dimer, (Brannigan et al., Citation2010) but this behaviour was not observed for propofol in any of our simulations, most likely due to the larger size of propofol compared to isoflurane. LeBard et al. (LeBard et al., Citation2012) predicted the physical blocking of the pore in GLIC by propofol, which was shown to bind to the pore with high affinity, as calculated from free energy perturbation (FEP) calculations. They predicted that propofol would bind as a dimer in a similar fashion to isoflurane, but we did not observe this in around 5 μs of conventional and Gaussian accelerated MD simulations. A structure of propofol bound to the pore of GLIC has not been resolved experimentally, most likely due to the binding of detergents (dodecylmaltoside, DDM) within the pore. (Bocquet et al., Citation2009; LeBard et al., Citation2012)
Figure 7. Regions of prolonged occupation by propofol (red) and fentanyl (blue) in the GLIC. (A and B) represent the TM and EC domains of the GLIC, respectively, from the GaMD simulations. (C and D) represent the TM and EC domains of the GLIC, respectively, from the cMD flooding simulations.
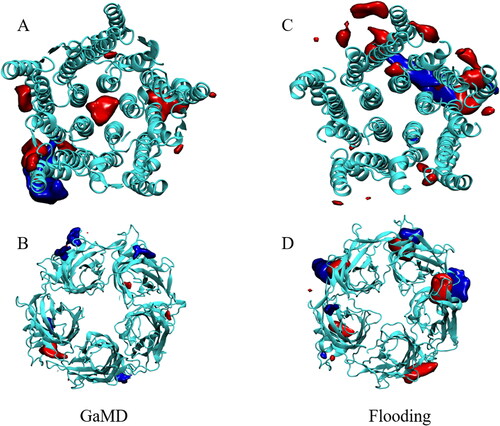
Our GaMD simulations allowed us to identify the pathway by which propofol binds to the channel pore, shows the sites associated with the intermediate states calculated from the reweighted GaMD simulations. The first intermediate state of the propofol binding pathway is located in the β3 loop region at the top of the extracellular domain, where propofol forms short-lived hydrogen-bonds to the glutamic acid residues before moving to the second intermediate state. This second binding state is located between the β1-β2 loop and the β4-β5 loop in the inner region of the extracellular vestibule, where propofol remains for ∼36 ns before diffusing into the M2 helix pore to remain there for the rest of the simulation. Propofol molecules that were observed to bind near the transmembrane intra-subunit anesthetic binding site displayed interesting dynamics within the binding site during the GaMD simulations, where the molecule would” hop” from one intra-subunit site to the adjacent intra-subunit site. Propofol was observed to traverse through a binding tunnel between the M3 helix of one subunit and the M1 helix of the adjacent subunit into an inter-subunit site initially, then into the intra-subunit site (). We also observed multiple occupancy in transmembrane sites where up to three propofol molecules occupied an intra-subunit site. This multiple occupancy was initiated by small clusters of propofol molecules forming within the lipid bilayer region and then diffusing towards the TMD where they then bind to the TMD helices. Fentanyl was not observed to bind within the channel pore; We have previously shown that fentanyl binds to an inter-subunit site in the extracellular domain, (Faulkner et al., Citation2019) when propofol is not present. In this study we observe sites where fentanyl shares a binding site with propofol, mostly shown in our flooding simulations in the extra-cellular domain (). In the extra-cellular domain we initially observe several propofol molecules interacting with a single fentanyl molecule, before this cluster moves towards the extra-cellular region of the ion channel, where several propofol molecules diffuse away from the fentanyl molecule and the remaining propofol molecule forms a very stable hydrogen-bond with Asp-1418 located on loop C (). This hydrogen-bond remains stable for the majority of the simulations, where the fentanyl molecule remains located beside the propofol molecule, which we believe acts as a stabiliser for the bound propofol which has an RMSD of 2.04 ± 0.4 Å. shows the RMSD values for propofol when bound to Asp-1418, before and after the interaction with fentanyl. We can see that there is a stabilisation effect on propofol when fentanyl is present at the binding site. When we look at the flexibility of loop C, where propofol binds (), we see that the flexibility is almost identical to the pure structure when fentanyl is present. When only propofol binds here, we see that the flexibility of this region increases significantly. This shows that fentanyl not only stabilises the propofol molecule, but also a structurally important section of the GLIC extracellular region. We also analysed the flexibility of the cys-loop () in the pure system and compared it to the systems in which propofol and fentanyl are bound. The cys-loop is thought to be a crucial component in the gating of pLGICs, (Cederholm et al., Citation2009; Nys et al., Citation2013; Schofield et al., Citation2003) and in our analysis we can clearly see the increased mobility of the cys-loop () when the drug molecules are bound. This shows that the combination of these drug molecules could play a role in modulating the channel function. The backbone of the fentanyl molecule remains flexible throughout the simulations, but the N-phenyl-propanamide ring remains at an ∼90° angle to the aromatic ring of propofol, forming a proposed π-π interaction to stabilise the propofol in this site. From the density maps () we can see that there is overlap of the two drugs in the transmembrane domain, as well as in the extracellular domain. Within the TM domain we observe similar interactions as those shown in , where fentanyl forms π-π interactions with propofol and holds it in a specific site. The transmembrane sites where we observe these interactions are located near the bottom of the M2 helices, close to the phospholipid headgroup region. The fentanyl molecules stabilise the propofol molecule in the lower M2 intra-subunit site before diffusing to the next subunit. This behaviour was observed in both the flooding style simulations and the GaMD simulations.
Figure 8. Graphical representations of the intermediate states of propofol (green sticks) calculated from reweighted GaMD simulations. Contact residues shown explicitly in stick representation.
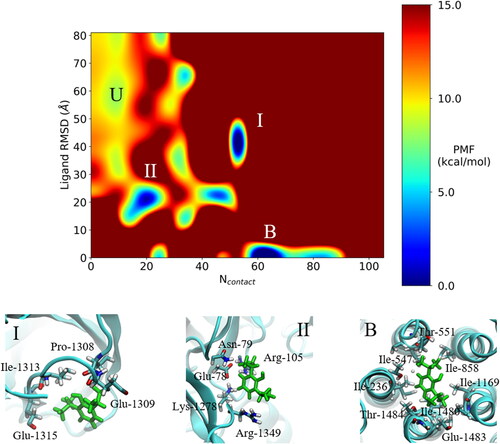
Figure 9. (A) Graphical representation of the propofol subunit hopping pathway in the TMD. (B) RMSD plot showing the change in position of propofol from the initial site (1) to the intermediate, intersubunit site (I) and then to the adjacent intrasubunit site (2). Reference for the RMSD calculation was taken from propofol in site 1. Data shown from one trajectory.
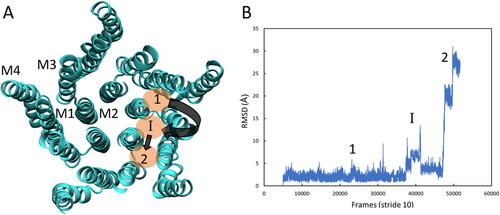
Figure 10. (A) Structure of one subunit highlighting key areas of the protein. (B) Cys-loop RMSD plot for pure and drug-bound systems. (C) π-π interaction of the fentanyl N-phenyl-propanamide ring and the propofol aromatic ring and the hydrogen-bond between propofol and Asp-1418 on loop C.
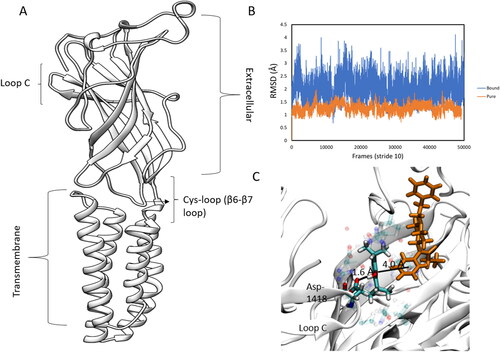
Table 1. RMSD values for propofol binding to Asp-1418 with and without fentanyl, and loop C which Asp-1418 is part of.
4. Conclusions
In this study we have applied flooding style and Gaussian accelerated molecular dynamics simulations to study how the general anesthetic propofol and the opioid analgesic/anesthetic fentanyl interact with the GLIC channel. Our GaMD simulations reveal a detailed pathway for the pore-blocking mechanism by propofol, which has not been observed previously using conventional MD simulation methodologies. The GaMD simulations also showed that propofol is able to hop between transmembrane intra-subunit binding sites by diffusing through a binding tunnel formed by helices of the occupied and adjacent transmembrane subunits. Fentanyl was shown to play an important role in the stabilisation of propofol molecules in several binding sites. Initial interactions between fentanyl and propofol lead to the accumulation of a small number of propofol molecules with a fentanyl molecule. This small cluster either diffuses rapidly into the membrane region where most propofol molecules leave the fentanyl, with one remaining propofol binding to the transmembrane domain of GLIC where fentanyl acts as a stabiliser. The other propofol molecules, diffuse towards the extracellular domain of GLIC, binding close to the orthosteric agonist-binding site, where we again observe ligand stabilisation by fentanyl. The results presented here show the first evidence of the opioid fentanyl interacting with, and altering, propofol binding in GLIC. The structural results of propofol and fentanyl interacting at GLIC present a compelling case for the allosteric action of anesthetics and opioids at pLGICs. We consider that this study, along with our previous work, (Faulkner et al., Citation2019) calls for a comprehensive examination of the role of the opioid in the general anesthesia process.
Acknowledgements
This research was undertaken using the Supercomputing Facilities at Cardiff University operated by ARCCA on behalf of CSF and Supercomputing Wales. This equipment is part-funded by the Welsh European Funding Office (WEFO) as well as by Cardiff University. Information on the data underpinning the results presented here, including how to access them, can be found in the Cardiff University data catalogue at http://doi.org/10.17035/d.2020.0106797733
Disclosure statement
There are no conflicts to declare
Additional information
Funding
References
- Arcario, M. J., Mayne, C. G., & Tajkhorshid, E. (2017). A membrane-embedded pathway delivers general anesthetics to two interacting binding sites in the Gloeobacter violaceus ion channel. The Journal of Biological Chemistry, 292(23), 9480–9492. https://doi.org/https://doi.org/10.1074/jbc.M117.780197
- Bajwa, S. J. S., Bajwa, S. K., & Kaur, J. (2010). Comparison of two drug combinations in total intravenous anesthesia: Propofol-ketamine and propofol-fentanyl. Saudi Journal of Anaesthesia, 4(2), 72–79. https://doi.org/https://doi.org/10.4103/1658-354X.65132
- Bell, J., Sartain, J., Wilkinson, G., & Sherry, K. (1994). Propofol and fentanyl anaesthesia for patients with low cardiac output state undergoing cardiac surgery: Comparison with high-dose fentanyl anaesthesia. British Journal of Anaesthesia, 73(2), 162–166. https://doi.org/https://doi.org/10.1093/bja/73.2.162
- Bocquet, N., Nury, H., Baaden, M., Le Poupon, C., Changeux, J.-P., Delarue, M., & Corringer, P.-J. (2009). X-ray structure of a pentameric ligand-gated ion channel in an apparently open conformation. Nature, 457(7225), 111–114. https://doi.org/https://doi.org/10.1038/nature07462
- Brannigan, G., LeBard, D. N., Hénin, J., Eckenhoff, R. G., & Klein, M. L. (2010). Multiple binding sites for the general anesthetic isoflurane identified in the nicotinic acetylcholine receptor transmembrane domain. Proceedings of the National Academy of Sciences of the United States of America, 107(32), 14122–14127. https://doi.org/https://doi.org/10.1073/pnas.1008534107
- Campagna, J. A., Miller, K. W., & Forman, S. A. (2003). Mechanisms of actions of inhaled anesthetics. The New England Journal of Medicine, 348(21), 2110–2124. https://doi.org/https://doi.org/10.1056/NEJMra021261
- Cantor, R. S. (1999). Lipid composition and the lateral pressure profile in bilayers. Biophysical Journal, 76(5), 2625–2639. https://doi.org/https://doi.org/10.1016/S0006-3495(99)77415-1
- Cantor, R. S. (1999). The influence of membrane lateral pressures on simple geometric models of protein conformational equilibria. Chemistry and Physics of Lipids, 101(1), 45–56. https://doi.org/https://doi.org/10.1016/S0009-3084(99)00054-7
- Cardoso, R. A., Yamakura, T., Brozowski, S. J., Chavez-Noriega, L. E., & Harris, A. R. (1999). Human neuronal nicotinic acetylcholine receptors expressed in Xenopus oocytes predict efficacy of halogenated compounds that disobey the Meyer-Overton rule. Anesthesiology: The Journal of the American Society of Anesthesiologists, 91, 1370–1370.
- Case, D., Betz, R., Cerutti, D., Cheatham, T., Darden, T., & Duke, R. (2016). AMBER16, San Francisco
- Cederholm, J. M., Schofield, P. R., & Lewis, T. M. (2009). Gating mechanisms in Cys-loop receptors. European Biophysics Journal: EBJ, 39(1), 37–49. https://doi.org/https://doi.org/10.1007/s00249-009-0452-y
- Chen, Q., Cheng, M. H., Xu, Y., & Tang, P. (2010). Anesthetic binding in a pentameric ligand-gated ion channel: GLIC. Biophysical Journal, 99(6), 1801–1809. https://doi.org/https://doi.org/10.1016/j.bpj.2010.07.023
- Corringer, P.-J., Poitevin, F., Prevost, M. S., Sauguet, L., Delarue, M., & Changeux, J.-P., (2012). Structure and pharmacology of pentameric receptor channels: From bacteria to brain. Structure (London, England: 1993), 20(6), 941–956. https://doi.org/https://doi.org/10.1016/j.str.2012.05.003
- Dickson, C. J., Madej, B. D., Skjevik, Å. A., Betz, R. M., Teigen, K., Gould, I. R., & Walker, R. C. (2014). Lipid14: The amber lipid force field. Journal of Chemical Theory and Computation, 10(2), 865–879.
- Eckenhoff, M. F., Chan, K., & Eckenhoff, R. G. (2002). Multiple specific binding targets for inhaled anesthetics in the mammalian brain. The Journal of Pharmacology and Experimental Therapeutics, 300(1), 172–179. https://doi.org/https://doi.org/10.1124/jpet.300.1.172
- Fang, Z., Laster, M. J., Ionescu, P., Koblin, D. D., Sonner, J., Eger, E. I., & Halsey, M. J. (1997). Effects of inhaled nonimmobilizer, proconvulsant compounds on desflurane minimum alveolar anesthetic concentration in rats. Anesthesia and Analgesia, 85(5), 1149–1153. https://doi.org/https://doi.org/10.1097/00000539-199711000-00035
- Faulkner, C., Plant, D. F., & de Leeuw, N. H. (2019). Modulation of the Gloeobacter violaceus Ion Channel by Fentanyl: A Molecular Dynamics Study. Biochemistry, 58(48), 4804–4808. https://doi.org/https://doi.org/10.1021/acs.biochem.9b00881
- Faulkner, C., Santos-Carballal, D., Plant, D. F., & de Leeuw, N. H. (2020). Atomistic Molecular Dynamics Simulations of Propofol and Fentanyl in Phosphatidylcholine Lipid Bilayers. ACS Omega, 5(24), 14340–14353. https://doi.org/https://doi.org/10.1021/acsomega.0c00813
- Fourati, Z., Howard, R. J., Heusser, S. A., Hu, H., Ruza, R. R., Sauguet, L., Lindahl, E., & Delarue, M. (2018). Structural basis for a bimodal allosteric mechanism of general anesthetic modulation in pentameric ligand-gated ion channels. Cell Reports, 23(4), 993–1004. https://doi.org/https://doi.org/10.1016/j.celrep.2018.03.108
- Harrison, N. L. (2000). Ion channels take center stage: Twin spotlights on two anesthetic targets. Anesthesiology: The Journal of the American Society of Anesthesiologists, 92, 936–936.
- Hemmings, H. C., Jr, Akabas, M. H., Goldstein, P. A., Trudell, J. R., Orser, B. A., & Harrison, N. L. (2005). Emerging molecular mechanisms of general anesthetic action. Trends in Pharmacological Sciences, 26(10), 503–510. https://doi.org/https://doi.org/10.1016/j.tips.2005.08.006
- Herold, K. F., & Hemmings, H. C. Jr, (2012). Sodium channels as targets for volatile anesthetics. Frontiers in Pharmacology, 3, 50. https://doi.org/https://doi.org/10.3389/fphar.2012.00050
- Hilf, R. J., & Dutzler, R. (2009). Structure of a potentially open state of a proton-activated pentameric ligand-gated ion channel. Nature, 457(7225), 115–118. https://doi.org/https://doi.org/10.1038/nature07461
- Humphrey, W., Dalke, A., & Schulten, K. (1996). VMD: Visual molecular dynamics. Journal of Molecular Graphics, 14(1), 33–38. https://doi.org/https://doi.org/10.1016/0263-7855(96)00018-5
- Ion, B. F., Wells, M. M., Chen, Q., Xu, Y., & Tang, P. (2017). Ketamine Inhibition of the Pentameric Ligand-Gated Ion Channel GLIC. Biophysical Journal, 113(3), 605–612. https://doi.org/https://doi.org/10.1016/j.bpj.2017.06.041
- Jo, S., Kim, T., Iyer, V. G., & Im, W. (2008). CHARMM-GUI: A web-based graphical user interface for CHARMM. J Comput Chem, 29(11), 1859–1865. https://doi.org/https://doi.org/10.1002/jcc.20945
- Johansson, J. S., & Zou, H. (1999). Partitioning of four modern volatile general anesthetics into solvents that model buried amino acid side-chains. Biophysical Chemistry, 79(2), 107–116. https://doi.org/https://doi.org/10.1016/S0301-4622(99)00046-0
- Jorgensen, W. L., Chandrasekhar, J., Madura, J. D., Impey, R. W., & Klein, M. L. (1983). Comparison of simple potential functions for simulating liquid water. The Journal of Chemical Physics, 79(2), 926–935. https://doi.org/https://doi.org/10.1063/1.445869
- Koblin, D. D., Chortkoff, B. S., Laster, M. J., Eger, E. I., Halsey, M. J., & Ionescu, P. (1994). Polyhalogenated and perfluorinated compounds that disobey the Meyer-Overton hypothesis. Anesthesia and Analgesia, 79(6), 1043–1048. https://doi.org/https://doi.org/10.1213/00000539-199412000-00004
- Koblin, D. D., Chortkoff, B. S., Laster, M. J., Eger, E., Halsey, M., & Ionescu, P. (1995). Nonanesthetic polyhalogenated alkanes and deviations from the Meyer-Overton hypothesis. Prog. Anesth. Mech, 3, 451–456.
- LeBard, D. N., Hénin, J., Eckenhoff, R. G., Klein, M. L., & Brannigan, G. (2012). General anesthetics predicted to block the GLIC pore with micromolar affinity. PLoS Computational Biology, 8(5), e1002532https://doi.org/https://doi.org/10.1371/journal.pcbi.1002532
- Lichtenbelt, B.-J., Mertens, M., & Vuyk, J. (2004). Strategies to optimise propofol-opioid anaesthesia. Clinical Pharmacokinetics, 43(9), 577–593. https://doi.org/https://doi.org/10.2165/00003088-200443090-00002
- Lomize, M. A., Pogozheva, I. D., Joo, H., Mosberg, H. I., & Lomize, A. L. (2012). OPM database and PPM web server: Resources for positioning of proteins in membranes. Nucleic Acids Res, 40(Database issue), D370–D376. https://doi.org/https://doi.org/10.1093/nar/gkr703
- Maier, J. A., Martinez, C., Kasavajhala, K., Wickstrom, L., Hauser, K. E., & Simmerling, C. (2015). Simmerling, C. ff14SB: Improving the accuracy of protein side chain and backbone parameters from ff99SB. Journal of Chemical Theory and Computation, 11(8), 3696–3713. https://doi.org/https://doi.org/10.1021/acs.jctc.5b00255
- Meyer, H. (1899). Zur theorie der alkoholnarkose. Archiv für Experimentelle Pathologie und Pharmakologie, 42(2-4), 109–118. https://doi.org/https://doi.org/10.1007/BF01834479
- Miao, Y., Feher, V. A., & McCammon, J. A. (2015). Gaussian accelerated molecular dynamics: Unconstrained enhanced sampling and free energy calculation. Journal of Chemical Theory and Computation, 11(8), 3584–3595. https://doi.org/https://doi.org/10.1021/acs.jctc.5b00436
- Miao, Y., & McCammon, J. A. (2017). Annual reports in computational chemistry (Vol. 13; pp 231–278). Elsevier.
- Miao, Y., Sinko, W., Pierce, L., Bucher, D., Walker, R. C., & McCammon, J. A. (2014). Improved reweighting of accelerated molecular dynamics simulations for free energy calculation. Journal of Chemical Theory and Computation, 10(7), 2677–2689. https://doi.org/https://doi.org/10.1021/ct500090q
- Mowrey, D., Cheng, M. H., Liu, L. T., Willenbring, D., Lu, X., Wymore, T., Xu, Y., & Tang, P. (2013). Asymmetric ligand binding facilitates conformational transitions in pentameric ligand-gated ion channels. Journal of the American Chemical Society, 135(6), 2172–2180. https://doi.org/https://doi.org/10.1021/ja307275v
- North, C., & Cafiso, D. S. (1997). Contrasting membrane localization and behavior of halogenated cyclobutanes that follow or violate the Meyer-Overton hypothesis of general anesthetic potency. Biophysical Journal, 72(4), 1754–1761. https://doi.org/https://doi.org/10.1016/S0006-3495(97)78821-0
- Nury, H., Van Renterghem, C., Weng, Y., Tran, A., Baaden, M., Dufresne, V., Changeux, J.-P., Sonner, J. M., Delarue, M., & Corringer, P.-J. (2011). X-ray structures of general anaesthetics bound to a pentameric ligand-gated ion channel. Nature, 469(7330), 428–431. https://doi.org/https://doi.org/10.1038/nature09647
- Nys, M., Kesters, D., & Ulens, C. (2013). Structural insights into Cys-loop receptor function and ligand recognition. Biochemical Pharmacology, 86(8), 1042–1053. https://doi.org/https://doi.org/10.1016/j.bcp.2013.07.001
- Overton, C. E. (1901). Studien über die Narkose zugleich ein Beitrag zur allgemeinen Pharmakologie. Fischer.
- Palermo, G., Miao, Y., Walker, R. C., Jinek, M., & McCammon, J. A. (2017). CRISPR-Cas9 conformational activation as elucidated from enhanced molecular simulations. Proceedings of the National Academy of Sciences of the United States of America, 114(28), 7260–7265. https://doi.org/https://doi.org/10.1073/pnas.1707645114
- Pan, J., Chen, Q., Willenbring, D., Mowrey, D., Kong, X.-P., Cohen, A., Divito, C. B., Xu, Y., & Tang, P. (2012). Structure of the pentameric ligand-gated ion channel GLIC bound with anesthetic ketamine. Structure (London, England : 1993)), 20(9), 1463–1469. https://doi.org/https://doi.org/10.1016/j.str.2012.08.009
- Pettersen, E. F., Goddard, T. D., Huang, C. C., Couch, G. S., Greenblatt, D. M., Meng, E. C., & Ferrin, T. E. (2004). UCSF Chimera-a visualization system for exploratory research and analysis. Journal of Computational Chemistry, 25(13), 1605–1612. https://doi.org/https://doi.org/10.1002/jcc.20084
- Pohorille, A., Wilson, M. A., New, M. H., & Chipot, C. (1998). Concentrations of anesthetics across the water–membrane interface; the Meyer–Overton hypothesis revisited. Toxicology Letters, 100-101, 421–430. https://doi.org/https://doi.org/10.1016/S0378-4274(98)00216-1
- Raju, S., Barber, A. F., LeBard, D. N., Klein, M. L., & Carnevale, V. (2013). Exploring volatile general anesthetic binding to a closed membrane-bound bacterial voltage-gated sodium channel via computation. PLoS Computational Biology, 9(6), e1003090. https://doi.org/https://doi.org/10.1371/journal.pcbi.1003090
- Roe, D. R., & Cheatham, T. E., III. (2013). PTRAJ and CPPTRAJ: Software for processing and analysis of molecular dynamics trajectory Data. J Chem Theory Comput, 9(7), 3084–3095. https://doi.org/https://doi.org/10.1021/ct400341p
- Roe, D. R., & Cheatham, T. E., III. (2018). Parallelization of CPPTRAJ enables large scale analysis of molecular dynamics trajectory data. Journal of Computational Chemistry, 39(25), 2110–2117. https://doi.org/https://doi.org/10.1002/jcc.25382
- Sauguet, L., Poitevin, F., Murail, S., Van Renterghem, C., Moraga-Cid, G., Malherbe, L., Thompson, A. W., Koehl, P., Corringer, P.-J., Baaden, M., & Delarue, M. (2013). Structural basis for ion permeation mechanism in pentameric ligand-gated ion channels. The EMBO Journal, 32(5), 728–741. https://doi.org/https://doi.org/10.1038/emboj.2013.17
- Schofield, C. M., Jenkins, A., & Harrison, N. L. (2003). A highly conserved aspartic acid residue in the signature disulfide loop of the alpha 1 subunit is a determinant of gating in the glycine receptor. The Journal of Biological Chemistry, 278(36), 34079–34083. https://doi.org/https://doi.org/10.1074/jbc.M302416200
- Sebel, P. S., Bovill, J. G., Wauquier, A., & Rog, P. (1981). Effects of high-dose fentanyl anesthesia on the electroencephalogram. Anesthesiology, 55(3), 203–211. https://doi.org/https://doi.org/10.1097/00000542-198109000-00004
- Smith, C., McEwan, A. I., Jhaveri, R., Wilkinson, M., Goodman, D., Smith, L. R., & Glass, P. (1994). The interaction of fentanyl on the Cp50 of propofol for loss of consciousness and skin incision. Anesthesiology, 81, 820–828.
- Stanley, T. H., & Webster, L. R. (1978). Anesthetic requirements and cardiovascular effects of fentanyl-oxygen and fentanyl-diazepam-oxygen anesthesia in man. Anesthesia and Analgesia, 57(4), 411–416. https://doi.org/https://doi.org/10.1213/00000539-197807000-00008
- Taheri, S., Halsey, M. J., Liu, J., Eger, E. I., Koblin, D. D., & Laster, M. J. (1991). What solvent best represents the site of action of inhaled anesthetics in humans, rats, and dogs?. Anesthesia and Analgesia, 72(5), 627–634. https://doi.org/https://doi.org/10.1213/00000539-199105000-00010
- Todd, M. M., Warner, D. S., Sokoll, M. D., Maktabi, M. A., Hindman, B. J., Scamman, F. L., & Kirschner, J. (1993). A prospective, comparative trial of three anesthetics for elective supratentorial craniotomy. Propofol/fentanyl, isoflurane/nitrous oxide, and fentanyl/nitrous oxide. Anesthesiology, 78(6), 1005–1020. https://doi.org/https://doi.org/10.1097/00000542-199306000-00002
- van den Brink-van der Laan, E., Killian, J. A., & de Kruijff, B. (2004). Nonbilayer lipids affect peripheral and integral membrane proteins via changes in the lateral pressure profile. Biochimica et Biophysica Acta, 1666(1-2), 275–288. https://doi.org/https://doi.org/10.1016/j.bbamem.2004.06.010
- Van Der Spoel, D., Lindahl, E., Hess, B., Groenhof, G., Mark, A. E., & Berendsen, H. J. (2005). GROMACS: Fast, flexible, and free. Journal of Computational Chemistry, 26(16), 1701–1718. https://doi.org/https://doi.org/10.1002/jcc.20291
- Vuyk, J. (1997). Pharmacokinetic and pharmacodynamic interactions between opioids and propofol. Journal of Clinical Anesthesia, 9(6 Suppl), 23S–26S. https://doi.org/https://doi.org/10.1016/S0952-8180(97)00117-7
- Wang, J., Wolf, R. M., Caldwell, J. W., Kollman, P. A., & Case, D. A. (2004). Development and testing of a general amber force field. Journal of Computational Chemistry, 25(9), 1157–1174. https://doi.org/https://doi.org/10.1002/jcc.20035
- Wu, E. L., Cheng, X., Jo, S., Rui, H., Song, K. C., Dávila-Contreras, E. M., Qi, Y., Lee, J., Monje-Galvan, V., Venable, R. M., Klauda, J. B., & Im, W. (2014). CHARMM-GUI membrane builder toward realistic biological membrane simulations. Journal of Computational Chemistry, 35(27), 1997–2004. https://doi.org/https://doi.org/10.1002/jcc.23702
- Xiu, X., Hanek, A. P., Wang, J., Lester, H. A., & Dougherty, D. A. (2005). A unified view of the role of electrostatic interactions in modulating the gating of Cys loop receptors. The Journal of Biological Chemistry, 280(50), 41655–41666. https://doi.org/https://doi.org/10.1074/jbc.M508635200
- Zhu, F., & Hummer, G. (2010). Pore opening and closing of a pentameric ligand-gated ion channel. Proceedings of the National Academy of Sciences of the United States of America, 107(46), 19814–19819. https://doi.org/https://doi.org/10.1073/pnas.1009313107