
Abstract
Cytosolic glutathione S-transferase (GST) enzymes participate in several cellular processes in addition to facilitating glutathione conjugation reactions that eliminate endogenous and exogenous toxic compounds, especially electrophiles. GSTs are thought to interact with various kinases, resulting in the modulation of apoptotic processes and cellular proliferation. The present research used a combination of in silico and in vitro studies to investigate protein–protein interactions between the seven most abundant cytosolic GSTs—GST alpha-1 (GST-A1), GST alpha-2 (GST-A2), GST mu-1 (GST-M1), GST mu-2 (GST-M2), GST mu-5 (GST-M5), GST theta-1 (GST-T1) and GST pi-1 (GST-P1)—and Mitogen-activated protein kinase 8 (MAPK8) and Apoptosis signal-regulating kinase 1 (ASK1). MAPK8 and ASK1 were chosen as this study’s protein interaction partners because of their predominant role in electrophile or cytokine-induced stress-mediated apoptosis, inflammation and fibrosis. The highest degree of sequence homology or sequence similarity was observed in two GST subgroups: the GST-A1, GST-A2 and GST-P1 isoforms constituted subgroup1; the GST-M1, GST-M2 and GST-M5 isoforms constituted subgroup 2. The GST-T1 isoform diverged from these isoforms. In silico investigations revealed that GST-M1 showed a significantly higher binding affinity to MAPK8, and its complex was more structurally stable than the other isoforms, in the order GST-M1 > GST-M5 > GST-P1 > GST-A2 > GST-A1 > GST-M2 > GST-T1. Similarly, GST-A1, GST-P1 and GST-T1 actively interacted with ASK1, and their structural stability was also better, in the order GST-T1 > GST-A1 > GST-P1 > GST-A2 > GST-M5 > GST-M1 > GST-M2. To validate in silico results, we performed in vitro crosslinking and mass spectroscopy experiments. Results indicated that GST-M1 interacted with GST-T1 to form heterodimers and confirmed the predicted interaction between GST-M1 and MAPK8.
Communicated by Ramaswamy H. Sarma
1. Introduction
Cytosolic glutathione S-transferase (GST) enzymes are involved in multiple cellular processes, in addition to catalysing glutathione conjugation reactions that eliminate endogenous and exogenous toxic compounds, especially electrophiles (Adler et al., Citation1999; Gülçin, Scozzafava, Supuran, Akıncıoğlu, et al., Citation2016; Gülçin, Scozzafava, Supuran, Koksal, et al., Citation2016; Hayes & Pulford, Citation1995; Hayes et al., Citation2005; Taslimi et al., Citation2020; Temel et al., 2018). Members of the cytosolic GST family share sequence similarity among themselves and with members of the mitochondrial GST family (Gulçin et al., Citation2018; Nebert & Vasiliou, Citation2004; Türkan et al., Citation2020). Structure-wise, Cytosolic GST enzymes comprise two important domains and two critical binding sites: the N-terminal thioredoxin-like domain is responsible for glutathione binding, i.e. at G-sites, and the C-terminal alpha-helical domain and the N-terminal domain both harbour the hydrophobic ligand-binding site, i.e. at H-sites (Lian, Citation1998). GSTs exhibit versatility in binding to inhibitors or substrates at H-sites, as demonstrated in previous experiments involving specific ligands (Lo Bello et al., Citation1997; Oakley et al., Citation1997).
GSTs can act as ligandins (Lu & Atkins, Citation2004) since they are thought to inhibit some of the key proteins—c-JUN N-terminal kinase-1 (JNK1) or mitogen-activated protein kinase 8 (MAPK8), apoptosis signal-regulating kinase 1(ASK1)—responsible for inducing the apoptotic process. MAPK8 and ASK1 are key factors in the apoptotic processes due to electrophile-induced oxidative stress and cytokine-mediated inflammatory response (Adler et al., Citation1999; Cho et al., Citation2001). The hypothesised inhibition of MAPK8 and ASK1 by GSTs may occur directly or indirectly, via protein–protein interaction with the target proteins or by limiting the consequent activation of those target proteins (Cho et al., Citation2001; Gilot et al., Citation2002; Wu et al., Citation2006). However, it is unknown whether this interaction is due to one specific GST isoform (often reported to be GST-P1) or is exhibited by all cytosolic GSTs. It is unclear which GST isoform might show an increased binding affinity towards either MAPK8 or ASK1. Unravelling the binding affinities, interaction patterns and structural stability of various GST isoform complexes with either MAPK8 (JNK1) or ASK1 is crucial since these studies could provide insights into the targeted covalent inhibition (TCI) or targeted noncovalent inhibition (TNCI) of this family of enzymes. The latter further contributes to the development of inhibitors that can modulate cellular responses such as apoptosis, fibrosis and inflammation (Ma et al., Citation2007, Citation2014). TCI and TNCI strategies are pivotal to identify the most promising leads, based on three extensive in silico screening techniques—structure-based virtual screening (SBVS), ligand-based virtual screening (LBVS) and drug repurposing of FDA approved drugs for another pharmacological indication. Physiologically (observed at 20–40 nM concentrations), cytosolic GSTs are mostly present as dimers, with only traces of monomers to be found (Fabrini et al., Citation2009), and it has been proposed that both forms interact with MAPKs (Adler et al., Citation1999). GST isoforms may form heterodimers or homodimers (Fabrini et al., Citation2009), and the binding affinities of such interactions indicate their readiness to form heterodimers in the absence or abundance of a specific GST isoform. Insights into the protein–protein interactions of each cytosolic GST isoform with MAPK8 and ASK1 also illustrates the probability of each active isoform being in either the glutathione-bound or target protein-bound forms (Mollica et al., Citation2016). Understanding protein–protein affinities will also help to evaluate the role of particular GST isoforms expressed in specific tissues and prompting electrophile-induced stress-mediated apoptosis via the ASK1–JNK1 pathway (Adler et al., Citation1999; Cho et al., Citation2001; Ma et al., Citation2014; Wu et al., Citation2006)
The present study investigated the protein–protein interactions of the seven most abundant cytosolic GST isoforms, which are predominantly expressed in hepatocytes and hematopoietic cells together with MAPK8 and ASK1. Combined in silico and in vitro studies identified the most feasible and pertinent interacting partner (). To the best of our knowledge, this was the first time that such a hybrid in silico–in vitro study had been used to identify the suitable binding and interaction partners for these seven cytosolic GST isoforms. The systematic approach proposed here could serve as the basis for identifying the interaction and binding partners of other enzymes, thus, opening a gateway for numerous experimental studies.
Table 1. Details of the seven cytosolic GST isoforms.
2. Material and methods
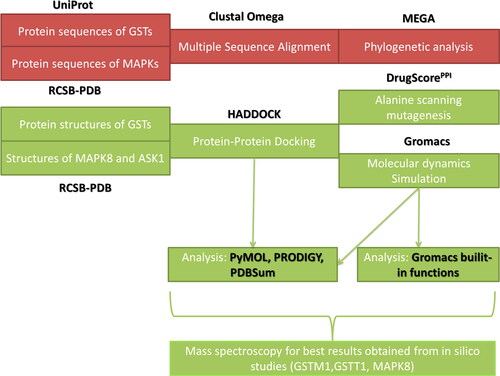
A schematic workflow of the present study’s methodology is depicted in .
Figure 1. Study’s schematic workflow. Tool and database explanations and abbreviations are given in the main text.
2.1. In silico investigations
2.1.1. Preparation of the input protein sequence dataset, comparative protein sequence alignment and phylogenetic tree construction
The amino acid sequences of seven cytosolic GST isoforms and members of the MAPK family were selected and retrieved from the Universal Protein Resource (UniProt) database () (Bateman et al., Citation2017). Multiple sequence alignment (or comparative protein sequence alignment) was performed using the Clustal Omega web server (Sievers et al., Citation2011), which is based on a progressive method, followed by the construction of a phylogenetic tree using four methods, namely, the Unweighted Pair Group Method with Arithmetic Mean (UPGMA), Maximum Parsimony (MP), Minimum Evolution (ME) and Neighbour-Joining (NJ).These four methods were combined to obtain a more reliable, consensus-based phylogenetic tree. The statistical significance of the phylogenetic tree’s topology was evaluated using a bootstrap analysis with a 1000-iterative tree construction, using the Molecular Evolutionary Genetics Analysis (MEGA) package, Version 4 (Hall, Citation2013).This analysis produced the following sequential and evolutionary details: (i) number of conserved sites (C), (ii) number of variable sites (V), (iii) number of parsimony-informative sites (Pi), (iv) number of singleton sites (S), (v) pairwise evolutionary distances, (vi) overall mean average or overall mean distances, (vii) closest homolog and (viii) homologs which were found in neighbouring clades or groups.
2.1.2. In silico interactions between GSTs and MAPK8 or ASK1
2.1.2.1. Protein–protein docking
We investigated the intermolecular interactions of seven cytosolic GST isoforms with MAPK8 and with ASK1 in terms of their critical interacting key residues (responsible for the formation of predicted protein–protein complexes), types of intermolecular interactions (mainly hydrogen bonds and disulphide bonds), modes of binding, binding orientation, hotspot residues (residues frequently interacting with interaction partners) and estimated binding affinities. Three-dimensional protein structures were retrieved from the Research Collaboratory for Structural Bioinformatics-Protein Data Bank (RCSB-PDB) (Berman et al., Citation2000). The experimental structural information for the seven cytosolic GST isoforms is available in the Supporting Information (Tables S1–S7). The easy interface option in the High Ambiguity Driven Protein–Protein Docking (HADDOCK) web portal (De Vries et al., Citation2010) was then used to perform protein–protein docking calculations for the GST isoforms with ASK1 or MAPK8. Finally, the best HADDOCK docking solution for each protein–protein complex (isoform’s interaction) was selected based on two important criteria:(i) a significant or higher number of populations or docking solutions (largest cluster) or docking solutions for that complex and (ii) higher docking or HADDOCK score, indicating strong binding affinity between the complex’s two proteins. The detailed methodology for using the HADDOCK programme is given in the Supporting Information (Methodology 1). Further, the essential structural parameters of these predicted protein–protein complexes were obtained using PROtein binDIng enerGY prediction (PRODIGY) and an analysis of the structural summaries in the Protein Data Bank (PDBSum) web services (De Beer et al., Citation2014). These structural parameters include interface area, interface volume, number of interfacial amino acid residues, number of salt bridges, number of disulphide bonds, number of intermolecular hydrogen bonds, number of nonbonded contacts, estimated free energy of binding (ΔG) and details of interfacial and noninterfacial contacts. As with the intermolecular interactions between GSTs and MAPK8 or ASK1, intramolecular interactions studies were also performed and analysed among the GST isoforms themselves, using the methods given in Supporting Information (Methodology 1).
2.1.3. Identification of hotspot residues using in silico alanine scanning mutagenesis
To compute the hotspot residues of the interactions between GSTs and ASK1 or MAPK8, the complexes displaying strong and significant binding affinity and structural stability in the HADDOCK web portal (De Vries et al., Citation2010) were submitted to the DrugScorePPI webserver (Krüger & Gohlke, Citation2010). This webserver uses a knowledge-based scoring function to scan the interface residues between two proteins in a protein–protein complex and mutate those residues into alanine. Subsequently, the ΔGWT (wild type) and ΔGMT (mutant type) interface residues to alanine were calculated, and finally, ΔΔG indicates the change in the free energy of binding calculated for each of the interface residues between GSTs and ASK1 or MAPK8. A positive value represents a possible hotspot residue which might be involved in protein–protein interactions. This analysis revealed the potential hotspot residues on GST isoforms that are crucial for intermolecular interactions with MAPK8 and with ASK1.
2.1.4. Molecular dynamics simulation of GSTs with MAPK8 and ASK1
We used the Gromacs software package, version 5.0.5 (Van Der Spoel et al., Citation2005), and a period of 20 ns to perform molecular dynamics (MD) simulations of the interactions between selected GST isoforms and MAPK8 or ASK1. We used Optimized Potentials for Liquid Simulations (OPLS-AA/L) all-atom force field (Robertson et al., Citation2015), with the default cubic box parameters for MD simulations, employing the following standard steps:(i) preparation of input files for MD simulation such as conversion of a Protein Data Bank (PDB) file to a Gromacs-formatted input file (GRO), creation of a topology file describing the geometrical parameters of a protein–protein complex, namely, charge group identification, bond-length, bond-angle, proper and improper torsion angles and positional restraint files to avoid steric clashes between the complex’s atoms when higher force MD simulation was applied; (ii) definition of the box dimension around the protein–protein complex; (iii) addition of water molecules (in this case, we used a Single Point Charge Extended (SPCE) to the box); (iv) addition of counterions (positive or negative ions to neutralise the system); (v) energy minimisation using the steepest-descent approach and involving two-phase equilibration (phase1 using a constant Number of particles, Volume and Temperature or NVT;phase2 using constant Number of particles, Pressure and Temperature or NPT) followed by the production of MD simulations for the protein–protein complexes using a period of 20 ns. The results were analysed using various built-in Gromacs package functions, such as Root Mean Square Deviations (RMSD), Root Mean Square Fluctuation (RMSF), Radius of Gyration (RoG), Potential energy and Intermolecular Hydrogen Bonding interactions. Finally, a Principal Component Analysis (PCA) was performed for all the protein–protein complex trajectories (global motions) obtained from the Gromacs package, using the Essential Dynamics (ED) approach to reduce data complexity and extract the simulation’s concerted and biologically significant motion. This motion is pivotal to, necessarily correlated with, and meaningful for the complex’s biological function. Finally, a manual inspection, using the PyMOL programme (Rother, Citation2005), was made to visualise the crucial residues and intermolecular interactions occurring between the two proteins in a predicted protein–protein complex.
2.2. In vitro analyses
2.2.1. Mass spectrometry-based protein–protein interaction analysis—multimer analysis
2.2.1.1. Instrumentation and proteins
In silico predictions were validated by performing in vitro studies on one of the protein–protein complexes, namely GST-M1–MAPK8 since this complex exhibited significant binding affinity and stronger structural stability in comparison with others. Measurements were made using an Autoflex II Matrix-Assisted Laser Desorption Ionization–Time-of-Flight (MALDI–TOF) mass spectrometer (Bruker) (Supporting Information, Method 2) equipped with CovalX’s HM4 interaction module (CovalX AG, Switzerland). The module contains a special detection system designed to optimise detection up to 2 MDa with nano-molar sensitivity. The in vitro investigations used pure GST-M1 (23.6 kDa), GST-T1 (31.5 kDa) and MAPK8 (50.5 kDa) recombinant human proteins (PROSPEC).
2.2.1.2. Crosslinking experiments
For control experiments, 20 μL of each protein sample, with >85–90% purity (GST-M1, GST-T1 and MAPK8) were pipetted into eight dilution concentrations ranging from 1.96 to 250 μg/L with a final volume of 10 μL. One microlitre of each dilution was mixed with 1 μL of a matrix composed of a re-crystallised sinapinic acid (10 mg/mL) in acetonitrile/water (1:1, v/v) and trifluoroacetic acid 0.1% (K200 MALDI Kit). After mixing, 1 μL of each sample was spotted on a MALDI plate (SCOUT 384). After evaporation at room temperature, the plate was introduced into the MALDI mass spectrometer and analysed immediately in High-Mass MALDI mode. Analyses were done in triplicates.
Each mixture prepared for the aforementioned control experiment (9 μL) underwent crosslinking using CovalX’s K200 MALDI MS analysis kit (CovalX, Switzerland). The protein solutions (concentration ranges are reported in the Supporting Information, Method 2) were mixed with 1 μL of K200 stabiliser reagent (2 mg/mL) and incubated at room temperature. After incubation (180 min), samples were prepared for MALDI analysis as the control experiments had been. The samples were analysed using High-Mass MALDI MS immediately after evaporation. The MALDI–ToF MS analysis was performed using CovalX’s HM4 interaction module, with a standard nitrogen laser and focusing on different mass ranges from 0 to 1500 kDa (analysis parameters used are given in the Supporting Information, Method 2).
2.2.1.3. Characterization of the GST-M1/GST-T1 and GST-M1/MAPK8 protein complexes
Mixtures of GST-M1 and GST-T1 and of GST-M1 and MAPK8 were prepared with the concentrations, (detailed in Supporting Information, Method 2). One microlitre of the mixture obtained was mixed with 1 μL of a matrix composed of a re-crystallised sinapinic acid matrix (10 mg/mL) in acetonitrile/water (1:1, v/v) and trifluoroacetic acid 0.1% (K200 MALDI Kit). After mixing, 1 μL of each sample was spotted on the MALDI plate (SCOUT 384), and following evaporation at room temperature, the plate was introduced into the MALDI mass spectrometer and analysed immediately. Analyses were repeated in triplicate.
An external calibration of the instrument was made using clusters of insulin, bovine serum albumin and immunoglobulin G. Three spots were analysed from each sample (300 laser shots per spot). The presented spectrum corresponds to the sum of 300 laser shots. The mass spectrometry data were analysed using CovalX’s Complex Tracker analysis software, version 2.0 (CovalX, Switzerland).
3. Results and discussion
3.1. Comparative protein sequence alignment and phylogenetic analysis
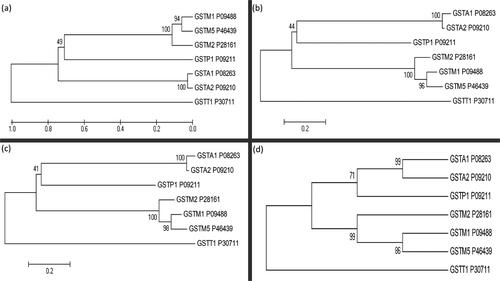
The Protein sequence analysis was used to evaluate the properties of selected seven cytosolic GST isoforms such as, molecular weight, isoelectric point, amino acid composition, instability index, aliphatic index, half-life, extinction coefficient. The result obtained from this analysis is given in the Supporting Information (Tables S9 and S10). Interestingly, GST-T1’s aliphatic index and GRAVY score were higher than those predicted for the other proteins (see results in Supporting Information Tables S11 and S12).The phylogenetic analysis of the GSTs identified 249 presumed functional sites, out of which, we observed 19 conserved, 212 variable, 52 singleton and 158 parsimony-informative sites. The information on conserved sites and variable sites was used to construct a phylogenetic tree, based on the UPGMA and NJ methods. Singleton sites and parsimony-informative sites are useful for constructing a phylogenetic tree relying on character-based approaches, namely MP and ME methods. This phylogenetic analysis provided valuable insights into the sequence similarity, sequence identity, conservation and divergence present among the selected seven cytosolic GST isoforms. We chose four phylogenetic analysis methods to achieve more reliable evolutionary detail in terms of pairwise distances: the identification of a group or clade, the identification of subgroups or sister clades, the measurement of overall mean distances or overall mean average, and similarity statistics among the seven cytosolic GST isoforms (). We observed high sequence similarity or sequence homology between those isoforms, as reported previously (Nebert & Vasiliou, Citation2004). The overall evolutionary distance between these seven GST isoforms was found to be 1.246 (). We observed significant pairwise distances (strong sequence similarities) between the GST isoforms (Supporting Information, Table S8), leading us to form two subgroups, namely subgroup1 (GST-A1, GST-A2 and GST-P1) and subgroup2 (GST-M1, GST-M2 and GST-M5). As expected, the typical N and C terminal domains were identified in all the isoforms. The GST-T1 isoform diverged completely from the other six GST isoforms on this phylogenetic tree. Overall, the phylogenetic analysis revealed higher sequence identity and significant pairwise distances between the seven selected GST isoforms, but less divergence was observed among the selected seven cytosolic GST isoforms (Supporting Information, Table S8). Phylogenetic analyses indicated that it is most likely that the activities of GST-P1 would be taken care by GST-M1, GST-M5, GST-M2 followed by GST-A1 or GST-A2 isoforms, whenever there is less abundance or dysfunctional GST-P1 and vice versa. Overlapping substrate specificities would also be explained by these analyses. It is possible that it is the quantity, localization of a specific isoform but not substrate specificities that could determine its conjugating capacities or other functional roles. Thus, genetic variants in some of these isoforms are more important owing to their abundance in certain tissues, for example, GST-A1 in liver and testes, GST-M5 in ovary and breast (Uhlén et al., Citation2015).(ML)
Figure 2. Phylogenetic analysis of seven human glutathione S-transferase isoforms using four different methods: (a) Unweighted pair-group mean average (UPGMA), (b) Neighbour-joining (NJ), (c) Minimum evolution (ME) and (d) Maximum parsimony (MP). Each isoform’s UniProt accession number is also shown.
A comparative protein sequence alignment of 16 MAP kinases (Supporting Information, Figure S1) revealed 44 conserved, 822 variable, 352 parsimony-informative and 345 singleton sites out of 1543 putative functional sites. Interestingly, the 44 conserved sites were mainly in the kinase domain of MAP kinases, revealing most of the common catalytic residues present in the MAP kinase family. The theoretical isoelectric point (IEP) was below pH 7 for all the family members except MAPK13, MAPK15 and NLK, indicating a higher number of basic amino acid residues for these family members (Supporting Information, Tables S12 and S13). The overall mean distance between the MAPK family members was 1.02, suggesting that this lower divergence was because most of the residues found in the catalytic domain are conserved. Results indicated that MAPK9 and MAPK10 are closer to MAPK8 (or JNK1), whereas MAPK6 and MAPK4 are closer to ASK1. In this report, we suggest that both MAPK8 and ASK1 interact with GST isoforms and, based on the results obtained from the phylogenetic analysis, that MAPK4, MAPK6, MAPK9 and MAPK10 (Supporting Information, Figures S2 and S3) may interact with GST isoforms. However, further in silico and in vitro studies will be necessary to confirm this hypothesis.
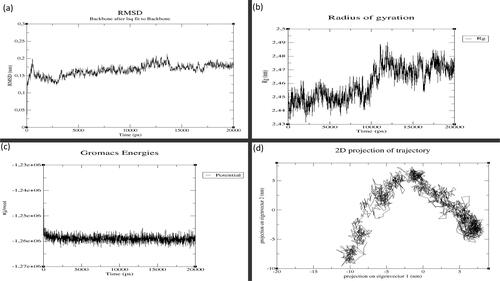
Figure 3. MD simulation results for GST-M1 with MAPK8: (a) Root Mean Square Deviation (RMSD), (b) Radius of Gyration (RoG), (c) Potential Energy and (d) Principal Component Analysis (PCA). (X-axis: time in graphs (a), (b) and (c). Y-axis: values for (a) RMSD, (b) RoG and (c) Potential energy. For graph (d), X-axis: principal component 1 and Y-axis: principal component 2.
3.2. In silico analysis of protein–protein interactions between GSTs and MAPK8 and ASK1
Analysis of the estimated free energy of binding (ΔG computed using PRODIGY for predicted protein–protein complexes) of the GSTs with MAPK8 showed that members of subgroup2—GST-M isoforms: GST-M1 (–14.1 kcal/mol), GST-M2 (–15.7 kcal/mol) and GST-M5 (–16.8 kcal/mol)—and an outlier,GST-T1 (–13.5 kcal/mol), exhibited higher binding affinities to MAPK8’s kinase domain than did the other members of the GST family ( and ). Regarding other GST–ASK1 interactions, binding affinities followed the order: GST-A1 (–17.1 kcal/mol) > GST-M5 (–15.4 kcal/mol) > GST-A2 (–15.1 kcal/mol) > GST-M1 (–14.9 kcal/mol) > GST-M2 (–14.4 kcal/mol), GST-P1 (–14.4 kcal/mol) > GST-T1 (–11.7 kcal/mol) ( and ). These observations indicated that when all the GST isoforms are abundant in similar molar ratios, members of subgroup 2 on GST’s phylogenetic tree (GST Mu family members)—especially GST-M1, followed by GST-T1—would exhibit a greater tendency to interact with the MAPK8 protein. Similarly, GST-A1 isoforms would prefer to interact with ASK1 protein; however, this interaction is subject to regulation by the tissue-specific expression of GST isoforms (Wang et al., Citation2000).
Table 2. Docking score, estimated free energy of binding (ΔG) and estimated binding affinity (Kd) of GSTs with the MAPK8 and ASK1 complexes, obtained from the HADDOCK and PRODIGY web servers.
Table 3. Analysis of the intermolecular interactions of the protein–protein complexes formed by the seven GST isoforms with MAPK8 protein and with ASK1.
Under circumstances where cells contain lower levels of MAPK8 or ASK1, GSTs would preferentially undergo homo-dimerisation or hetero-dimerisation with other members. Regarding GST-M1’s binding affinity with other GST family members, protein–protein docking results suggested the following order: GST-A1 (–14.5 kcal/mol) > GST-T1 (–14.3 kcal/mol) > GST-A2 (–13.7 kcal/mol) > GST-P1 (–12.7 kcal/mol) > GST-M2 (–11.9 kcal/mol) (Supporting Information Tables S13 and S14). Details of the intramolecular interactions are given in the Supporting Information (Table S15).
Whereas protein–protein docking is a semi-flexible approach, in which one protein is fixed and the other is flexible around it, MD simulation can mimic the protein–protein complex’s physiological function, thus explaining the complex’s behaviour in the presence of an aqueous environment. The predicted protein–protein docking complexes, thus, obtained were subjected to MD simulation to understand their long-term structural stability, integrity, compactness and protein folding properties. Together, the results of protein–protein docking and the MD simulation of GSTs and MAPK8 revealed that—interestingly and in comparison, with other isoforms—GST-M1 had the greatest binding affinity and strongest structural stability with MAPK8 (). In contrast, MD simulation of GSTs and ASK1 demonstrated that GST-T1 showed the greatest structural stability with ASK1 (). These MD simulations suggested that MAPK8 and ASK1 could be the most promising partners for interaction with GST-M1 and GST-T1, respectively. Other isoforms also showed reasonable binding affinity and structural stability towards these two interacting partners, however.
Table 4. Time-averaged structural properties obtained from the MD simulations of seven GST isoforms with MAPK8 and with ASK1 protein.
The MD simulations of GSTs withMAPK8 and of GSTs with ASK1 are given in the Supporting Information (Figures S4–S12). To understand the key structural details in terms of stability, integrity, compactness and folding properties, we now discuss the GST-M1–MAPK8 and GST-T1–ASK1 complexes. RMSD and RMSF analyses shed light on the structural stability and flexibility of the protein-protein complexes, respectively. The GST-M1–MAPK8 complex had the lowest average RMSD (0.167 nm; ), and RMSF values (0.110 nm) suggesting stronger structural stability, lower flexibility than other complexes (Supporting Information Figures S11 and S12) highlighting significant interaction of GST-M1 with the kinase domain of MAPK8.The GST-M1–MAPK8 complex attained the stabilisation state after 5000 ps (5 ns), and it maintained its structural stability until the end of the 20 ns in comparison with other complexes. The GST-M1–MAPK8 complex also showed low average RoG values (2.46 nm), i.e. better than the other complexes ( and ). The GST-M1–MAPK8’s RoG profile was similar until 10 ns, but the profile was altered due to conformational changes. However, the GST-M1–MAPK8 complex’s potential energy is slightly higher because of the presence of loop or coil elements in the structure of GST-M1 or MAPK8. Moreover, in addition to global dynamics, PCA (or essential dynamics) was used to capture the relative biologically significant motion based on global trajectories. The GST-M1–MAPK8 complex displayed a lower trace of covariance matrix value (169.265 nm2) than the other complexes. Lower trace of covariance matrix value indicates that the complex is stable at the same time flexibility is also lower, hence, this particular complex occupied the lesser region in the conformational space. The results obtained from RMSD, RMSF and RoG analyses were consistent with the results of PCA (or essential dynamics) results of GST-M1–MAPK8. All these observations suggested that GST-M1 had a strong binding affinity and higher structural stability with MAPK8. On the other hand, MD simulations of GSTs with ASK1 revealed no vast differences between the seven GST isoform–ASK1 complexes ().The results from these analyses suggested that most of the isoforms could interact with ASK1. However, the GST-T1–ASK1 complex had lower covariance matrix values (235.815 nm2), as revealed using PCA, and this complex had a consistent structural pattern (). In contrast, the average RMSD (0.22 to 0.27 nm),RMSF (0.132 to 0.181 nm) and RoG values (2.65 to 2.74 nm) for most of the complexes were similar, except for GST-M2 which showed significantly higher average RMSD (0.3 nm), RoG (2.93 nm) values but higher RMSF value (0.181 nm) indicating higher flexibility of this complex. Protein–protein docking () and global and essential dynamics analyses supported the idea that GST-A1, GST-P1 and GST-T1 isoforms might actively interact with ASK1, with slightly more certainty for GST-T1. However, further experimental studies will be required to validate this hypothesis. The kinase domains of MAPK8 and ASK1 proteins interacted in particular with the hydrophobic sites (H-sites) of the seven GST isoforms. The residues found in GST's H-sites and MAPK kinase domains play an important role in determining the intermolecular interactions between GSTs and MAPKs. Details of the GSTs’ interacting residues are given in the Supporting Information Tables S16–S30). The predicted hotspot residues of GSTs from in silico alanine scanning mutagenesis are mostly involved in the intermolecular interaction with MAPK8 and ASK1. Higher numbers of interface residues were predicted for GST-M1 isoform from the GST-M1–MAPK8 complex, whereas nearly similar numbers of interface residues were predicted for all seven GST isoform complexes with ASK1 Supporting Information (Tables S16–S30).
Figure 4. MD simulation results for GST-T1 with ASK1, (a) RMSD, (b) Radius of Gyration, (c) Potential Energy and (d) Principal Component Analysis (X-axis: time in (a), (b) and (c). Y-axis: values for graphs (a) RMSD, (b) RoG and (c) Potential energy. For graph (d), X-axis: principal component 1 and Y-axis: principal component 2.
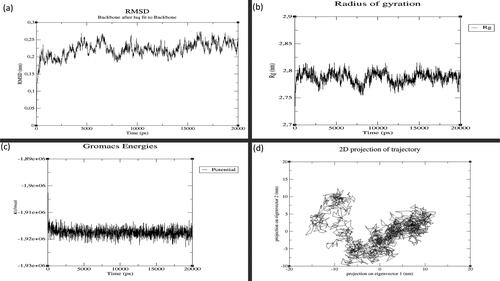
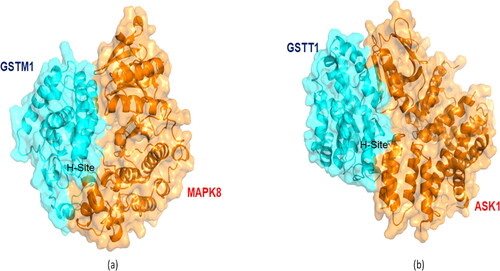
Figure 5. Predicted protein–protein complex obtained from HADDOCK’s easy interface. (a) GST-M1–MAPK8 complex and (b) GST-T1–ASK1 complex. Hydrophobic sites of GSTs interact with MAPK8’s kinase domain and with ASK1.
3.3. In vitro protein–protein interaction analyses using MALDI-TOF
In silico predictions suggested that GST-M1 and GST-T1 exhibited higher binding affinities and stronger structural stability with MAPK8 and ASK1, respectively. However, the predictions for GST-M1–MAPK8 interaction were better than for GST-T1–ASK1. Thus, to validate these computational predictions, we performed crosslinking and mass spectroscopy studies on GST-M1–MAPK8. Interestingly, the results obtained from in silico predictions are consistent with in vitro studies. In vitro interactions mixed GST-M1 with GST-T1 and GST-M1 with MAPK8. The peak masses (observed molecular weights) of the controls and the crosslinking experiments are detailed in the Supporting Information (Table S31). In separate crosslinking experiments, GST-M1 showed no noncovalent complexes at the higher molecular weights that could have represented homo-oligomers, whereas GST-T1 showed peaks representing monomeric, dimeric, tetrameric and hexameric forms (Supporting Information, Figures S13–S17). In crosslinking experiments comprising GST-M1 and GST-T1, peaks corresponding to monomers of both proteins, GST-T1 homodimers, GST-M1–2GST-T1 trimers and GST-T1 homo tetramers were detected (Supporting Information, Figures S13–S17). Upon testing the interaction between GST-M1 and MAPK8 in crosslinking experiments, we observed a peak corresponding to a dimer composed of both proteins (Supporting Information, Figures S13–S17). These results agree with the protein–protein docking and MD simulation predictions for GST-M1–MAPK8 complex, i.e. greater binding affinity and stronger structural stability. However, we did not map the residues involved in the interaction using in vitro methods. Mapping the residues experimentally using techniques such as Cross-Linking Mass Spectrometry (XLMS) and Hydrogen deuterium exchange mass spectrometry (HDXMS), would confirm the in silico predictions, but not under the purview of the current investigation which is aimed at identifying the presence or absence and readiness of GST isoforms for interaction with MAPK8 and ASK1. Future experimental studies are necessary in order to map the residues involved in the interaction.
The results showed that in vitro testing at very low concentrations could provide insights into noncovalent interactions between two proteins of interest; the crosslinking experiments showed evidence that GSTs can form homo or heterodimers, trimers and tetramers. Together, they thus provided a proof-of-principle strategy for protein–protein interaction predictions in silico, followed by in vitro testing before the initiation of more complex, expensive and time-consuming experimental studies.
3.4. The interpretation of in silico and in vitro protein–protein interactions
Both MAPK8 and ASK1 are essential elements in the JNK (Jun-N-terminal kinase) signalling pathway that is activated by electrophile-induced stress (e.g. by busulfan) (Adler et al., Citation1999; Ma et al., Citation2014). Under normal conditions, activation of ASK1 results in moderate levels of JNK signalling, and this apoptotic pathway is opposed by the PI3K/AKT (phosphoinositide-3-kinase) and NF-KB (nuclear factor kappa-light-chain-enhancer of activated B cells) pathways that promote cellular proliferation (Tobiume et al., Citation2001). GSTs, thioredoxins may interfere with the activation of JNK directly or indirectly by inhibiting ASK1. These direct or indirect means of inhibition would thus modulate the apoptosis due to electrophile-induced stress. The availability of interacting GST isoforms may vary due to either their participation in the detoxification of electrophiles or their genetic variants (gene deletions, variants regulating expression) or tissue-specific expression. GSTs most likely regulate JNK pathway activation by modulating the phosphorylation of MAPK8 and ASK1 (Adler et al., Citation1999). Electrophilic compounds may activate ASK1, possibly by dissociating the GST–ASK1 complexes and the TrX or GPx complexes of ASK1. Considering the sequential activation of JNK1 upon activation by ASK1, we assume that the deactivation of ASK1 is efficient in the prevention of apoptosis, whereas JNK deactivation might be saturated when there is constant ASK1 activation due to electrophile-induced stress. Thus, preventing the ASK1 activation that is essential for JNK1 activation would prevent the apoptosis of cells under oxidative stress. These observations highlight the importance of GST-T1 null alleles and M1 null alleles, and the amount of proteins in the cytosol, in their role of modulating ASK1–JNK activation-induced apoptosis following electrophile-induced stress. Based on these observations, it is assumed that there is constant activation of JNK in the absence of both these proteins. This result in the cellular apoptosis that is the possible scenario in NULL carriers of these two proteins on exposure to electrophiles. Hence, the deletion of both GST-M1 and GST-T1 might promote apoptosis via the constant activation of ASK1 and JNK1. However, these cells would likely adopt alternate mechanisms to avoid apoptosis due to the activation of ASK1 and JNK1 in the absence of GST-M1 and GST-T1, respectively. Our laboratory is currently using lentiviral systems to investigate this aspect by expressing GST-M1 and GST-T1 isoforms in cells that lack these proteins. This would help us to understand the phosphorylation status of ASK1 and JNK1 in the absence of the GST-M1 and GST-T1 isoforms, respectively, and vice versa. Alternatively, using GST inhibitors might also provide evidence for this hypothesis.
The interaction between MAPK8 and GST-M1 and ASK1 and GSTs may also affect GST catalytic activity, potentially affecting the elimination of toxic electrophilic compounds. Crystal structure of GST-M1 structure complexed with glutathione (Patskovsky et al., Citation2000, Citation2006) and GST-T1 complexed with S-hexyl-glutathione (Tars et al., Citation2006) indicated that residues crucial for the GST activity are part of the interface with MAPK8 and ASK1, respectively, predicted with our in silico analysis. Based on the results obtained from this study, the activity of GSTs may be altered due to the interaction with MAPK8 and with ASK1. On the other hand, following binding of interaction partner, for example, MAPK8, to GST-M1, the conformation of H-Site and structure of GSTs may also change that might increase the GST activity. However, this need to be tested in future using GST pure proteins in the presence of interacting partners using 1-chloro-2,4-dinitrobenzene as a GST substrate (Robin et al., Citation2020).
Further experimental studies are always necessary to confirm any significant changes to GST activity. Moreover, our future work is directed towards understanding the structural and functional changes of GSTs when complexed with that of MAPK8 and ASK1.
4. Conclusion
The present study reported the protein–protein interactions of the seven most abundant cytosolic GST isoforms—GST alpha-1 (GST-A1), GST alpha-2 (GST-A2), GST mu-1 (GST-M1), GST mu-2 (GST-M2), GST mu-5 (GST-M5), GST theta-1 (GST-T1) and GST pi-1 (GST-P1)—with MAPK8 and with ASK1 using a combination of in silico and in vitro experiments. In silico predictions indicated that GST-M1 had a higher binding affinity to MAPK8, and the complex formed by these two proteins was stable according to MD simulations. No great differences were observed between the seven GST isoforms and ASK1 in MD simulation: all seven isoforms interacted with ASK1 with similar affinities; however, the GST-T1–ASK1 complex’s structural flexibility was far weaker than that of the other six GSTs. This systematic approach could serve as the basis for many other protein–protein interaction studies attempting to identify the interacting protein partners in other drug-metabolising enzymes.
Acknowledgements
JM and TSSS thank to Prof. Maria João Romão (FCT-UNL, Portugal) for the support. The authors thank Mr. Darren Hart for English Language Editing. Authors thank all researchers from Research Platform of Pediatric Onco-Hematology at University of Geneva for fruitful discussions.
| Abbreviations | ||
| GST | = | Glutathione S-Transferase |
| MAPK | = | Mitogen-Activated Protein Kinase |
| ASK | = | Apoptosis Signal-Regulating Kinase |
| MD | = | Molecular Dynamics |
| RMSD | = | Root-Mean-Square Deviation |
| RMSF | = | Root-Mean-Square Fluctuation |
| RoG | = | Radius of Gyration |
| PCA | = | Principal Component Analysis |
| ED | = | Essential Dynamics. |
Supplementary_information_final__clean.doc
Download MS Word (6.3 MB)Disclosure statement
No potential conflict of interest was reported by the authors.
Data availability statement
The raw data files and docking complexes, MD simulation files and corresponding meta-data are available at: https://zenodo.org with doi: 10.5281/zenodo.3921901.
Additional information
Funding
References
- Adler, V., Yin, Z., Fuchs, S. Y., Benezra, M., Rosario, L., Tew, K. D., Pincus, M. R., Sardana, M., Henderson, C. J., Wolf, C. R., Davis, R. J., & Ronai, Z. (1999). Regulation of JNK signaling by GSTp. The EMBO Journal, 18(5), 1321–1334. https://doi.org/https://doi.org/10.1093/emboj/18.5.1321
- Bateman, A., Martin, M. J., O’Donovan, C., et.al. (2017). UniProt: the universal protein knowledgebase. Nucleic Acids Research, 45, D158–D169.
- Berman, H. M., Westbrook, J., Feng, Z., Gilliland, G., Bhat, T. N., Weissig, H., Shindyalov, I. N., & Bourne, P. E. (2000). The Protein Data Bank. Nucleic Acids Research, 28(1), 235–242. https://doi.org/https://doi.org/10.1093/nar/28.1.235
- Cho, S. G., Lee, Y. H., Park, H. S., Ryoo, K., Kang, K. W., Park, J., Eom, S. J., Kim, M. J., Chang, T. S., Choi, S. Y., Shim, J., Kim, Y., Dong, M. S., Lee, M. J., Kim, S. G., Ichijo, H., & Choi, E. J. (2001). Glutathione S-transferase mu modulates the stress-activated signals by suppressing apoptosis signal-regulating kinase 1. The Journal of Biological Chemistry, 276(16), 12749–12755. https://doi.org/https://doi.org/10.1074/jbc.M005561200
- De Beer, T. A. P., Berka, K., Thornton, J. M., & Laskowski, R. A. (2014). PDBsum additions. Nucleic Acids Research, 42, D292–D296. https://doi.org/https://doi.org/10.1093/nar/gkt940
- De Vries, S. J., Van Dijk, M., & Bonvin, A. M. J. J. (2010). The HADDOCK web server for data-driven biomolecular docking. Nature Protocols, 5(5), 883–897. [Database] https://doi.org/https://doi.org/10.1038/nprot.2010.32
- Fabrini, R., De Luca, A., Stella, L., Mei, G., Orioni, B., Ciccone, S., Federici, G., Lo Bello, M., & Ricci, G. (2009). Monomer − dimer equilibrium in glutathione transferases: A critical re-examination. Biochemistry, 48(43), 10473–10482. https://doi.org/https://doi.org/10.1021/bi901238t
- Gilot, D., Loyer, P., Corlu, A., Glaise, D., Lagadic-Gossmann, D., Atfi, A., Morel, F., Ichijo, H., & Guguen-Guillouzo, C. (2002). Liver protection from apoptosis requires both blockage of initiator caspase activities and inhibition of ASK1/JNK pathway via glutathione S-transferase regulation. The Journal of Biological Chemistry, 277(51), 49220–49229. https://doi.org/https://doi.org/10.1074/jbc.M207325200
- Gülçin, İ., Scozzafava, A., Supuran, C. T., Akıncıoğlu, H., Koksal, Z., Turkan, F., & Alwasel, S. (2016). The effect of caffeic acid phenethyl ester (CAPE) on metabolic enzymes including acetylcholinesterase, butyrylcholinesterase, glutathione S-transferase, lactoperoxidase, and carbonic anhydrase isoenzymes I, II, IX, and XII. Journal of Enzyme Inhibition and Medicinal Chemistry, 31(6), 1095–1101. https://doi.org/https://doi.org/10.3109/14756366.2015.1094470
- Gülçin, İ., Scozzafava, A., Supuran, C. T., Koksal, Z., Turkan, F., Çetinkaya, S., Bingöl, Z., Huyut, Z., & Alwasel, S. H. (2016). Rosmarinic acid inhibits some metabolic enzymes including glutathione S-transferase, lactoperoxidase, acetylcholinesterase, butyrylcholinesterase and carbonic anhydrase isoenzymes. Journal of Enzyme Inhibition and Medicinal Chemistry, 31(6), 1698–1702. https://doi.org/https://doi.org/10.3109/14756366.2015.1135914
- Gulçin, İ., Taslimi, P., Aygün, A., Sadeghian, N., Bastem, E., Kufrevioglu, O. I., Turkan, F., & Şen, F. (2018). Antidiabetic and antiparasitic potentials: Inhibition effects of some natural antioxidant compounds on α-glycosidase, α-amylase and human glutathione S-transferase enzymes. International Journal of Biological Macromolecules, 119, 741–746. https://doi.org/https://doi.org/10.1016/j.ijbiomac.2018.08.001
- Hall, B. G. (2013). Building phylogenetic trees from molecular data with MEGA. Molecular Biology and Evolution, 30(5), 1229–1235. https://doi.org/https://doi.org/10.1093/molbev/mst012
- Hayes, J. D., Flanagan, J. U., & Jowsey, I. R. (2005). Glutathione transferases. Annual Review of Pharmacology and Toxicology, 45(1), 51–88. https://doi.org/https://doi.org/10.1146/annurev.pharmtox.45.120403.095857
- Hayes, J. D., & Pulford, D. J. (1995). The glutathione S-transferase supergene family: Regulation of GST and the contribution of the isoenzymes to cancer chemoprotection and drug resistance. Critical Reviews in Biochemistry and Molecular Biology, 30(6), 445–600. https://doi.org/https://doi.org/10.3109/10409239509083491
- Krüger, D. M., & Gohlke, H. (2010). DrugScorePPI webserver: Fast and accurate in silico alanine scanning for scoring protein-protein interactions. Nucleic Acids Research, 38, W480–W486. https://doi.org/https://doi.org/10.1093/nar/gkq471
- Lian, L. Y. (1998). NMR structural studies of glutathione S-transferase. Cellular and Molecular Life Sciences, 54(4), 359–362. https://doi.org/https://doi.org/10.1007/s000180050164
- Lo Bello, M., Oakley, A. J., Battistoni, A., Mazzetti, A. P., Nuccetelli, M., Mazzarese, G., Rossjohn, J., Parker, M. W., & Ricci, G. (1997). Multifunctional role of Tyr 108 in the catalytic mechanism of human glutathione transferase P1-1. Crystallographic and kinetic studies on the Y108F mutant enzyme. Biochemistry, 36(20), 6207–6217. https://doi.org/https://doi.org/10.1021/bi962813z
- Lu, W. D., & Atkins, W. M. (2004). A novel antioxidant role for ligandin behavior of glutathione S-transferases: Attenuation of the photodynamic effects of hypericin. Biochemistry, 43(40), 12761–12769. https://doi.org/https://doi.org/10.1021/bi049217m
- Ma, F. Y., Tesch, G. H., Flavell, R. A., Davis, R. J., & Nikolic-Paterson, D. J. (2007). MKK3-p38 signaling promotes apoptosis and the early inflammatory response in the obstructed mouse kidney. American Journal of Physiology. Renal Physiology, 293(5), F1556–F1563. https://doi.org/https://doi.org/10.1152/ajprenal.00010.2007
- Ma, F. Y., Tesch, G. H., & Nikolic-Paterson, D. J. (2014). ASK1/p38 signaling in renal tubular epithelial cells promotes renal fibrosis in the mouse obstructed kidney. American Journal of Physiology. Renal Physiology, 307(11), F1263–F1273. https://doi.org/https://doi.org/10.1152/ajprenal.00211.2014
- Mollica, L., Theret, I., Antoine, M., Perron-Sierra, F., Charton, Y., Fourquez, J. M., Wierzbicki, M., Boutin, J. A., Ferry, G., Decherchi, S., Bottegoni, G., Ducrot, P., & Cavalli, A. (2016). Molecular dynamics simulations and kinetic measurements to estimate and predict protein-ligand residence times. Journal of Medicinal Chemistry, 59(15), 7167–7176. https://doi.org/https://doi.org/10.1021/acs.jmedchem.6b00632
- Nebert, D. W., & Vasiliou, V. (2004). Analysis of the glutathione S-transferase (GST) gene family. Human Genomics, 1(6), 460–464. https://doi.org/https://doi.org/10.1186/1479-7364-1-6-460
- Oakley, A. J., Bello, M., Lo, Battistoni, A., Ricci, G., Rossjohn, J., Villar, H. O., & Parker, M. W. (1997). The structures of human glutathione transferase P1-1 in complex with glutathione and various inhibitors at high resolution. Journal of Molecular Biology, 274(1), 84–100. https://doi.org/https://doi.org/10.1006/jmbi.1997.1364
- Patskovsky, Y., Patskovska, L., Almo, S. C., & Listowsky, I. (2006). Transition state model and mechanism of nucleophilic aromatic substitution reactions catalyzed by human glutathione S-transferase M1a-1a. Biochemistry, 45(12), 3852–3862. https://doi.org/https://doi.org/10.1021/bi051823+
- Patskovsky, Y. V., Patskovska, L. N., & Listowsky, I. (2000). The enhanced affinity for thiolate anion and activation of enzyme-bound glutathione is governed by an arginine residue of human Mu class glutathione S-transferases. The Journal of Biological Chemistry, 275(5), 3296–3304. https://doi.org/https://doi.org/10.1074/jbc.275.5.3296
- Robertson, M. J.,Tirado-Rives, J., &Jorgensen, W. L. (2015). Improved Peptide and Protein Torsional Energetics with the OPLSAA Force Field. Journal of Chemical Theory and Computation, 11(7), 3499–3509. https://doi.org/10.1021/acs.jctc.5b00356 26190950
- Robin, S. K. D., Ansari, M., & Uppugunduri, C. R. S. (2020). Spectrophotometric Screening for Potential Inhibitors of Cytosolic Glutathione S-Transferases. Journal of Visualized Experiments, e61347.
- Rother, K. (2005). Methods in Molecular Biology (Clifton, N.J.), 635, 32.
- Sievers, F., Wilm, A., Dineen, D., Gibson, T. J., Karplus, K., Li, W., Lopez, R., McWilliam, H., Remmert, M., Soding, J., Thompson, J. D., & Higgins, D. G. (2011). Fast, scalable generation of high-quality protein multiple sequence alignments using Clustal Omega. Molecular Systems Biology, 7(1), 539–539. https://doi.org/https://doi.org/10.1038/msb.2011.75
- Tars, K., Larsson, A.-K., Shokeer, A., Olin, B., Mannervik, B., & Kleywegt, G. J. (2006). Structural basis of the suppressed catalytic activity of wild-type human glutathione transferase T1-1 compared to its W234R mutant. Journal of Molecular Biology, 355(1), 96–105. https://doi.org/https://doi.org/10.1016/j.jmb.2005.10.049
- Taslimi, P., Işık, M., Türkan, F., Durgun, M., Türkeş, C., Gülçin, İ., & Beydemir, Ş. (2020). Journal of Biomolecular Structure and Dynamics, 1–12.
- Temel, Y., Koçyigit, U. M., Taysı, M. Ş., Gökalp, F., Gürdere, M. B., Budak, Y., Ceylan, M., Gülçin, İ., & Çiftci, M. (2018). Purification of glutathione S-transferase enzyme from quail liver tissue and inhibition effects of (3aR,4S,7R,7aS)-2-(4-((E)-3-(aryl)acryloyl)phenyl)-3a,4,7,7a-tetrahydro-1H-4,7-methanoisoindole-1,3(2H)-dione derivatives on the enzyme activity. Journal of Biochemical and Molecular Toxicology, 32(3), e22034. https://doi.org/https://doi.org/10.1002/jbt.22034
- Tobiume, K., Matsuzawa, A., Takahashi, T., Nishitoh, H., Morita, K., Takeda, K., Minowa, O., Miyazono, K., Noda, T., & Ichijo, H. (2001). ASK1 is required for sustained activations of JNK/p38 MAP kinases and apoptosis. EMBO Reports, 2(3), 222–228. https://doi.org/https://doi.org/10.1093/embo-reports/kve046
- Türkan, F., Huyut, Z., Taslimi, P., Huyut, M. T., & Gülçin, İ. (2020). Investigation of the effects of cephalosporin antibiotics on glutathione S-transferase activity in different tissues of rats in vivo conditions in order to drug development research. Drug and Chemical Toxicology, 43(4), 423–428. https://doi.org/https://doi.org/10.1080/01480545.2018.1497644
- Uhlén, M., Fagerberg, L., Hallström, B. M., Lindskog, C., Oksvold, P., Mardinoglu, A., Sivertsson, Å., Kampf, C., Sjöstedt, E., Asplund, A., Olsson, I., Edlund, K., Lundberg, E., Navani, S., Szigyarto, C. A.-K., Odeberg, J., Djureinovic, D., Takanen, J. O., Hober, S., … Pontén, F. (2015). Proteomics. Tissue-based map of the human proteome. Science (New York, N.Y.), 347(6220), 1260419. https://doi.org/https://doi.org/10.1126/science.1260419
- Van Der Spoel, D., Lindahl, E., Hess, B., Groenhof, G., Mark, A. E., & Berendsen, H. J. C. (2005). GROMACS: Fast, flexible, and free. Journal of Computational Chemistry, 26(16), 1701–1718. [Database] https://doi.org/https://doi.org/10.1002/jcc.20291
- Wang, L., Groves, M. J., Hepburn, M. D., & Bowen, D. T. (2000). Glutathione S-transferase enzyme expression in hematopoietic cell lines implies a differential protective role for T1 and A1 isoenzymes in erythroid and for M1 in lymphoid lineages. Haematologica, 85(6), 573–579.
- Wu, Y., Fan, Y., Xue, B., Luo, L., Shen, J., Zhang, S., Jiang, Y., & Yin, Z. (2006). Human glutathione S-transferase P1-1 interacts with TRAF2 and regulates TRAF2-ASK1 signals. Oncogene, 25(42), 5787–5800. https://doi.org/https://doi.org/10.1038/sj.onc.1209576