
Abstract
Soil salinity and the resulting salt stress it imposes on crop plants is a major problem for modern agriculture. Understanding how salt tolerance mechanisms in plants are regulated is therefore important. One regulatory mechanism is the APETALA2/Ethylene Responsive Factor (AP2/ERF) transcription factor family, including dehydration responsive element binding (DREB) transcription factors. By binding to DNA, specifically upstream of genes that play roles in salt tolerance pathways, DREB proteins upregulate expression of these genes. DREB in Triticum aestivum (wheat) cluster in sub-groups and in this study by scanning the recently extended predicted proteome of wheat for DREB, we increased the number of members of this sub-family. Using the wheat genome, we identified 576 genes coding for the AP2 domain of which 508 were identified to have one AP2 domain, a characteristic of the DREB/ERF subfamily. We confirmed the existing four sub-groups by sequence-based phylogenetic analyses but also identified 32 new DREB subfamily members, not belonging to any known sub-group. Transcription factor profile inference analysis identified two genes, TraesCS2B02G002700 and TraesCS2D02G015200, being homologous to DREB1A of Arabidopsis thaliana. Based on molecular simulation (25 ns) analysis, TraesCS2B02G002700 with a CCGAC motif was observed to interact very stably with DNA. In silico mutational analysis at the 19th position in the DREB domain of TraesCS2B02G002700-DNA complex indicated this as a stable part for recognizing and forming interaction with DNA. Moreover, six target genes were predicted having an upstream CCGAC motif regulated by TraesCS2B02G002700. Our study provides an overall framework for exploring the transcription factors in plants and identifying e.g. potential salt stress target genes.
Communicated by Ramaswamy H. Sarma
Introduction
Soil salinity is a major problem for agriculture worldwide, and the danger it represents is rising due to the rapid growth of the world’s population (Deinlein et al., Citation2014). Plants under salt stress experience osmotic stress immediately after exposure, characterized by a decrease in water uptake because of a altered osmotic balance (Bohnert, Citation2007; Carillo et al., Citation2011). Under persistent high salt concentrations, a toxic level of Na+ ions accumulates in plant cells, inhibiting important metabolic enzymes and protein biosynthesis (Davenport et al., Citation2005; Tester & Davenport, Citation2003). Oxidative stress follows soon after, triggered by increased levels of reactive oxygen species and inhibition of scavenging mechanisms (Gill & Tuteja, Citation2010; Liang et al., Citation2018). These effects lead major decreases inplant yields or even the death of plants (Grattan et al., Citation2002).
The early mechanisms of response to different abiotic stresses at the molecular and cellular level include cascades of signaling reactions involving membrane permeability, phosphorylation by protein kinases and regulation of gene expression by transcription factors (Khan et al., Citation2018b). The APETALA2/Ethylene Responsive Factor (AP2/ERF) superfamily is a large group which is among the most important plant transcription factors, and members of the family are active during drought, salt, low temperature and pathogen stress. The AP2/ERF proteins share a conserved AP2 DNA-binding domain with a length of approximately 60 amino acids which binds to specific DNA motifs in gene promoter regions such as the GCC and dehydration-responsive elements (Magnani et al., Citation2004; Nakano et al., Citation2006; Töpel et al., Citation2017; Zhuang et al., Citation2011).
Based on the differences in the sequence of the conserved domain, the AP2/ERF superfamily is classified into four sub-families such as AP2 (APETALA2), RAV (related to ABI3/VP1), DREB (dehydration-responsive element binding protein), and ERF (ethylene-responsive factor). The RAV genes contain the AP2 and B3 domains, and the AP2 family members have multiple AP2 domains. The ERF and DREB subfamilies have one AP2 domain each and differ with respect to to certain amino acid residues; for example they have, respectively, Ala and Val at the 14th position in the amino acid sequence (Sakuma et al., Citation2002). Numbers of AP2/ERF genes reported in different plant species include 145 in Arabidopsis thaliana (Arabidopsis) (Sakuma et al., Citation2002), 121 in Hordeum vulgare (barley) (Guo et al., Citation2016), 146 in Solanum lycopersicon (tomato) (Pirrello et al., Citation2012), 167 in Oryza sativa (rice) (Sharoni et al., Citation2011), 119 in Actinidia deliciosa (kiwifruit) (Zhang et al., Citation2016), 132 in Sesamum indicum L. (Sesame) (Dossa et al., Citation2016), and 119 in Ziziphus jujube Mill. (Chinese jujube) (Zhang & Li, Citation2018). The AP2 superfamily proteins are well known to play important roles in regulating flowering time and organ development (Jofuku et al., Citation1994), biotic and abiotic stress responses (Feng et al., Citation2014), plant hormone metabolism (Liu et al., Citation2014) and the regulation of fruit quality (Xie et al., Citation2016).
Mutatations in the AP2 transcription factor of the DREB1/C-repeat binding factor (CBF) subfamily that is encoded by the salinity-responsive dwarf and delayed-flowering1 (ddf1) gene of Arabidopsis result in increased tolerance to high salinity stress (Magome et al., Citation2004). DREB1A/CBF is also reported to regulate drought, cold, and salt stress responsive genes in Arabidopsis (Yamaguchi-Shinozaki & Shinozaki, Citation1994). Binding preference analysis of DREB1A and DREB2A has revealed that they possess high affinity for the dehydration responsive element (DRE) core motif (A/GCCGAC) (Sakuma et al., Citation2002). The DREB1A gene from Phaseolus vulgaris (common bean) was reported to bind preferentially to the GCC stretches in the double helical DNA structure when docking studies were carried out (Vatansever et al., Citation2017).
The recent release of a high-quality wheat genome (Chinese Spring) assembly by the International Wheat Genome Sequencing Consortium (IWGSC RefSeq v1.0, (Appels et al., Citation2018)) has enabled to carry out this study to analyze the expansion of the AP2/ERF superfamily in the wheat genome. In the current study, we identified 576 AP2/ERF genes in the three subgenomes A, B and D of wheat. Phylogenetic analysis and principal component analysis (PCA) were used to cluster these genes. Homology modeling and DNA docking analysis was performed for two of the DREB proteins which were identified based on profile inference analysis.
Material and methods
Search for DREB transcription factor sequences
The Hidden Markov Model (HMM) file for the AP2 domain (PF00847) was downloaded from the protein family (PFAM) database (Pfam version 32.0) (El-Gebali et al., Citation2018). The proteome of the recently published Triticum aestivum (wheat) genome (Appels et al., Citation2018) was downloaded from the Ensembl plants database (http://ftp://ftp.ensemblgenomes.org/pub/plants/release-41/fasta/triticum_aestivum/pep/). The HMM profile was used as a query to scan across the wheat proteome using HMMER software (version 3.1) (Eddy, Citation2011) with the default E-value. The resulting protein sequences of the result were obtained from the proteome file using an in-house python script and were used for batch searching in Pfam to confirm the existence of the AP2 domain. Redundant protein sequences were identified using Cd-hit (http://weizhong-lab.ucsd.edu/cdhit-web-server/cgi-bin/index.cgi?cmd=cd-hit) (Li & Godzik, Citation2006) and representative sequences with one AP2 domain were used for further analysis.
Phylogenetic analysis of DREB and ERF sequences
DREB and ERF sequences were subjected tomultiple alignment using a Fast fourier transform (MAFFT) server (Katoh et al., Citation2017) and the HMMAlign module in HMMER against the AP2 HMM profile. The alignment was performed separately for DREB and ERF and also for both subfamilies together. The aligned sequences were used to build a phylogenetic tree with the MEGA7 software package (Kumar et al., Citation2016). Before the tree construction, the best model for maximum-likelihood analysis was determined using MEGA, which identified LG + Gamma distributed with invariant sites as the best model. A bootstrap of 100 replicates was used for building the tree. The phylogenetic tree, which was constructed for the representative sequences from the total set of DREB sequences identified from the profile search. The sequences were assigned to different groups and sub-groups based on previous studies (Sakuma et al., Citation2002).
Principal component analysis (PCA) of DREB and ERF sequences
The software package peptides (Osorio et al., Citation2015) in R software was used to calculate amino acid descriptors for the 20 amino acids in the AP2 domain sequences (DREB and ERF) used in this study. PCA was used to extract the most relevant and useful features from the high dimensional feature vectors (4555 features) generated by peptides. PCA was applied as a statistical technique to reduce multidimensionality and to derive patterns in the dataset. For this analysis, the data input to PCA was organized in a matrix denoted X, with N and K dimensions, where N represented the number of sequences (observations) and K represented the number of features (variables). In PCA, the principal components, i.e. the K-dimensional spaces along which the variance of the data set was greatest, were determined. The orientation of the model plane in the K-dimensional variable space was set by the loadings, quantifying the contribution made by each of the original variables to the principal components. The principal components were the eigenvectors of the covariance matrix of the data matrix X and were thus orthogonal. The largest eigenvalues corresponded to the dimension that explained the greatest variation in the dataset.
DREB/ERF binding profile analysis
The AP2 domain sequences of both DREB and ERF were searched in order to predict their DNA-binding profiles using the Profile Inference tool available in the JASPAR database (Khan et al. 2018a). An in-house script was written for performing batch analysis of of the transcription factors (https://github.com/Sameerpython/Transcription-Factors).
Homology modeling, docking and molecular simulation
Homology modeling was performed for eight DREB proteins identified as having different substitutions in the 19th amino acid position, and the DREB sequences of TraesCS2B02G002700 and TraesCS2D02G015200 were identified based on profile inference analysis. For multiple sequences with the same substitution in the 19th amino acid position, a consensus sequence was generated using the Consensus Maker tool (https://www.hiv.lanl.gov/content/sequence/CONSENSUS/consensus.html). Each of the consensus sequences generated (with eight different amino acid substitutions at position 19) was then searched against the Protein Data Bank (PDB) database using BLAST. The identified homologous template structure identified based on PFAM domain and sequence identity was used to generate models for the eight protein consensus sequences of DREB proteins using MODELLER (Webb & Sali, Citation2016). The model with the best probability density function (PDF) score was selected as the final model for each of the consensus sequences. The model generated was evaluated using a Ramachandran plot and by superimposing it against the template structure.
Docking of the TraesCS2B02G002700 and TraesCS2D02G015200 with DNA was performed on the HDOCK server (Yan et al., Citation2017). This server uses a hybrid algorithm consisting of template-based modeling (TM) and free docking and can run the docking process rapidly and accurately. The best model of the DNA sequence (motif identified based on profile inference analysis) generated using the 3DNA-Driven DNA Analysis and Rebuilding Tool (3 D-DART) (van Dijk & Bonvin, Citation2009) and the model structures for TraesCS2B02G002700 and TraesCS2D02G015200 were analyzed using the HDOCK server. The best protein–DNA complex generated by HDOCK was used for further analysis. To study stability of protein-DNA complexes we used the mCSN-NA server (Pires et al., Citation2014).
Each of the final models for the eight DREB proteins and DREB–DNA complexes was subjected for molecular simulation by the Assisted Model Building with Energy Refinement (AMBER) 16 suite of programs (Salomon‐Ferrer et al., Citation2013) using ff14SB forcefield (Maier et al., Citation2015). The AMBER DNA forcefield leaprc.DNA.bsc1 was employed for DNA. The topology and parameter files were generated using the tLEAP program (Case et al., Citation2005). Each system was then neutralized using Na+/Cl- ions. Each of the resulting systems was surrounded by a rectangular periodic box of transferable intermolecular potential with 3 points (TIP3P) water molecules with a margin of 12 Å. Each of the systems was initially subjected to 1500 steps of steepest-descent and 1000 steps of conjugate gradient energy minimization for the solvent and entire system respectively. The system was then heated to 300 K gradually over 200 ps using NVT (constant volume and normal temperature) conditions, then simulation was carried out under NPT (constant pressure and normal temperature) conditions at 1 atm pressure for another 200 ps. Finally, molecular simulation was performed for 25 ns at 1 atm and 300 K under NPT ensemble with a time step of 2 fs. The temperature was controlled using Langevin dynamics and simulations were run using periodic boundary conditions. The CPPTRAJ module of the AMBER package was used for analyze the trajectory files generated from simulations (Roe & Cheatham, Citation2013).
Analysis of promoter sequence
Approximately 2 kb of upstream promoter sequences of all genes in the Chinese Spring wheat genome were retrieved from the Ensembl plants database. The BEDtools getfasta option was used for the extraction of the upstream regions (Quinlan & Hall, Citation2010). The position weight matrix (PWM) of the selected DNA motif was downloaded in MEME format from JASPAR (Khan et al. 2018a) and ATHMAP (Hehl & Bulow, Citation2014) database. The extracted 2 kb sequences were then scanned with a P value of < 1e-5 using Find Individual Motif Occurrences (FIMO) version 5.0.4 (Grant et al., Citation2011) available at the MEME Suite server (http://meme-suite.org/index.html; (Bailey et al., Citation2015)) to identify DREB1A binding motifs in the upstream promoter sequences of the wheat genes.
Results and discussion
Identification of DREB and ERF transcription factors in wheat
The AP2/ERF gene producs belong to a superfamily of plant-specific transcription factors that are characterized by the presence of an AP2 domain (Okamuro et al., Citation1997). This 60 amino acid long AP2 domain is also called the GCC–box binding domain (GBD) because of its specific binding to the GCC-box (Allen et al., Citation1998). In order to identify the AP2 domain family, the HMM for the AP2 domain (PF00847) was retrieved from the Pfam database and searched against the proteome sequences of the most recently sequenced wheat genome (IWGSC (Appels et al., Citation2018)). The search resulted in the identification of 576 AP2 domain coding genes with 616 transcript variants. Subsequently, to verify the reliability of the search results, the sequences were searched for the conserved AP2 domain using the Pfam database. The analysis resulted in sequences with five different combination of domains in the 616 transcript variants: two copies of AP2, AP2 + B3, AP2 + NB-ARC + Rx_N, and AP2 + SNF2_N (). Previous studies reported the presence of 121, 147, 164, 210 and 171 DREB/ERF genes in barley, Arabidopsis, rice, Zea mays L. (maize) and Setaria italica L. (foxtail millet) respectively (Guo et al., Citation2016). Out of the 616 transcript variants identified, 528 (from 508 coding genes) were observed to have a single AP2 domain. The number of DREB/ERF genes identified in wheat is much higher than those in barley, Arabidopsis, rice, maize, millet (Guo et al., Citation2016) and sesame (Dossa et al., Citation2016), Earlier studies reported 117 putative genes of the AP2/ERF family in wheat (Zhuang et al., Citation2011). The ERF family consists of two subfamilies, ERF and DREB, which play parts in many developmental and stress response processes (Shu et al., Citation2015). The ERF subfamily members bind to GCC boxes that are in involved in hormone signaling pathways being important for plant development. The DREB subfamily bind to the dehydration-responsive elements/C-repeat elements and improve the stress tolerance of plants under different stress conditions such as cold, salt and drought (Shu et al., Citation2015; Xu et al., Citation2011). The two characteristic differences between ERF and DREB are the presence of an Ala at amino acid position 14, and Asp at amino acid position 19, in the AP2 domain of ERF whereas in DREB the amino acids at these positins are replaced by Val and Leu respectively (Nakano et al., Citation2006). However, previous studies have reported the presence of Gln instead of Leu at amino acid position 19 in the DREB subfamily in maize and rice (Rashid et al., Citation2012; Zhang & Li, Citation2018), and also Glu in malus (Zhao et al., Citation2012), and Asp in V. vinifera L (table grapes) (Vazquez-Hernandez et al., Citation2017) at the same position.
Figure 1. Domain organization of DREB genes in the wheat genome. (A) The four combinations in which the AP2 domain appears. B3: DNA binding domain (PF02362), NB_ARC: NB-ARC domain (PF00931), Rx_N: Rx N-terminal domain (PF18052), and SNF2_N: SNF2 family N-terminal domain (PF00176). (B) Sequence logo for the 123 DREB transcription factors identified in the wheat genome.
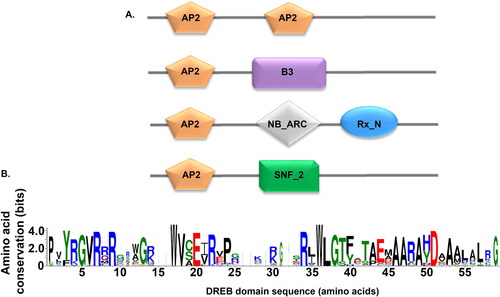
As the focus of the current study is on salt stress and the involvement of DREB in biotic stress responses, sequences with a single AP2 domain, a characteristic of the DREB/ERF subfamily, were retained and sequences with more than one AP2 domain were excluded from subsequent analysis. Further to reduce the size of the dataset, given the presence of many homoeologous genes in the hexaploid wheat genome, we removed AP2 domain sequences that shared 100% sequence identity, thus resulting in 294 sequences including members of both the DREB and the ERF subfamily. Categorizing these 294 sequences based on the residue at the14th amino acid position, we identified 123 DREB sequences and 134 ERF sequences but also sequences with Glu (5), Gly (19), Ser (8), Arg (2), Tyr (1) and Gln (1). Among the DREB sequences (123), at the 19th position, in addition to Glu (41 sequences) and Gln (5 sequences), sequences with Asp (6), Ala (4), His (7), Leu (9), Met (3) and Val (47) were observed. Earlier studies based on gel mobility shift assays have reported that both Glu and Val residues at the 19th amino acid position, especially Val, have important roles in DNA-binding specificity (Sakuma et al., Citation2002). From our analysis, the 14th position is highly conserved whereas the 19th position can have eight different substitutions. These differences indicate that the amino acid at the 19th amino acid is not as critical for the recognition of the DNA–binding motif as the amino acid at position 14, where Val is present. In addition, it has previously been reported that the amino acid substitution of Glu with Asp at amino acid position 19with had no major effect on DNA binding (Sakuma et al., Citation2002).
Phylogenetic and PCA analysis of DREB
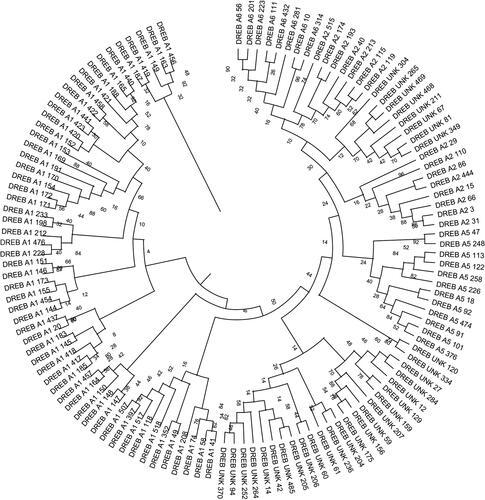
To determine the evolutionary relationships between the DREB sequences, a phylogenetic tree was constructed using the 123 DREB protein sequences identified in this study. The sequence alignment of these DREB proteins demonstrates that they share significant similarities as the amino acid residues at 12 different amino acid positions (Gly at position 5, Arg at position 7, Arg at position 9, Trp at position 17, Val at position 18, Glu at position 20, Arg at position 34, Trp at position 36, Leu at position 37, Gly at position 38, Ala at position 46, Asp at position 51, and Gly at position 59) were observed to be highly conserved (). The tree confirms the classification of DREB sequences into four groups as reported by earlier studies (Sakuma et al., Citation2002), as it showed clear clustering of sequences into group A1 (56 sequences), group A2 (15 sequences), group A5 (12 sequences), and group A6 (8 sequences). However, 32 sequences remained unclassified into any of these groups ().
Figure 2. Phylogenetic analysis of DREB protein sequences from the wheat genome. The evolutionary history of 123 wheat DREB sequences was inferred using the maximum-likelihood statistical method. A bootstrap of 100 replicates was used to infer the evolutionary history of the DREB sequences.
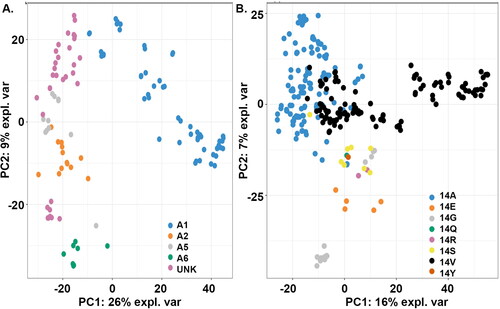
We wanted to determine which position(s) in the protein sequences are responsible for grouping the DREB family into sub-clusters. We therefore applied PCA to reduce the dimensionality by projecting data into an eigen space that represented the direction of the greatest variation (Wang & Kennedy, Citation2014). In this analysis, the physicochemical properties of each amino acid position defined a variable for PCA. The results depicted a clear clustering of the sequences of each of the four groups (). The relationship among the individual sequences in the PCA plot was similar to that of the relationship observed through phylogenetic analysis. The 32 sequences belonging to the unknown group formed two separate clusters (). Similarly, PCA analysis was performed for all 294 sequences, inlcuding both DREB and ERF, grouping them based on the amino acid present at amino acid position 14 (Ala, Glu, Gly, Gln, Arg, Ser, Val and Tyr). The analysis of the eight groups of the AP2 domain superfamily resulted in the separation of each group as a different clusters (). Although separate clusters were observed there was still some overlapping of sequences between groups. It is clear that some of the sequences with Ala and Val at amino acid position 14 (ERF and DREB respectively) overlap (), thus indicating that these proteins in the two groups are very similar despite the difference in amino acid residue at this position.
Figure 3. Principal component analysis of DREB proteins. (A) Clustering of DREB proteins based on group classification. (B) Clustering of DREB proteins based on amino acid substitutions observed at amino acid position 14 in the protein sequence. The amount of variance for the two principal components PC1 and PC2 are shown in percentage at the x-axis and y-axis respectively.
Structure based analysis of DREB and ERF transcription factors
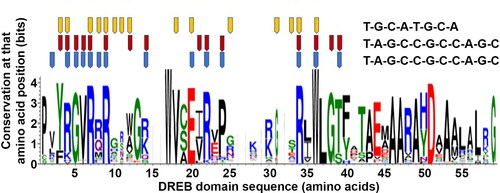
We identified five crystal structures for ERF transcription factors (PDB codes 1GCC, 2GCC, 3GCC, 3IGM and 5WX9) of which four were from Arabidopsis and one (3IGM) from Plasmodium falciparum. All five structures belonged to the ERF transcription factor subfamily; no crystal structures for the DREB subfamily were identified in the PDB database. Of the five structures, three (1GCC, 3IGM, 5WX9) were available as transcription factor-DNA bound complexes; that for 1GCC was based on NMR and the other two were crystallographically determined structures. Comparing the sequences of these three structures against our dataset, both 1GCC (ERF1A) and 5WX9 (ERF096) from Arabidopsis shared similarity but 3IGM from P. falciparum shared no sequence homology to any of the DREB sequences. Though three of the structures (5WX9/1GCC and 3IGM) have the same ERF domain, 3IGM has no structural similarity to that of Arabidopsis ERF proteins; it has three beta strands and an alpha helix compared to the two beta strands and one alpha helix of 5WX9. To study further the binding residues in the DNA-binding domains of the ERF transcription factors, we mapped the binding sites of the three structures based on the Pfam profiles onto the sequence logo for the 123 DREB sequences. The numbers of amino acids involved in binding to DNA for 1GCC, 5WX9 and 3IGM are 15, 14 and 15 respectively. Comparing the interactions of the crystal structures with DNA, 11 common interactions between 5WX9/1GCC, and seven common interactions between 5WX9/3IGM and 1GCC/3IGM, were observed. Among the total number of interacting residues for the three structures, five of them were identified as interacting in all the three (). The residues at amino acid positions 7, 9 and 36 are highly conserved among all the sequences, thus suggesting the importance of these amino acids for DNA binding. However, the interacting amino acids that vary among these structures may contribute towards the specificity of the transcription factors binding to different DNA sequences.
Figure 4. Sequence profile of the DREB proteins 3IGM, 1GCC and 5WX9 generated using WebLogo. The DNA binding amino acids are mapped onto the profile and are marked as pentagons in orange (3IGM), red (1GCC) and blue (5WX9). The corresponding bound DNA sequence is shown to the right. Bits, conservation at that amino acid position.
Modeling and simulation of DREB transcription factors with substitutions at the 19th amino acid position
The large number of crystal structures for different sequences from different organisms available in PDB helps in understanding the types of folds these proteins have adopted through evolution, and also the conservation of structure at different levels of sequence identity. However, there is a large gap between the number of sequences available and the number of structures that are determined using X-ray crystallography or NMR spectroscopy. In silico modeling is a method that can be used to predict the three-dimensional (3D) structure of a protein in the absence of any experimentally determined structure.
In this stuy, as the 3D structure for the DREB subfamily has not been determined and also to further understand how the substitution of amino acids at position 19 in DREB affects the structure of the proteins or their binding to DNA, we predicted models for the DREB protein with different substitutions as observed from the sequences analyzed in this study. As there was more than one sequence in each of the eight groups, we generated a consensus sequence for the sequences in each of these groups and its 3D structure was then predicted (). BLAST searches of these consensus sequences against the PDB database identified the PDB code 5WX9, a crystal structure of Arabidopsis ERF96 with a GCC-box, as the closest homolog (sequence identity 48%) to wheat DREB proteins. Several models were developed for each of the consensus sequences for the eight groups using the MODELLER software. The best model with the lowest modeler potential function was selected for further analysis (). It can be seen that most of the model structures had two beta strands and one alpha helix (). The quality of the models was analyzed using a Ramachandran plot. All the models had more than 95% of residues in the most favored region of the Ramachandran plot (data not shown). The model structures with Glu and Met at the 19th position each had one amino acid in the outlier region of the Ramachandran plot (data not shown).
Figure 5. (A) Predicted model structures for the eight DREB consensus sequences identified with Ala, Asp, Glu, His, Leu, Met, Gln and Val substitutions at amino acid position 19. B) Secondary structure arrangement for the eight DREB sequences.
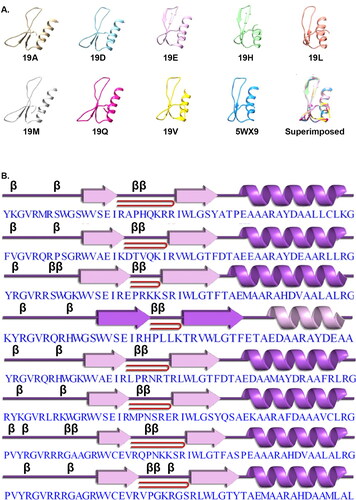
Table 1. Sequence identity comparison between the consensus sequences generated for DREB proteins having eight different amino acid substitutions at position 19. 5WX9 is the PDB code for the crystal structure of an ERF protein from Arabidopsis.
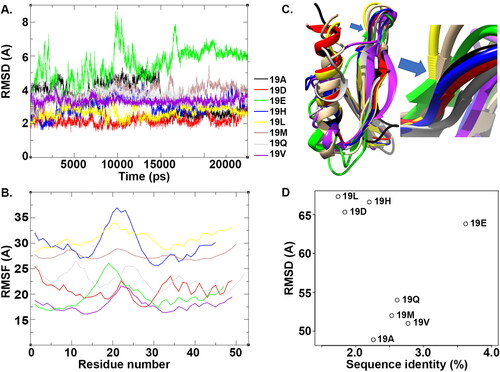
We performed molecular dynamics simulation to further understand the conformational differences between the DREB proteins with eight different substitutions at amino acid position 14. All the structures converged at the end of 25 ns of simulations (). Among the eight proteins, structures with Asp, Leu, Gln and Val substitutions were observed to show less deviation throughout the simulation. The structure with Glu substitution underwent substantial conformational changes during simulation. The eight structures stabilized after 17.5 ns (). Analyzing residue fluctuation in these structures, residues between 15 and 30 were seen to be highly fluctuating (). However, for all structures except for that one with Gln substitutions, the N terminal showed very little fluctuation. The structure with Met substitution had the least fluctuation along the whole length of the protein compared to the rest of the structures. We generated the average structures for the eight models from their respective trajectories between 17.5 ns and 25 ns. The average structures were then superimposed in order to observe the conformational differences (). It is obvious from post simulation analysis that these structures have different conformations in the loop regions and in the helix secondary structure that is present in the C-terminal region. Superimposing each of these structures against the template structure 5WX9, the RMSD was observed as follows: 19Leu (1.74 Å) < 19Asp (1.84 Å) < 19His (2.20 Å) < 19Ala (2.26 Å) < 19Met (2.53 Å) < 19Gln (2.61 Å) < 19Val (2.77 Å) < 19Glu (3.62 Å). Among these structures, substitutions with Leu, His and Asp have identity greater than 65% and structural deviation was observed to be less than 2.5 Å against the 5WX9 template structure. The remaining structures with Ala, Gln, Met and Val as substitutions, have identity between 45% and 55% and their RMSD against 5WX9 was between 2 Å and 3 Å (). Though 19E has a high sequence identity with 5WX9, the structural deviation was observed to be very high after simulation (). This confirms that despite of high sequence identity, amino acid substitutions within the protein sequence can result in considerable structural deviation.
Figure 6. Simulation of DREB proteins. (A) The RMSD plot of C alpha atoms of the DREB protein with eight different substitutions at position 19 for 25 ns of simulation. (B) Residue fluctuation analysis of DREB proteins. (C) Structural superimposition of the structures of DREB proteins post simulation. The inset shows the amino acid position 19 of the structure displayed as the edge. (D) Scatter plot of the structures using sequence identity (X-axis) and RMSD (Y-axis) calculated against the template structure 5WX9.
Mapping of DNA binding site profile for DREB and ERF transcription factors
Transcription factors regulate gene expression by binding to specific regions in the cis–regulatory elements in the DNA. Identification of transcription factors binding sites and annotating each of these sites with its respective transcription factors is therefore an essential step towards understanding the regulatory networks for biological process such as salt stress responses. There still exist many transcription factors that so far have no experimentally determined binding motifs. The only option in such scenarios is to predict transcription factor binding motifs based on protein sequences. Transcription factors that have identical DNA binding properties may have position weight matrices (PWM) that are derived from different organisms assigned to them (Bernard et al., Citation2012; Mathelier et al., Citation2016; Wingender et al., Citation2001).
For the current dataset of DREB and ERF transcription factors, we mapped the PWM based on homology using the Profile Inference tool in the JASPAR database. Among the 123 DREB transcription factors, the tool assigned PWMs for 19 DREB transcription factors based on homologous transcription factors. However, of these 19 DREB transcription factors sequences, all but two showed similarity to ERF transcription factors. This is expected as the sequences of both the subfamilies are very similar. Even though DREB and ERF are closely related to each other, their target DNA binding sites can be different (Sun et al., Citation2008). ERF proteins bind to the GCC box (AGCCGCC) where the G2, G5 and C7 (underlined) are essential for the binding (Buttner & Singh, Citation1997; Fujimoto et al., Citation2000; Hao et al., Citation1998; Citation2002; Ohme-Takagi & Shinshi, Citation1995; Zhou et al., Citation1997). It is the sequence CCGAC within the DNA motif TACCGACAT (dehydration response element (DRE)) that is recognized by the DREB subfamily (Stockinger et al., Citation1997; Yamaguchi-Shinozaki & Shinozaki, Citation1994), and C4, G5 and C7 (underlined) are essential for specific interaction (Hao et al., Citation2002; Sakuma et al., Citation2002). In our profile inference analysis for DREB transcription factors, we were able to assign the DREB1A PWM to two wheat DREB transcription factors sequences, TraesCS2B02G002700 and TraesCS2D02G015200. The two DREB proteins encoded by these sequences share a sequence identity of 87%.
As the profile inference analysis identified ERF transcription factors, we performed a profile analysis for the 134 members of the ERF transcription factor subfamily and identified 45 of them that shared similarity to transcription factors in the JASPAR database. These 45 ERF transcription factors are predicted to bind to 14 different PWMs ().
Molecular modeling and docking of TraesCS2B02G002700 and TraesCS2D02G015200
Many of the essential biological processes such as DNA replication, transcription, splicing and repair involve the interaction between proteins and DNA. Though PDB contains a large number of experimentally determined structures or complexes, only a few thousand protein–DNA complex structures are available. This is a very small number compared to the number of protein–DNA interactions that occur in a cell (Si et al., Citation2015). The identification of amino acids involved in the interaction with DNA is important in understanding the mechanisms of biological activities (Si et al., Citation2015). Several of the experimental techniques that are available to study protein–DNA interactions are time-consuming and expensive. Computational methods are ideal ways of providing theoretical information about protein–DNA interactions that can later be validated using experimental methods. Several studies on the interaction between transcription factors and DNA have been carried out using docking and molecular simulation analysis (Konda et al., Citation2018; Mukherjee et al., Citation2015; Pandey et al., Citation2016; Citation2018; Pradeepkiran et al., Citation2015; Zhu et al., Citation2014).
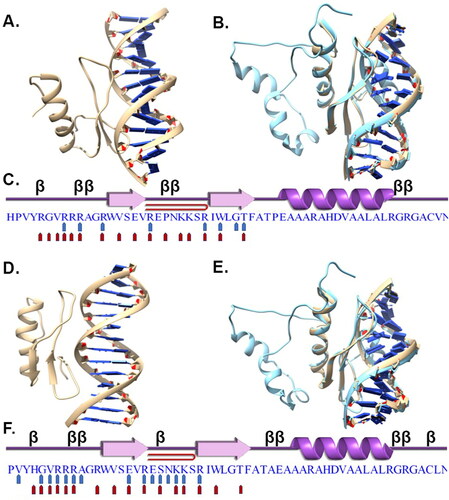
The 3D structures of TraesCS2B02G002700 and TraesCS2D02G015200 were predicted as described earlier. The predicted model structures of the two transcription factors were docked with DNA containing the GCC-box and CCGAC motifs in order to understand the putative binding amino acids in these two transcription factors. The 3D structure of DNA with the CCGAC motif (motif 1: TACTACCGACATGA) downloaded from ATHMAP was predicted using the 3DART server, whereas the structure of DNA with the GCC box (motif 2) was retrieved from the crystal structure of ATERF096 bound to the GCC box (PDB code 5WX9). The docking of the two transcription factors and the DNA motifs was performed using the Nucleic acid–Protein docking server (NP-dock). Before docking the test proteins, the DNA and protein from 5WX9 were redocked using NP-dock to validate the efficiency of regenerating the binding of the crystal structure. The top ranked predicted docked structure was very similar to the crystallographically determined complex. The top predicted pose for TraesCS2B02G002700 with motif 1 () and motif 2 () and that for TraesCS2D02G015200 with motif 1 () and motif 2 () was determined based on the best score. Comparing the binding of the two transcription factors with the two different motifs, it is obvious that the binding poses of the proteins with these motifs are very different. The DNA binding residues in the two transcription factor proteins were compared with the crystal structure of the Arabidopsis ERF protein, PDB code: 5WX9 (). The structural superimposition of the docked complexes of TraesCS2B02G002700 and TraesCS2D02G015200 with motif 1 over 5WX9 reveals that both structures have a similar binding conformation to the ATERF096 crystal structure complex (). For both transcription factors, the binding was observed to be in the major groove of the DNA structures ().
Figure 7. DREB protein and DNA binding interactions. Interaction of the DREB protein TraesCS2B02G002700 with motif 1 (A) and motif 2 (B). (C) Binding site interaction for motif 1 and 2 mapped on to the sequence of TraesCS2B02G002700. Interaction of TraesCS2D02G015200 with motif 1 (D) and motif 2 (E). (F) The amino acids of TraesCS2D02G015200 that interact with motif 1 and 2 are mapped as pentagons. The structure in blue is the 5WX9 structure superimposed on to the docked structure of TraesCS2B02G002700 and TraesCS2D02G015200 (B and E).
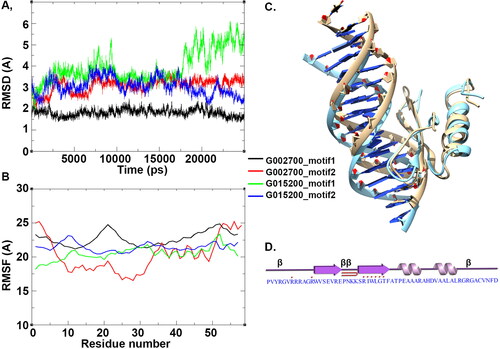
To further examine the stability of the protein-DNA complexes, the structures were subjected for molecular dynamics simulation for 25 ns. The overall stability of the two proteins (TraesCS2B02G002700 and TraesCS2D02G015200) in complex with the two different DNA motif structures (motif 1 and 2) was measured by estimating the RMSD profile (). The RMSD deviation for TraesCS2D02G015200 in complex with motif 1 was observed to be higher as compared to that of the same structure in complex with motif 2 and TraesCS2B02G002700 bound complexes (). However, all the structures had attained stability after 15 ns of simulation with exception of TraesCS2D02G015200 bound to motif 1. Among the four complexes, the protein TraesCS2B02G002700 in complex with motif 1 was seen to have a much more stable structure with low RMSD values throughout the simulation process compared to the other three structures. This indicates that TraesCS2B02G002700 has a stronger binding affinity with motif 1 than for motif 2. However, upon visual inspection of the simulation trajectories for the four complexes, it was observed that except for TraesCS2B02G002700 in complex with motif 1, the protein-DNA complex fell apart during the 25 ns of simulation. From this it can be inferred that TraesCS2B02G002700 has a stable and specific interaction with DNA motif 1. The dynamics of the amino acids for the four structural complexes were determined in terms of RMSF values. The maximum fluctuations were observed at positions10–30 within the structures (). The average structure for TraesCS2B02G002700 in complex with motif 1 generated using trajectories from 15 ns to 25 ns superimposed well with initial structure (). Post simulation, eight residues were observed to interact with DNA motif thus further justifying the possible interaction of TraesCS2B02G002700 with motif 1 having the CCGAC motif (). To further study the impact of the seven different substitutions observed in the 19th position of the DREB family, we analyzed the stability of the protein-DNA complex using the mCSN-NA server (Pires et al., Citation2014). Thus, Glu in the 19th position of TraesCS2B02G002700 was substituted to respective amino acids. Based on the analysis, all substitutions had a positive stabilizing effect (E19V, ΔΔG 0.29 kcal/mol; E19L, ΔΔG 0.322 kcal/mol: E19H, ΔΔG 0.727 kcal/mol; E19A, ΔΔG 0.225 kcal/mol; E19M, ΔΔG 2.334 kcal/mol; E19Q, ΔΔG 0.051 kcal/mol) on the protein-DNA complex except for the E19D substitution (ΔΔG −0.71 kcal/mol). These substitutions do not destabilize the protein-DNA interaction, but favor DREB proteins to interact with different DNA motifs to drive the expression of other target proteins in the wheat genome.
Figure 8. Simulation of DREB proteins. (A) The RMSD plot of C alpha atoms of TraesCS2B02G002700 and TraesCS2D02G015200 proteins in complex with motif 1 and 2. (B) Residue fluctuation analysis of DREB–DNA complexes. (C) Structural superimposition of the structure of TraesCS2B02G002700 in complex with motif 1 post simulation with its initial structure. (D) The DNA binding residues are marked with red dots above the sequence.
Genes expressed during salt stress
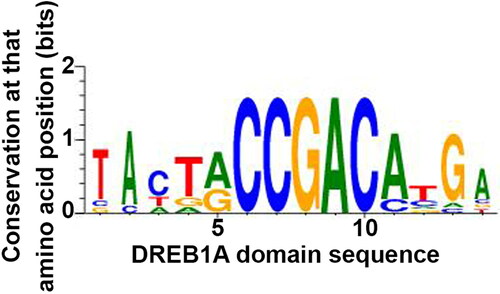
Under abiotic stress such as salinity, plants respond in a complex fashion that involves the interaction of many functional and regulatory genes, metabolic and signaling pathways (Apse & Blumwald, Citation2002; Ashraf, Citation2009; Zhu, Citation2001). Regulation of gene expression via transcription factors is an important mechanism in plants by which they adapt to salinity stress (Jamil et al., Citation2011). There are a large number of studies on salinity tolerance in wheat (Huang et al., Citation2012; Yousfi et al., Citation2016), rice (Kurotani et al., Citation2015; Singh et al., Citation2018) and Arabidopsis (Attia et al., Citation2011; Omidbakhshfard et al., Citation2012) that have reported many genes as being differentially expressed during salt stress. One of the objectives of our study was to identify target genes regulated by TraesCS2B02G002700. To do so we scanned the −2000 bp upstream region of 107896 high confidence genes from the recently sequenced wheat genome with motif 1. The PWM of motif 1 was downloaded from the ATHMAP database (A-DREB1A). The WebLogo of the motif shows the base frequency at each of the positions in the DNA sequence (). Based on our analysis, 3626 occurrences of the A-DREB1A motif in the whole genome were identified and from these the most significant ones were identified in the upstream region of 2930 genes.
Figure 9. Sequence profile of the DREB1A DNA motif identified from the ATHMAP database.
We compiled from publications a list of 146 genes that are expressed under salt stress in rice, wheat and Arabidopsis. The genes from rice and Arabidopsis were then used to look for homologs in the wheat genome with the BLAST program. The 146 genes thus obtained were then searched for among the 2930 genes predicted as being DREB1A regulated. We identified six target genes for A-DREB1A motifs from the total list of 146 genes ().
Table 2. Prediction of six target genes, expressed in wheat during salt stress, that have the A-DREB1A DNA motif in the upstream region.
Conclusion
We identified an additional 32 new members of the DREB transcription factor subfamily. New clustering of DREB transcription factors was confirmed by a physiochemical characteristic based analysis using a principal component analysis (PCA). Analysis of the DNA binding revealed a positive correlation between highly conserved residues through all sub-groups of DREB transcription factors and a probability of specific DNA binding residues. The CCGAC motif was observed to have a very stable interaction with DNA. Furthermore, we identified six salt stress related target genes by scanning the upstream region of wheat genes having the CCGAC motif, thus predicting these genes to be regulated by DREB proteins.
Acknowledgement
The authors would like to thank Steven Chan for assisting with the list of salt-tolerant wheat genes.
Author contribution
Conceived and designed the experiments: SH, HA. Performed the experiments: SH, KB. Analyzed the data: SH, KB, HA. Wrote the paper: SH, KB, HA.
Supporting_Table_S1.pdf
Download PDF (14.5 KB)Disclosure statement
No potential conflict of interest was reported by the authors.
Data availability statement
The data that support the findings of this study are available from the corresponding author upon reasonable request.
Additional information
Funding
References
- Allen, M. D., Yamasaki, K., Ohme-Takagi, M., Tateno, M., & Suzuki, M. (1998). A novel mode of DNA recognition by a beta-sheet revealed by the solution structure of the GCC-box binding domain in complex with DNA. The EMBO Journal, 17(18), 5484–5496.https://doi.org/10.1093/emboj/17.18.5484
- Appels, R., Eversole, K., Feuillet, C., Keller, B., Rogers, J., Stein, N., Pozniak, C. J., Choulet, F., Distelfeld, A., & Poland, J. J. S. (2018). Shifting the limits in wheat research and breeding using a fully annotated reference genome. Science, 361, eaar7191.
- Apse, M. P., & Blumwald, E. (2002). Engineering salt tolerance in plants. Current Opinion in Biotechnology, 13(2), 146–150. https://doi.org/10.1016/s0958-1669(02)00298-7
- Ashraf, M. (2009). Biotechnological approach of improving plant salt tolerance using antioxidants as markers. Biotechnology Advances, 27(1), 84–93.https://doi.org/10.1016/j.biotechadv.2008.09.003
- Attia, H., Karray, N., Msilini, N., & Lachaâl, M. J. B. P. (2011). Effect of salt stress on gene expression of superoxide dismutases and copper chaperone in Arabidopsis thaliana. Biologia Plantarum, 55(1), 159–163. https://doi.org/10.1007/s10535-011-0022-x
- Bailey, T. L., Johnson, J., Grant, C. E., & Noble, W. S. (2015). The MEME Suite. Nucleic Acids Research, 43(W1), W39–49.https://doi.org/10.1093/nar/gkv416
- Bernard, B., Thorsson, V., Rovira, H., & Shmulevich, I. (2012). Increasing coverage of transcription factor position weight matrices through domain-level homology. PLoS One, 7(8), e42779 https://doi.org/10.1371/journal.pone.0042779
- Bohnert, H. J. (2007). Abiotic Stress. eLS.
- Buttner, M., & Singh, K. B. (1997). Arabidopsis thaliana ethylene-responsive element binding protein (AtEBP), an ethylene-inducible, GCC box DNA-binding protein interacts with an ocs element binding protein. Proceedings of the National Academy of Sciences of the United States of America, 94(11), 5961–5966. https://doi.org/10.1073/pnas.94.11.5961
- Carillo, P., Annunziata, M. G., Pontecorvo, G., Fuggi, A., & Woodrow, P. (2011). Salinity stress and salt tolerance. In Abiotic stress in plants-mechanisms and adaptations. IntechOpen.
- Case, D. A., Cheatham, T. E., 3rd, Darden, T., Gohlke, H., Luo, R., Merz, K. M., Jr., Onufriev, A., Simmerling, C., Wang, B., & Woods, R. J. (2005). The Amber biomolecular simulation programs. J Comput Chem, 26(16), 1668–1688.https://doi.org/10.1002/jcc.20290
- Davenport, R., James, R. A., Zakrisson-Plogander, A., Tester, M., & Munns, R. (2005). Control of Sodium Transport in Durum Wheat. Plant Physiology, 137(3), 807–818.https://doi.org/10.1104/pp.104.057307
- Deinlein, U., Stephan, A. B., Horie, T., Luo, W., Xu, G., & Schroeder, J. I. (2014). Plant salt-tolerance mechanisms. Trends in Plant Science. , 19(6), 371–379. https://doi.org/10.1016/j.tplants.2014.02.001
- Dossa, K., Wei, X., Li, D., Fonceka, D., Zhang, Y., Wang, L., Yu, J., Boshou, L., Diouf, D., Cisse, N., & Zhang, X. (2016). Insight into the AP2/ERF transcription factor superfamily in sesame and expression profiling of DREB subfamily under drought stress. BMC Plant Biology, 16(1), 171 https://doi.org/10.1186/s12870-016-0859-4
- Eddy, S. (2011). Accelerated profile HMM searches. PLoS Comput Biol, 7(10), e1002195 https://doi.org/10.1371/journal.pcbi.1002195
- El-Gebali, S., Mistry, J., Bateman, A., Eddy, S. R., Luciani, A., Potter, S. C., Qureshi, M., Richardson, L. J., Salazar, G. A., & Smart, A. (2018). The Pfam protein families database in 2019.
- Feng, C. Z., Chen, Y., Wang, C., Kong, Y. H., Wu, W. H., & Chen, Y. F. (2014). Arabidopsis RAV1 transcription factor, phosphorylated by SnRK2 kinases, regulates the expression of ABI3, ABI4, and ABI5 during seed germination and early seedling development. The Plant Journal: For Cell and Molecular Biology, 80(4), 654–668. https://doi.org/10.1111/tpj.12670
- Fujimoto, S. Y., Ohta, M., Usui, A., Shinshi, H., & Ohme-Takagi, M. (2000). Arabidopsis ethylene-responsive element binding factors act as transcriptional activators or repressors of GCC box-mediated gene expression. Plant Cell, 12(3), 393–404. https://doi.org/10.1105/tpc.12.3.393
- Gill, S. S., & Tuteja, N. (2010). Reactive oxygen species and antioxidant machinery in abiotic stress tolerance in crop plants. Plant Physiology and Biochemistry : PPB, 48(12), 909–930.https://doi.org/10.1016/j.plaphy.2010.08.016
- Grant, C. E., Bailey, T. L., & Noble, W. S. (2011). FIMO: Scanning for occurrences of a given motif. Bioinformatics (Oxford, England), 27(7), 1017–1018.https://doi.org/10.1093/bioinformatics/btr064
- Grattan, S., Zeng, L., Shannon, M., & Roberts, S. (2002). Rice is more sensitive to salinity than previously thought. California Agriculture, 56(6), 189–198. https://doi.org/10.3733/ca.v056n06p189
- Guo, B., Wei, Y., Xu, R., Lin, S., Luan, H., Lv, C., Zhang, X., Song, X., & Xu, R. (2016). Genome-Wide Analysis of APETALA2/Ethylene-Responsive Factor (AP2/ERF) Gene Family in Barley (Hordeum vulgare L.). PLoS One, 11(9), e0161322 https://doi.org/10.1371/journal.pone.0161322
- Hao, D., Ohme-Takagi, M., & Sarai, A. (1998). Unique mode of GCC box recognition by the DNA-binding domain of ethylene-responsive element-binding factor (ERF domain) in plant. J Biol Chem, 273(41), 26857–26861. https://doi.org/10.1074/jbc.273.41.26857
- Hao, D., Yamasaki, K., Sarai, A., & Ohme-Takagi, M. (2002). Determinants in the sequence specific binding of two plant transcription factors, CBF1 and NtERF2, to the DRE and GCC motifs. Biochemistry, 41(13), 4202–4208. https://doi.org/10.1021/bi015979v
- Hehl, R., & Bulow, L. (2014). AthaMap web tools for the analysis of transcriptional and posttranscriptional regulation of gene expression in Arabidopsis thaliana. Methods in Molecular Biology (Clifton, N.J.), 1158, 139–156.https://doi.org/10.1007/978-1-4939-0700-7_9
- Huang, X., Zhang, Y., Jiao, B., Chen, G., Huang, S., Guo, F., Shen, Y., Huang, Z., & Zhao, B. (2012). Overexpression of the wheat salt tolerance-related gene TaSC enhances salt tolerance in Arabidopsis. Journal of Experimental Botany, 63(15), 5463–5473.https://doi.org/10.1093/jxb/ers198
- Jamil, A., Riaz, S., Ashraf, M., & Foolad, M. (2011). Gene expression profiling of plants under salt stress. Critical Reviews in Plant Sciences, 30(5), 435–458. https://doi.org/10.1080/07352689.2011.605739
- Jofuku, K. D., den Boer, B. G., Van Montagu, M., & Okamuro, J. K. (1994). Control of Arabidopsis flower and seed development by the homeotic gene APETALA2. The Plant Cell, 6(9), 1211–1225. https://doi.org/10.1105/tpc.6.9.1211
- Katoh, K., Rozewicki, J., & Yamada, K. D. (2017). MAFFT online service: Multiple sequence alignment, interactive sequence choice and visualization. Briefings in Bioinformatics, 4, 1160–1166. https://doi.org/10.1093/bib/bbx108
- Khan, A., Fornes, O., Stigliani, A., Gheorghe, M., Castro-Mondragon, J. A., van der Lee, R., Bessy, A., Cheneby, J., Kulkarni, S. R., Tan, G., Baranasic, D., Arenillas, D. J., Sandelin, A., Vandepoele, K., Lenhard, B., Ballester, B., Wasserman, W. W., Parcy, F., & Mathelier, A. (2018a). JASPAR 2018: Update of the open-access database of transcription factor binding profiles and its web framework. Nucleic Acids Research, 46(D1), D260–D266.https://doi.org/10.1093/nar/gkx1126
- Khan, S. A., Li, M. Z., Wang, S. M., & Yin, H. J. (2018b). Revisiting the Role of Plant Transcription Factors in the Battle against Abiotic Stress. International Journal of Molecular Sciences, 19(6), 1634. https://doi.org/10.3390/ijms19061634
- Konda, A. K., Farmer, R., Soren, K. R., P, S. S., & Setti, A. (2018). Structural modelling and molecular dynamics of a multi-stress responsive WRKY TF-DNA complex towards elucidating its role in stress signalling mechanisms in chickpea. Journal of Biomolecular Structure & Dynamics, 36(9), 2279–2291.https://doi.org/10.1080/07391102.2017.1349690
- Kumar, S., Stecher, G., & Tamura, K. (2016). MEGA7: Molecular evolutionary genetics analysis version 7.0 for bigger datasets. Molecular Biology and Evolution, 33(7), 1870–1874. https://doi.org/10.1093/molbev/msw054
- Kurotani, K., Hayashi, K., Hatanaka, S., Toda, Y., Ogawa, D., Ichikawa, H., Ishimaru, Y., Tashita, R., Suzuki, T., Ueda, M., Hattori, T., & Takeda, S. (2015). Elevated levels of CYP94 family gene expression alleviate the jasmonate response and enhance salt tolerance in rice. Plant & Cell Physiology, 56(4), 779–789.https://doi.org/10.1093/pcp/pcv006
- Li, W., & Godzik, A. J. B. (2006). Cd-hit: A fast program for clustering and comparing large sets of protein or nucleotide sequences. Bioinformatics (Oxford, England), 22(13), 1658–1659. https://doi.org/10.1093/bioinformatics/btl158
- Liang, W., Ma, X., Wan, P., & Liu, L. (2018). Plant salt-tolerance mechanism: A review. Biochemical and Biophysical Research Communications, 495(1), 286–291.https://doi.org/10.1016/j.bbrc.2017.11.043
- Liu, W., Wang, Y., & Gao, C. (2014). The ethylene response factor (ERF) genes from Tamarix hispida respond to salt, drought and ABA treatment. Trees, 28(2), 317–327. https://doi.org/10.1007/s00468-013-0950-5
- Magnani, E., Sjolander, K., & Hake, S. (2004). From endonucleases to transcription factors: Evolution of the AP2 DNA binding domain in plants. The Plant Cell, 16(9), 2265–2277.https://doi.org/10.1105/tpc.104.023135
- Magome, H., Yamaguchi, S., Hanada, A., Kamiya, Y., & Oda, K. (2004). dwarf and delayed-flowering 1, a novel Arabidopsis mutant deficient in gibberellin biosynthesis because of overexpression of a putative AP2 transcription factor. The Plant Journal : For Cell and Molecular Biology, 37(5), 720–729. https://doi.org/10.1111/j.1365-313x.2003.01998.x
- Maier, J. A., Martinez, C., Kasavajhala, K., Wickstrom, L., Hauser, K. E., & Simmerling, C. (2015). ff14SB: Improving the Accuracy of Protein Side Chain and Backbone Parameters from ff99SB. Journal of Chemical Theory and Computation, 11(8), 3696–3713.https://doi.org/10.1021/acs.jctc.5b00255
- Mathelier, A., Fornes, O., Arenillas, D. J., Chen, C. Y., Denay, G., Lee, J., Shi, W., Shyr, C., Tan, G., Worsley-Hunt, R., Zhang, A. W., Parcy, F., Lenhard, B., Sandelin, A., & Wasserman, W. W. (2016). JASPAR 2016: A major expansion and update of the open-access database of transcription factor binding profiles. Nucleic Acids Research, 44(D1), D110–115. https://doi.org/10.1093/nar/gkv1176
- Mukherjee, K., Pandey, D. M., & Vidyarthi, A. S. (2015). In silico characterization and analysis of RTBP1 and NgTRF1 protein through MD simulation and molecular docking - A comparative study. Interdisciplinary Sciences, Computational Life Sciences, 7, 275–286. https://doi.org/10.1007/s12539-014-0237-6
- Nakano, T., Suzuki, K., Fujimura, T., & Shinshi, H. (2006). Genome-wide analysis of the ERF gene family in Arabidopsis and rice. Plant Physiology, 140(2), 411–432.https://doi.org/10.1104/pp.105.073783
- Ohme-Takagi, M., & Shinshi, H. (1995). Ethylene-inducible DNA binding proteins that interact with an ethylene-responsive element. The Plant Cell, 7(2), 173–182.https://doi.org/10.1105/tpc.7.2.173
- Okamuro, J. K., Caster, B., Villarroel, R., Van Montagu, M., & Jofuku, K. D. (1997). The AP2 domain of APETALA2 defines a large new family of DNA binding proteins in Arabidopsis. Proceedings of the National Academy of Sciences of the United States of America, 94(13), 7076–7081. https://doi.org/10.1073/pnas.94.13.7076
- Omidbakhshfard, M. A., Omranian, N., Ahmadi, F. S., Nikoloski, Z., & Mueller-Roeber, B. (2012). Effect of salt stress on genes encoding translation-associated proteins in Arabidopsis thaliana. Plant Signaling & Behavior, 7(9), 1095–1102.https://doi.org/10.4161/psb.21218
- Osorio, D., Rondón-Villarrea, P., & Torres, R. J. R. J. (2015). Peptides: a package for data mining of antimicrobial peptides. R Journal, 7, 4-14.
- Pandey, B., Grover, A., & Sharma, P. (2018). Molecular dynamics simulations revealed structural differences among WRKY domain-DNA interaction in barley (Hordeum vulgare). BMC Genomics. , 19(1), 132. https://doi.org/10.1186/s12864-018-4506-3
- Pandey, B., Sharma, P., Tyagi, C., Goyal, S., Grover, A., & Sharma, I. (2016). Structural modeling and molecular simulation analysis of HvAP2/EREBP from barley. Journal of Biomolecular Structure & Dynamics, 34(6), 1159–1175.https://doi.org/10.1080/07391102.2015.1073630
- Pires, D. E., Ascher, D. B., & Blundell, T. L. (2014). mCSM: Predicting the effects of mutations in proteins using graph-based signatures. Bioinformatics (Oxford, England), 30(3), 335–342.https://doi.org/10.1093/bioinformatics/btt691
- Pirrello, J., Prasad, B. C., Zhang, W., Chen, K., Mila, I., Zouine, M., Latche, A., Pech, J. C., Ohme-Takagi, M., Regad, F., & Bouzayen, M. (2012). Functional analysis and binding affinity of tomato ethylene response factors provide insight on the molecular bases of plant differential responses to ethylene. BMC Plant Biology, 12, 190 https://doi.org/10.1186/1471-2229-12-190
- Pradeepkiran, J. A., Kumar, K. K., Kumar, Y. N., & Bhaskar, M. (2015). Modeling, molecular dynamics, and docking assessment of transcription factor rho: A potential drug target in Brucella melitensis 16M. Drug Des Devel Ther, 9, 1897–1912.https://doi.org/10.2147/DDDT.S77020
- Quinlan, A. R., & Hall, I. M. (2010). BEDTools: A flexible suite of utilities for comparing genomic features. Bioinformatics (Oxford, England), 26(6), 841–842.https://doi.org/10.1093/bioinformatics/btq033
- Rashid, M., Guangyuan, H., Guangxiao, Y., Hussain, J., & Xu, Y. (2012). AP2/ERF Transcription Factor in Rice: Genome-Wide Canvas and Syntenic Relationships between Monocots and Eudicots. Evolutionary Bioinformatics Online, 8, 321–355.https://doi.org/10.4137/EBO.S9369
- Roe, D. R., & Cheatham, T. E. (2013). PTRAJ and CPPTRAJ: Software for Processing and Analysis of Molecular Dynamics Trajectory Data. Journal of Chemical Theory and Computation, 9(7), 3084–3095.https://doi.org/10.1021/ct400341p
- Sakuma, Y., Liu, Q., Dubouzet, J. G., Abe, H., Shinozaki, K., & Yamaguchi-Shinozaki, K. (2002). DNA-binding specificity of the ERF/AP2 domain of Arabidopsis DREBs, transcription factors involved in dehydration- and cold-inducible gene expression. Biochemical and Biophysical Research Communications, 290(3), 998–1009.https://doi.org/10.1006/bbrc.2001.6299
- Salomon‐Ferrer, R., Case, D. A., & Walker, R. C. (2013). An overview of the Amber biomolecular simulation package. Wiley Interdisciplinary Reviews: Computational Molecular Science, 3(2), 198–210. https://doi.org/10.1002/wcms.1121
- Sharoni, A. M., Nuruzzaman, M., Satoh, K., Shimizu, T., Kondoh, H., Sasaya, T., Choi, I. R., Omura, T., & Kikuchi, S. (2011). Gene structures, classification and expression models of the AP2/EREBP transcription factor family in rice. Plant & Cell Physiology, 52(2), 344–360.https://doi.org/10.1093/pcp/pcq196
- Shu, Y., Liu, Y., Zhang, J., Song, L., & Guo, C. (2015). Genome-Wide Analysis of the AP2/ERF Superfamily Genes and their Responses to Abiotic Stress in Medicago truncatula. Frontiers in Plant Science, 6, 1247 https://doi.org/10.3389/fpls.2015.01247
- Si, J., Zhao, R., & Wu, R. (2015). An overview of the prediction of protein DNA-binding sites. International Journal of Molecular Sciences, 16(12), 5194–5215. https://doi.org/10.3390/ijms16035194
- Singh, V., Singh, A. P., Bhadoria, J., Giri, J., Singh, J., T, V. V., & Sharma, P. C. (2018). Differential expression of salt-responsive genes to salinity stress in salt-tolerant and salt-sensitive rice (Oryza sativa L.) at seedling stage. Protoplasma, 255(6), 1667–1681. https://doi.org/10.1007/s00709-018-1257-6
- Stockinger, E. J., Gilmour, S. J., & Thomashow, M. F. (1997). Arabidopsis thaliana CBF1 encodes an AP2 domain-containing transcriptional activator that binds to the C-repeat/DRE, a cis-acting DNA regulatory element that stimulates transcription in response to low temperature and water deficit. Proceedings of the National Academy of Sciences of the United States of America, 94(3), 1035–1040. https://doi.org/10.1073/pnas.94.3.1035
- Sun, S., Yu, J. P., Chen, F., Zhao, T. J., Fang, X. H., Li, Y. Q., & Sui, S. F. (2008). TINY, a dehydration-responsive element (DRE)-binding protein-like transcription factor connecting the DRE- and ethylene-responsive element-mediated signaling pathways in Arabidopsis. J Biol Chem, 283(10), 6261–6271.https://doi.org/10.1074/jbc.M706800200
- Tester, M., & Davenport, R. (2003). Na + tolerance and Na + transport in higher plants. Annals of Botany, 91(5), 503–527. https://doi.org/10.1093/aob/mcg058
- Töpel, M., Zizka, A., Calió, M. F., Scharn, R., Silvestro, D., & Antonelli, A. (2017). SpeciesGeoCoder: Fast categorization of species occurrences for analyses of biodiversity, biogeography, ecology, and evolution. Systematic Biology, 66(2), 145–151. https://doi.org/10.1093/sysbio/syw064
- van Dijk, M., & Bonvin, A. M. (2009). 3D-DART: A DNA structure modelling server. Nucleic Acids Research, 37(Web Server issue), W235–239.https://doi.org/10.1093/nar/gkp287
- Vatansever, R., Uras, M. E., Sen, U., Ozyigit, I. I., & Filiz, E. (2017). Isolation of a transcription factor DREB1A gene from Phaseolus vulgaris and computational insights into its characterization: Protein modeling, docking and mutagenesis. Journal of Biomolecular Structure & Dynamics, 35(14), 3107–3118.https://doi.org/10.1080/07391102.2016.1243487
- Vazquez-Hernandez, M., Romero, I., Escribano, M. I., Merodio, C., & Sanchez-Ballesta, M. T. (2017). Deciphering the Role of CBF/DREB Transcription Factors and Dehydrins in Maintaining the Quality of Table Grapes cv. Autumn Royal Treated with High CO2 Levels and Stored at 0 degrees C. Frontiers in Plant Science., 8, 1591. https://doi.org/10.3389/fpls.2017.01591
- Wang, B., & Kennedy, M. A. (2014). Principal components analysis of protein sequence clusters. Journal of Structural and Functional Genomics, 15(1), 1–11.https://doi.org/10.1007/s10969-014-9173-2
- Webb, B., & Sali, A. (2016). Comparative Protein Structure Modeling Using MODELLER. Curr Protoc Bioinformatics, 54, 5 6 1–5 6 37. https://doi.org/10.1002/cpbi.3
- Wingender, E., Chen, X., Fricke, E., Geffers, R., Hehl, R., Liebich, I., Krull, M., Matys, V., Michael, H., Ohnhauser, R., Pruss, M., Schacherer, F., Thiele, S., & Urbach, S. (2001). The TRANSFAC system on gene expression regulation. Nucleic Acids Research, 29(1), 281–283. https://doi.org/10.1093/nar/29.1.281
- Xie, X-l., Yin, X-r., & Chen, K-s. (2016). Roles of APETALA2/ethylene-response factors in regulation of fruit quality. Critical Reviews in Plant Sciences, 35(2), 120–130. https://doi.org/10.1080/07352689.2016.1213119
- Xu, Z. S., Chen, M., Li, L. C., & Ma, Y. Z. (2011). Functions and application of the AP2/ERF transcription factor family in crop improvement. Journal of Integrative Plant Biology, 53(7), 570–585.https://doi.org/10.1111/j.1744-7909.2011.01062.x
- Yamaguchi-Shinozaki, K., & Shinozaki, K. (1994). A novel cis-acting element in an Arabidopsis gene is involved in responsiveness to drought, low-temperature, or high-salt stress. The Plant Cell, 6(2), 251–264.https://doi.org/10.1105/tpc.6.2.251
- Yan, Y., Zhang, D., Zhou, P., Li, B., & Huang, S. Y. (2017). HDOCK: A web server for protein-protein and protein-DNA/RNA docking based on a hybrid strategy. Nucleic Acids Research, 45(W1), W365–W373. https://doi.org/10.1093/nar/gkx407
- Yousfi, S., Marquez, A. J., Betti, M., Araus, J. L., & Serret, M. D. (2016). Gene expression and physiological responses to salinity and water stress of contrasting durum wheat genotypes. Journal of Integrative Plant Biology, 58(1), 48–66.https://doi.org/10.1111/jipb.12359
- Zhang, Z., & Li, X. (2018). Genome-wide identification of AP2/ERF superfamily genes and their expression during fruit ripening of Chinese jujube. Scientific Reports, 8(1), 15612 https://doi.org/10.1038/s41598-018-33744-w
- Zhang, A-d., Hu, X., Kuang, S., Ge, H., Yin, X-r., & Chen, K-s. (2016). Isolation, classification and transcription profiles of the Ethylene Response Factors (ERFs) in ripening kiwifruit. Scientia Horticulturae, 199, 209–215. https://doi.org/10.1016/j.scienta.2015.12.055
- Zhao, T., Liang, D., Wang, P., Liu, J., & Ma, F. (2012). Genome-wide analysis and expression profiling of the DREB transcription factor gene family in Malus under abiotic stress. Molecular genetics and genomics : MGG, 287(5), 423–436.https://doi.org/10.1007/s00438-012-0687-7
- Zhou, J., Tang, X., & Martin, G. B. (1997). The Pto kinase conferring resistance to tomato bacterial speck disease interacts with proteins that bind a cis-element of pathogenesis-related genes. The EMBO Journal, 16(11), 3207–3218.https://doi.org/10.1093/emboj/16.11.3207
- Zhu, J. K. (2001). Plant salt tolerance. Trends in Plant Science, 6(2), 66–71. https://doi.org/10.1016/s1360-1385(00)01838-0
- Zhu, Q., Zou, J., Zhu, M., Liu, Z., Feng, P., Fan, G., Wang, W., & Liao, H. (2014). In silico analysis on structure and DNA binding mode of AtNAC1, a NAC transcription factor from Arabidopsis thaliana. Journal of Molecular Modeling, 20(3), 2117. https://doi.org/10.1007/s00894-014-2117-8
- Zhuang, J., Chen, J. M., Yao, Q. H., Xiong, F., Sun, C. C., Zhou, X. R., Zhang, J., & Xiong, A. S. (2011). Discovery and expression profile analysis of AP2/ERF family genes from Triticum aestivum. Molecular Biology Reports, 38(2), 745–753.https://doi.org/10.1007/s11033-010-0162-7