
Abstract
Chronic infection induced by immune tolerance to hepatitis B virus (HBV) is one of the most common causes of hepatic cirrhosis and hepatoma. Fortunately, the application of therapeutic vaccine can not only reverse HBV-tolerance, but also serve a potentially effective therapeutic strategy for treating chronic hepatitis B (CHB). However, the clinical effect of the currently developed CHB therapeutic vaccine is not optimistic due to the weak immunogenicity. Given that the human leukocyte antigen CTLA-4 owns strong binding ability to the surface B7 molecules (CD80 and CD86) of antigen presenting cell (APCs), the immunoglobulin variable region of CTLA-4 (IgV_CTLA-4) was fused with the L protein of HBV to contrive a novel therapeutic vaccine (V_C4HBL) for CHB in this study. We found that the addition of IgV_CTLA-4 did not interfere with the formation of L protein T cell and B cell epitopes after analysis by means of immunoinformatics approaches. Meanwhile, we also found that the IgV_CTLA-4 had strong binding force to B7 molecules through molecular docking and molecular dynamics (MD) simulation. Notably, our vaccine V_C4HBL showed good immunogenicity and antigenicity by in vitro and in vivo experiments. Therefore, the V_C4HBL is promising to again effectively activate the cellular and humoral immunity of CHB patients, and provides a potentially effective therapeutic strategy for the treatment of CHB in the future.
Communicated by Ramaswamy H. Sarma
1. Introduction
According to World Health Organization’s (WHO's) the third round of global health estimates (GHE), there were approximately 257 million (3.5%) of the global population who had CHB (Ott et al., Citation2017; Pimpin et al., Citation2018). Surveys showed that the Asia-Pacific region accounted for about 62.6% of the world’s deaths from liver diseases, about 54.3% of the world’s deaths from cirrhosis, and about 72.7% of the world’s deaths from hepatocellular carcinoma (Fitzmaurice et al., Citation2017). Among them, more than half of the patients who died from cirrhosis were infected with HBV, and half of the patients with hepatocellular carcinoma also had CHB (Sarin et al., Citation2020). In China, particularly, there were still about 77 ∼ 97 million people with chronic HBV infection, of which at least 20 ∼ 30 million people developed active liver disease, 7 million people were at risk of developing liver cirrhosis and hepatocellular carcinoma (HCC) (Sarin et al., Citation2020). As an important source of infection, CHB patients also have the potential risk of persistent HBV transmission. At present, the standard antiviral program for CHB patients is to use nucleoside analogs (NAs) alone or in combination with type I interferon, but the HBV sustained response rate of these treatment options is still less than 30% (Li et al., Citation2017; Tseng & Kao, Citation2017). The main reason for this phenomenon is that the patient’s body has ‘immune tolerance’ to HBV, that is, specific T lymphocyte depletion (Polaris Observatory Collaborators, Citation2018). It is worth noting that the CHB therapeutic vaccine seems to be able to break the patient’s immune tolerance and form a sustained control of HBV, which has attracted great attention (Zhang et al., Citation2020).
The therapeutic vaccine details the inoculation of a non-infective form of viral antigen with the intention of inducing and boosting existing HBV specific immune responses, affecting on constant immune control of HBV infection, thereby enabling CHB patients to achieve ‘functional cure’ (Cargill & Barnes, Citation2021; Cornberg et al., Citation2020). Currently, a number of therapeutic vaccines such as NASVAC, YICHBV, ε PA-44 and GS-4774 have been tested in clinical trials, and these vaccines have shown good ability to induce immune responses in the body in previous animal experiments (Betancourt et al., Citation2007; Gaggar et al., Citation2014; Wei et al., Citation2022; Xu et al., Citation2008). However, the clinical effects of these vaccines are not ideal, so the development of specific vaccine strategies that induce stronger immune responses is still attractive (Fu et al., Citation2020).
According to a verity that T cell antigen receptor (TCR)–mediated signal transduction is a key event for T cell–mediated immune responses (Baudi et al., Citation2021). If the antigen presenting ability of APCs can be enhanced, the body’s immune response can also be enhanced. Some previous studies have reported that the fusion of CTLA-4 with antigen enhanced the potency of therapeutic HPV DNA vaccine, and induced significantly higher specific antibodies and relatively stronger specific T cell response than individual antigen (Gan et al., Citation2014; Jia et al., Citation2012; Yin et al., Citation2011). Therefore, combined with our previous research works in the field of vaccine design (Melenhorst et al., Citation2022; Ru et al., Citation2022; Yu et al., Citation2022), we utilized the strong affinity of CTLA-4 with B7, and embedded the IgV_CTLA-4 on the HBV large envelope protein (L protein). Different from previous studies, this study only chimed a more precise variable region of CTLA-4 on the L protein. Throughout the development history of cellular immunotherapy technology similar to chimeric antigen receptor T-cell immunotherapy (CAR-T) (Li et al., Citation2021), chimeric IgV_CTLA-4 appears to hold great promise in the field of infection immunology. Theoretically, the IgV_CTLA-4 can enhance the phagocytosis and antigen presentation ability of APCs to HBV L protein and try to break the established immune tolerance of the patient’s body and reshape the protective effect of the immune system. This novel CHB therapeutic vaccine was named as V_C4HBL (IgV_CTLA-4 & L protein).
In the CHB patients, the binding interactions of vaccine-candidate with APCs are crucial for creating a suitable immune response (Bhattacharya et al., Citation2021). Thus, we used the immunoinformatics approaches to analyze that IgV_CTLA-4 has no bad effect on L protein epitope formation, and the strong affinity of V_C4HBL with B7 was also confirmed by molecular docking and molecular dynamics (MD) simulation. In addition, due to the Kupffer cells are the largest population of resident tissue macrophage (Mφ) in the liver (Zhang & Bansal, Citation2020), we conducted the in vitro and in vivo experiment to demonstrate that the V_C4HBL has higher binding rate with Mφ and the fusion of CTLA-4 with antigen could significantly improve specific immune responses. The study will provide a new immunological strategy and direction for functional cure of HBV-infected patients in the future.
2. Materials and methods
2.1. Obtaining the amino acid sequence of the required proteins
We obtained the protein sequence of L protein (Genotype B) and human CTLA-4 from the National Center for Biotechnology Information (NCBI) database (https://www.ncbi.nlm.nih.gov/). In this study, the L protein is main specific antigen used to design HBV therapeutic vaccine, and CTLA-4 will appear in the N-terminal of the vaccine as an adjuvant sequence.
2.2. Prediction of physicochemical properties of L protein
Understanding the properties of antigen protein is conducive to the later expression, purification and vaccination of vaccine protein. So, the online tool ProtParam (https://web.expasy.org/protparam/) was used to analyze some necessary physical and chemical properties of L protein in the study. The ProtParam tool of Expasy can calculate various physicochemical properties that can be derived from protein sequences, and no additional information about proteins needs to be considered (Wilkins et al., Citation1999).
2.3. Prediction of signal peptide and transmembrane region
When predicting protein structure and antigenic epitopes, the signal peptide sequence should be eliminated. Therefore, we used the online prediction server SignalP 5.0 (https://services.healthtech.dtu.dk/service.php?SignalP-5.0) to predict the signal peptide of L protein (Almagro Armenteros et al., Citation2019). We selected the IgV_CTLA-4 sequence of CTLA-4 protein from the NCBI dataset for vaccine design, and the transmembrane region sequence of CTLA-4 was also predicted by the online software TMHMM-2.0 (https://services.healthtech.dtu.dk/service.php?TMHMM-2.0) for verifying the rationality of IgV_CTLA-4 sequence, that is, to check whether the IgV_CTLA-4 sequence is actually located in the extracellular region of the CTLA-4 protein.
2.4. Modelling and evaluation of L protein tertiary structure
In order to visualize the tertiary structure of L protein and analyze antigen epitopes in the later stage, we used the online server Robetta (https://robetta.bakerlab.org/) to model the tertiary structure of L protein. The Robetta is a protein structure prediction service that is continually evaluated through CAMEO (Baek et al., Citation2021). The 3D graphics of protein were drawn by Discover studio (DS) software. Besides that, the Structure Assessment tool of SWISS-MODEL (https://swissmodel.expasy.org/assess) was used to test the rationality of protein tertiary structure, that is, the spatial conformation that amino acid residues can theoretically produce is evaluated by generating a Ramachandran plot (Waterhouse et al., Citation2018).
2.5. The identification of L protein antigen epitopes
2.5.1. The identification of L protein HTLEs
The limitation of MHC molecule should be considered when predicting T cell epitopes, and the MHC was called human leukocyte antigen (HLA) in humans (Yu et al., Citation2021). According to previous study, the HLA-DRB1*09:01 molecule was one of the highest frequency HLA-II allele in China (He et al., Citation2018; Jin et al., Citation2017; Song et al., Citation2007). We used the web server IEDB (http://tools.iedb.org/mhcii/) to predict helper T lymphocyte epitopes (HTLEs), and the HLA-DRB1*09:01 was selected as the prediction object (Wang et al., Citation2008).
2.5.2. The identification of L protein BLEs
In this study, the BepiPred-2.0 tool (http://tools.iedb.org/bcell/) of IEDB was used to predict the linear B lymphocyte epitopes (BLEs). The BepiPred-2.0 can predict BLEs from antigen sequences, which is based on a random forest algorithm trained on epitopes annotated from antibody-antigen protein structures (Jespersen et al., Citation2017).
2.6. The design and construction of novel CHB therapeutic vaccine
The IgV_CTLA-4 sequence was connected to the N-terminal of L protein through Linker-GGGGSGGGGSGGGGS when contriving the therapeutic vaccine. The linker (GGGGS)3 is a rigid linker peptide, which can fully ensure the integrity of the protein structure at both ends of the linker. This novel HBV therapeutic vaccine consists of IgV_CTLA-4 and L protein was named V_C4HBL by the study. Similarly, the online server Robetta was also used to modeling of V_C4HBL protein tertiary structure, and the Structure Assessment tool of SWISS-MODEL was used to evaluate the rationality of protein spatial structure.
2.7. The epitope characterization analysis of V_C4HBL
After completing the design and construction of the vaccine, we used the same epitope prediction approach as above to identify HTLEs and BLEs of V_C4HBL. By comparing the epitope characteristics of L protein and V_C4HBL, to study the IgV_CTLA-4 change and effect on formation of L protein antigen epitope. At the same time, in order to more intuitively observe the changes of HTLEs and BLEs, we marked HTLEs and BLEs in L protein and V_C4HBL respectively.
2.8. Prediction of physicochemical properties of V_C4HBL
We also utilized the ProtParam tool to predict the physicochemical properties of V_C4HBL, and these physical and chemical properties would be used as the basis for later vaccine expression, in vitro and in vivo experiments.
2.9. Analysis of antigenicity and allergenicity of V_C4HBL
The standard vaccine should have satisfactory antigenicity and low allergenicity. Therefore, we evaluated the effectiveness and safety of V_C4HBL. The online software VaxiJen 2.0 (http://www.ddg-pharmfac.net/vaxijen/VaxiJen/VaxiJen.html) was used to predict the antigenicity of V_C4HBL. The VaxiJen 2.0 is an alignment-free sever for antigen prediction and it can transform the protein sequences into uniform vectors of principal amino acid properties based on auto cross covariance (ACC) (Doytchinova & Flower, Citation2007). In addition, the online software AllerTOP 2.0 (http://www.ddg-pharmfac.net/AllerTOP/) was used to predict the allergenicity of V_C4HBL. The AllerTOP classifies the proteins by k-nearest neighbor algorithm that based on training set containing 2427 known allergens from different species and 2427 non-allergens (Dimitrov et al., Citation2014).
2.10. Molecular docking
2.10.1. Acquisition of the B7 molecules
In order to perform molecular docking of IgV_CTLA4 with B7, we obtained the protein 3D structure model of B7 molecules in PDB database (https://www.rcsb.org/). We further used the structure cut and paste function of the DS software to edit the B7 molecules in the dimer state to obtain the B7-1 and B7-2 structural models in the monomer state for molecular docking.
2.10.2. The molecular docking of V_C4HBL with B7
The innovation of this study design is that we hope to realizes the close combination of L protein and APCs by IgV_CTLA-4. The binding interaction between IgV_CTLA-4 and B7 molecules can be calculated by molecular docking. And in this molecular docking, we chose the docking of V_C4HBL with B7 as the observation group and the docking of L protein with B7 as the control group. The LZerD Web Server 2021.6 (https://lzerd.kiharalab.org/upload/upload/) was employed to conduct the molecular docking of IgV_CTLA-4 with B7 molecules and the outstanding performance of LZerD Web Server 2021.6 in the protein pairwise docking field had been widely recognized (Christoffer et al., Citation2021; Venkatraman et al., Citation2009). At the same time, the LigPlot software was used to analyze and visualize the protein-protein interaction interface in the docked complex.
2.10.3. Difference analysis of docking quality evaluation indicators
After the molecular docking, we used the independent two-sample t-test to analyze the difference of GOAP Score, DFIRE Score and ITScore score three docking quality evaluation indicators between two groups. The generalized direction-dependent all-atom potential (GOAP) is a new statistical potential, and it depends on the relative orientation of the heavy atom planes in interacting pairs (Zhou & Skolnick, Citation2011). The distance-scaled, finite ideal-gas reference (DFIRE) is a new reference state that can characterize the residue (atom)-averaged state (Zhou & Zhou, Citation2002). ITScore is a statistical mechanics-based iterative method that can extract statistical atomic interaction potentials of known and nonredundant protein structures (Huang & Zou, Citation2011). The lower the score of these indicators, the better the quality of the docking complex. The statistical work of data was carried out by software SPSS 26.0 and the statistical chart was drawn using Graphpad prism 9 software.
2.11. MD simulation
The above highest quality docking complexes were selected as the primary structure for implementing the MD simulation, and the complex systems were solvated in a rectangular box of TIP3P waters that extended up to a minimum cutoff of 15 Å from the protein boundary. In the MD simulation, we used the Amber ff14SB force field for the protein. To neutralize the total charges of the systems, Cl- or Na + ions were added to the protein surface. The initial structures were minimized using a combination of steepest descent and conjugate gradient methods. Subsequently, the systems were annealed under a canonical ensemble for 0.2 ns with a weak restraint of 15 kcal/mol/Å while being heated from 10 K to 300 K. A density equilibration process was carried out with an isothermal-isobaric ensemble at a target temperature of 300K and a target pressure of 1.0 atm. The process employed Langevin-thermostat and Berendsen barostat with a collision frequency of 0.002 ns and pressure-relaxation time of 0.001 ns respectively. The equilibration lasted for 500 ps. After appropriate minimization and equilibration, a productive MD simulation of 200 ns was conducted for all complex systems. We also calculated the skeleton fluctuation of docking complex, including the root mean square deviation (RMSD) and the root mean square fluctuation (RMSF). The principal component analysis (PCA) of conformation sampling was also performed. The RMSD is a similarity measure widely used in kinetic analysis, which is often used to gain insight into the structural stability of receptor-ligand complexes (Sargsyan et al., Citation2017). The RMSF is the average position of amino acid residues defined by Cα-atoms, which is a common measure to quantify dynamics difference (Farmer et al., Citation2017). The PCA is a method to determine the basic dynamics of proteins, and it can reveal the most important motions in proteins (David & Jacobs, Citation2014).
2.12. Binding free energy
We also used the MM/PBSA method to calculate the binding free energy and energy decomposition of MD trajectories. The MD simulation was performed by GROMACS 2021.3 and the MM/PBSA calculation was run by Amber MMPBSA.py tools (He et al., Citation2021).
2.13. In vitro experiment
In this study, we included 48 patients (adults aged 18–60) diagnosed with CHB in the infection department of the First Affiliated Hospital of Xinjiang Medical University. And we also enrolled 10 healthy people (adults aged 18–60). All the patients selected met the Chinese guidelines for the diagnosis and treatment of CHB (Chinese Medical Association, Chinese Medical Journals Publishing House, Chinese Society of General Practice, Editorial Board of Chinese Journal of Ceneral Practitioners of Chinese Medical Association, Expert Group of Guidelines for Primary Care of Chronic Hepatitis B, Citation2021). We collected peripheral blood of all subjects (4 mL/person), the peripheral blood mononuclear cells (PBMCs) of CHB patients and the plasma of all subjects were separated and preserved, which would be used in subsequent in vitro experiments. The codon optimization and protein expression of L protein and V_C4HBL two antigen proteins were performed by the Sangon Biotech, Shanghai, Co., Ltd.
2.13.1. Detecting the phagocytosis of Mφ to V_C4HBL
The Flow Cytometry (FCM) and Immunofluorescence (IF) two experiments were performed to detect the phagocytosis of Mφ to V_C4HBL. First, we mixed the peripheral blood of 24 CHB patients, and then evenly distributed it into 24 centrifuge tubes according to 4 mL/share. The PBMCs of centrifuge tubes was separated by the human lymphocyte separation medium (P8610, Solarbio Science & Technology Co., Ltd., Beijing, China). The 24 tubes of PBMCs were separately inoculated into the 24 cell culture dishes (diameter 35 mm) with complete medium (RPMI1640 containing 10% FBS and 1% double antibiotics). After incubating in an incubator with 5% CO2 at 37 °C for 5 h, the suspended cells were washed with complete medium. Subsequently, the M-CSF (300-25-10UG, PeproTech, New Jersey, USA) (20 ng/mL) was added into each Petri dish separately and a half-volume media change was performed every 3 days. On the 8th day, the cell differentiated into Mφ. Among them, 12 dishes of Mφ were used for IF experiment and the remaining 12 dishes of Mφ were used for FCM experiment. In the two experiments, the Mφ was stimulated with L protein in L group (n = 6) or was stimulated with V_C4HBL protein in V group (n = 6). In FCM experiment, the Mφ was digested and collected after the 1 h stimulation of antigen protein, and the APC-Cy7 mouse anti-human CD14 (Becton, Dickinson and Company) and PE anti-6X His tag (ab237338, Abcam, Cambridge, UK) were used to detect the target antigen. In IF experiment, the PBMCs were plated on the cell climbing sheets in dishes. When Mφ was stimulated by antigen protein for 1 h, the cell climbing sheets were used for IF experiment, and the PE anti-6X His tag was used to detect the target antigen.
2.13.2. Detecting the immunogenicity of V_C4HBL
The Enzyme-linked Immunosorbent Assay (ELISA) and Enzyme-linked Immunospot (ELISPOT) assay two experiments were performed to detect the immunogenicity of V_C4HBL. We isolated and collected the PBMCs from patients, and the PBMCs was stimulated by aseptic PBS buffer (Control group, n = 6), L protein (L group, n = 6) or V_C4HBL protein (V group, n = 6) respectively for 48 h in a 37 °C under 5% CO2 humidified incubator. Then, the cell culture supernatant was collected for detecting IFN-γ and IL-4 by ELISA. The culture supernatant was added into ELISA IFN-γ and IL-4 plate separately and 2 replicate wells were set up for each sample. The rest of the steps were strictly in accordance with the kit instructions. The Human IFN-γ ELISA Kit (SEKH-0046, Solarbio Science & Technology Co., Ltd, Beijing, China) and Mouse IL-4 ELISA Kit (SEKH-0011, Solarbio Science & Technology Co., Ltd, Beijing, China) were adopted for ELISA. Similarly, the PBMCs of L group (n = 6) and V group (n = 6) was collected and inoculated into ELISPOT plate, and each sample contained 2 replicate wells. Then, the corresponding antigens were added into ELISPOT plate and the plate was incubated for 48 h in cell incubator. The subsequent experimental steps were performed according to the instructions of the kit and the total IgG-antibody secreting cells (ASCs) were detected finally. The ELISpot Flex-Human IgG (ALP) (3850-2 A, Mabtech, Stockholm, Sweden) was adopted for ELISPOT experiment in the study.
2.13.3. Detecting the antigenicity of V_C4HBL
The Western Blot experiment was performed for detecting the antigenicity of V_C4HBL. The loading buffer contained V_C4HBL (1 μg/μL) was separated by SDS-PAGE and the protein was transferred to PVDF membrane. After blocking by 5% skimmed milk powder solution, the PVDF membrane was immersed in human serum (1:500 dilution) of CHB patients (n = 10) and healthy people (n = 10), and was incubated overnight at 4 °C. The HBV viral load and anti-HBsAg titer of healthy people serum was negative. Then, the PVDF membrane was incubated with Rabbit anti-Human IgG secondary antibody that labeled with HRP (1:2000 dilution) at room temperature for 1 h. Finally, the target protein band was visualized with ECL detection kit (BL523B, Biosharp, Beijing, China), and exposed on Amersham Hyperfilm (GE Healthcare).
2.14. In vivo experiment
To evaluate the in vivo immune response induced by the vaccine V_C4HBL, mice were vaccinated and in vivo experiment was performed in this study. Eight-week-old SPF-grade female BALB/c mouse (18 mice) were randomly divided into three groups equally. Among them, the mice were injected with V_C4HBL protein in V group (n = 6), the mice were injected with L protein in L group (n = 6) and the mice were injected with the corresponding vehicle solvent for delivery of recombinant protein in Control group (n = 6). All mice received three immune injections, and the interval between previous and next immunization was two weeks. In L and V groups, 0.5 mL emulsion of complete Freund’s adjuvant (CFA) and antigen solution (including 50 μg recombinant protein) was subcutaneously injected into mice at the initial immunization. The CFA was replaced with incomplete Freund’s adjuvant (IFA) in the second and last immunization. In Control group, the mice were only injected with CFA and IFA. After 10 days of the last immunization, the spleen of all mice was taken and the single cell suspension was prepared under sterile conditions. Before conducting in vivo experiments, the C-ImmSim server (https://kraken.iac.rm.cnr.it/C-IMMSIM/) was used to simulate the vaccination process.
2.14.1. Immune simulation of the V_C4HBL
The C-ImmSim server is an agent-based simulator of the immune response, and it can use bioinformatics methods to predict the T and B cell epitopes of pathogens or lymphocyte receptors represented by amino acid sequences (Liu & Liu, Citation2019). In the simulation, the vaccination strategy was consistent with that of in vivo experiment. In the simulated parameters, the Random Seed was set to 1000, the Simulation Volume was 10 and the Simulation Steps was 100. The ‘A MHC class I’ was set to A0201 and A2402, the ‘B MHC class I’ was set to B1301 and B1501, and the ‘DR MHC class II’ was set to DRB1_0701 and DRB1_1501. The Time step of injection was set to 1, 42 and 84 respectively (1 time-step represents 8 h of real life and 2 wk between vaccinations). What to inject was vaccine (no LPS) and the Num Ag to inject was 1000.
2.14.2. Detecting the immune response of mouse Th cell
The cytometric bead array (CBA) was performed to detect the IFN-γ and IL-4 levels in supernatant of mouse splenocytes after culture. The previously prepared splenic single cells of mice in each group were stimulated by L protein (10 μg/well) in 24-well culture plate, and three cell culture wells for each mouse were established (2 × 10⁶ cells/well). The supernatant was collected after cells were incubated in a 37 °C incubator with 5% CO2 for 24 h. The experimental operation was carried out according to the Mouse CBA kit (C281031, QuantoBio, Beijing, China), and finally 300 μL of resuspended standard and experimental products were detected by flow cytometer.
2.14.3. Detecting the immune response of mouse B cell
The ELISA was performed to detect the total IgG level in supernatant of mouse splenocytes after culture. The splenic single cells of mice in each group were stimulated by L protein (10 μg/well) and three cell culture wells for each mouse were established (2 × 10⁶ cells/well). The supernatant was collected after cells were incubated for 72 h at 37 °C and 5% CO2 incubator. The Mouse IgG (Total) ELISA kit (SEKM-0098, Solarbio, Beijing, China) was used to this experiment, and the experiment operation strictly followed the kit instruction.
3. Results
3.1. The amino acid sequence of proteins
The search number of L protein in NCBI database was BBI18626, and the amino acid sequence was MGGWSSKPRQGMGTNLSVPNPLGFFPDHQLDPAFKANSENPDWDLNPHKDTWRDANKVGVGAFGPGFTPPHGGLLGWSPQAQGILTTVPATPPPASTNRQSGRQPTPFSPPLRDTHPQAMQWNSTTFHQTLQDPRVRALYFPAGGSSSGTVSPAQNTASAISSTFSKTGDPVPNMENIASGLLGPLLVLQAGFFLLTKILTIPQSLDSWWTSLNFLGETPVCLGQNSQSQISSHSPTCCPPICPGYRWMCLRRFIIFLCILLLCLIFLLVLLDYQGMLPVCPLIPGSSTTSTGPCRTCTTPAQGTSMFPSCCCSKPTDGNCTCIPIPSSWAFAKYLWEWASVRFYWLSLLVPFVQWFVGLSPTVWLSVIWMMWYWGPSLYNTLSPFMPLLPIFFCLWVYI. The search number of CTLA-4 protein in NCBI was P16410, and the amino acid sequence was MACLGFQRHKAQLNLATRTWPCTLLFFLLFIPVFCKAMHVAQPAVVLASSRGIASFVCEYASPGKATEVRVTVLRQADSQVTEVCAATYMMGNELTFLDDSICTGTSSGNQVNLTIQGLRAMDTGLYICKVELMYPPPYYLGIGNGTQIYVIDPEPCPDSDFLLWILAAVSSGLFFYSFLLTAVSLSKMLKKRSPLTTGVYVKMPPTEPECEKQFQPYFIPIN.
3.2. The physicochemical properties of L protein
The sequence length of L protein was 400 aa, the molecular weight was 44.0 kDa and the theoretical pI was 8.32. In all amino acid composition, there were 16 acidic amino acids (Asp + Glu) and 20 basic amino acids (Arg + Lys). The L protein had 6127 atoms and its molecular formula was C2018H3028N508O547S26. The instability index (II) was computed to be 53.53, so the protein was unstable (when the instability index is greater than 40, the protein is unstable), and the aliphatic index was 78.25. The grand average of hydropathy (GRAVY) was 0.082, so the protein was hydrophobic (the GRAVY is in the range of −2 ∼ 2, negative value means that the protein is hydrophilic and positive value means that the protein hydrophobic) (Wilkins et al., Citation1999).
3.3. The signal peptide and transmembrane region of proteins
The result of signal peptide prediction showed that the L protein signal peptide probability was 0.366%. It meant that there was no signal peptide sequence in this L protein sequence obtained, so this sequence can be directly used for predicting later antigen epitopes. In the prediction of protein transmembrane, the result showed that 43 ∼ 161 sites of CTLA-4 was outside region. The IgV_CTLA-4 sequence from NCBI was HVAQPAVVLASSRGIASFVCEYASPGKATEVRVTVLRQADSQVTEVCAATYMMGNELTFLDDSICTGTSSGNQVNLTIQGLRAMDTGLYICKVELMYPPPYYLGIGNGTQIYVI, it was located at the 39 ∼ 152 sites of CTLA-4 protein. So, the IgV_CTLA-4 sequence from NCBI was consistent with prediction results. The specific result was shown in Supplementary Figure 1.
3.4. Modeling and validation of L protein tertiary structure
After the protein tertiary structure modeling by Robetta Sever, the Sever gave five protein models and we chose the Model 1 with the best confidence ranking in comparative modeling method as the tertiary structure of L protein. In the model quality validation, the Ramachandran plot of SWISS-MODEL showed that the L protein model had 93.97% Ramachandran favored area. The tertiary structure and model quality evaluation diagram was shown in Supplementary Figure 2.
3.5. The identification of L protein antigen epitopes
3.5.1. The identification of L protein HTLEs
The web server IEDB had predicted the HTLEs. In the output sequences, we selected the top 20 according to the Rank as the HTLEs. The lower the sequence Rank, the better the representativeness of the result (Wang et al., Citation2008). And the length of all the HTLEs were set to 15 aa. The result of HTLEs of L protein was shown in Supplementary Table 1.
3.5.2. The identification of L protein BLEs
The online software IEDB had predicted the BLEs. In all output sequences, we only took the sequence with length greater than or equal to 5 aa as the BLEs. And we chose the top 10 as the final result of BLEs. The result of HTLEs of L protein was shown in Supplementary Figure 2.
3.6. The design and construction of V_C4HBL
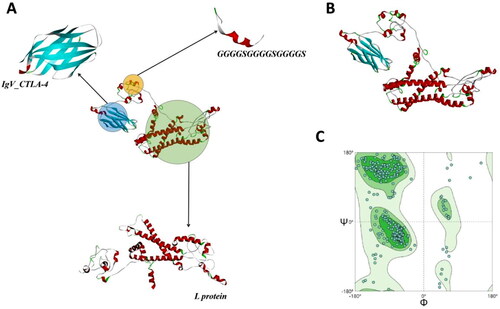
The Linker-GGGGSGGGGSGGGGS was used to connect IgV_CTLA-4 and L protein two parts. The sequence length of the vaccine designed (V_C4HBL) was 529 aa and the sequence was HVAQPAVVLASSRGIASFVCEYASPGKATEVRVTVLRQADSQVTEVCAATYMMGNELTFLDDSICTGTSSGNQVNLTIQGLRAMDTGLYICKVELMYPPPYYLGIGNGTQIYVIGGGGSGGGGSGGGGSMGGWSSKPRQGMGTNLSVPNPLGFFPDHQLDPAFKANSENPDWDLNPHKDTWRDANKVGVGAFGPGFTPPHGGLLGWSPQAQGILTTVPATPPPASTNRQSGRQPTPFSPPLRDTHPQAMQWNSTTFHQTLQDPRVRALYFPAGGSSSGTVSPAQNTASAISSTFSKTGDPVPNMENIASGLLGPLLVLQAGFFLLTKILTIPQSLDSWWTSLNFLGETPVCLGQNSQSQISSHSPTCCPPICPGYRWMCLRRFIIFLCILLLCLIFLLVLLDYQGMLPVCPLIPGSSTTSTGPCRTCTTPAQGTSMFPSCCCSKPTDGNCTCIPIPSSWAFAKYLWEWASVRFYWLSLLVPFVQWFVGLSPTVWLSVIWMMWYWGPSLYNTLSPFMPLLPIFFCLWVYI. After design and modeling of V_C4HBL, we also chose the best ranked Model 1 from Robetta as the tertiary structure of V_C4HBL. In the model quality validation of SWISS-MODEL, the Ramachandran plot showed that the V_C4HBL model had 91.46% Ramachandran favored area. The construction and model quality evaluation diagram of V_C4HBL was shown in .
Figure 1. The model and quality validation of V_C4HBL tertiary structure. (A) the recombinant protein V_C4HBL consists of three parts, including IgV_CTLA-4, Linker-(GGGGS)3 and L protein. (B) This is the tertiary structure model of V_C4HBL, and This model is displayed in the style of secondary structure. The red color represents α-helix, green color represents β-turn, the cyan color represents β-sheet and gray color represents Random Coil. (C) This is the tertiary structure Ramachandran plot of V_C4HBL. The dark green subarea is favored region, the green subarea is additional allowed region, the light green subarea is generously allowed region and the white subarea is disallowed region. When the number of points in the favored region is greater than 90%, the model of tertiary structure is reasonable.
3.7. The epitope characteristics analysis of V_C4HBL
3.7.1. The HTLEs contrast of L protein and V_C4HBL
The same tool was used to identify the HTLEs, and the same parameters were set during identification. After the identification of the V_C4HBL HTLEs, it was found that all the HTLEs of the above L protein again appeared in V_C4HBL and their sequence had not changed. The matching rate of HTLEs between L protein with V_C4HBL reached 100%. This suggested that V_C4HBL contains effective CD4+ T cell epitope of L protein, which can activate CD4+ T cell immune response in theory.
3.7.2. The BLEs contrast of L protein and V_C4HBL
The study used the same method to identify BLEs of L protein and V_C4HBL. After comparing the BLEs of L protein and V_C4HBL, we found that all the BLEs of the above L protein again appeared in V_C4HBL and their sequence had not changed. The BLEs matching rate of L protein with V_C4HBL reached 100%. This suggested that the V_C4HBL can activate B cell immune response theoretically. The BLEs contrast of L protein and V_C4HBL from IEDB were shown in Supplementary Figure 3.
3.7.3. The HTLEs and BLEs contrast of two proteins
In comparing the epitopes of L protein and V_C4HBL, we labeled the HTLEs and BLEs of the two proteins in the original tertiary structure. Through this more vivid display method, we found that the antigen epitope matching degree of L protein and V_C4HBL is very high, which suggested that the addition of IgV_CTLA-4 did not disturb the antigen exposure of L protein. The HTLEs and BLEs contrast diagram of two proteins was shown in and .
Figure 2. The visualization of HTLEs and BLEs in two proteins. (A) This diagram is the tertiary structure model of L protein. The red color represents HTLEs and the green color represents BLEs. (B) This diagram is the visualization of HTLEs in L protein and the red region is the HTLEs. (C) This diagram is the visualization of BLEs in L protein and the green region is the BLEs. (D) This diagram is the tertiary structure model of V_C4HBL protein. The red color represents HTLEs, the green color represents BLEs and the cyan color represents IgV_CTLA-4. (E) This diagram is the visualization of HTLEs in V_C4HBL and the red region is the HTLEs. (F) This diagram is the visualization of BLEs in V_C4HBL and the red region is the BLEs.
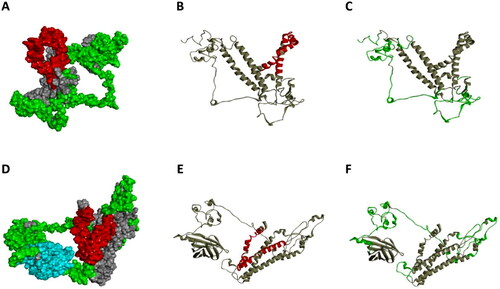
Table 1. The HTLEs and BLEs contrast of L protein and V_C4HBL.
3.8. The physicochemical properties of V_C4HBL
The protein sequence length of V_C4HBL was 529 aa, the molecular weight was 57.0 kDa and the theoretical pI was 7.51. In all amino acid composition, there were 25 acidic amino acids (Asp + Glu) and 26 basic amino acids (Arg + Lys). The L protein had 7948 atoms and its molecular formula was C2588H3931N663O732S34. The instability index (II) was computed to be 50.75, so the protein was unstable (when the instability index is greater than 40, the protein is unstable), and the aliphatic index was 79.43. The GRAVY was 0.100, so the protein was hydrophobic (the GRAVY is in the range of −2 ∼ 2, negative value means that the protein is hydrophilic and positive value means that the protein hydrophobic) (Wilkins et al., Citation1999).
3.9. The allergenicity and antigenicity of V_C4HBL
In the allergenicity analysis, the V_C4HBL sequence was probable non-allergen and it was defined as non-allergen. In the antigenicity analysis, the predictive model selected was virus and threshold for this model was 0.4. The overall protective antigen prediction was 0.4975 and this suggested that V_C4HBL was belonged to probable antigen.
3.10. Molecular docking
3.10.1. Acquisition of B7 molecules
In the PDB database, the ID of human B7-1/CTLA-4 co-stimulatory complex was 1I8L and the B7-2/CTLA-4 co-stimulatory complex was 1I85. These two co-stimulatory complexes downloaded was dimer state, and we got the monomer structure models of B7-1 and B7-2 after editing by DS software. The protein tertiary structure model of B7 molecules was shown in Supplementary Figure 4.
3.10.2. The molecular docking of two antigens with B7
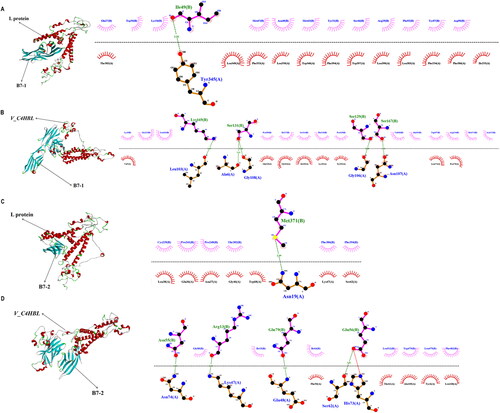
The molecular docking of L protein with B7 was performed by LZerD Web Server 2021.6, and the docking of V_C4HBL with B7 was also performed. In the molecular docking, the B7 molecules was set as receptor, and the V_C4HBL or L protein were set as ligand. Thus, there were L protein with B7-1, L protein with B7-2, V_C4HBL with B7-1 and V_C4HBL with B7-2 four different docking complexes were outputted after docking work. The LZerD Web Server 2021.6 outputted 500 docking Pose (s) every complex, and we picked the top rank docking pose with the highest binding score as final results. In addition, the interaction interface predicted by the LigPlot software is two-dimensional. The best docking pose of L protein with B7-1 was shown in , and there is 1 hydrogen bond involved in the interaction interface. The best docking pose of V_C4HBL with B7-1 was shown in , and there are 5 hydrogen bonds involved in the interaction interface. The best docking pose of L protein with B7-2 was shown in , and there is 1 hydrogen bond involved in the interaction interface. The best docking pose of V_C4HBL with B7-2 was shown in , and there are 1 ionic bond and 4 hydrogen bonds involved in the interaction interface. These docking complexes would be selected as the primary structure for initiating the MD simulation.
Figure 3. The molecular docking of two antigens with B7. (A) This diagram is the molecular docking complex of L protein with B7-1, and it is displayed in the style of secondary structure. The red color represents α-helix, green color represents β-turn, the cyan color represents β-sheet and gray color represents Random Coil. In the interaction interface, the red dotted line represents ionic bond, the green dotted line represents hydrogen bond and the value of the midpoint is the length of the bond. (B) This diagram is the molecular docking complex of V_C4HBL with B7-1, and it is displayed in the style of secondary structure. The red color represents α-helix, green color represents β-turn, the cyan color represents β-sheet and gray color represents Random Coil. In the interaction interface, the red dotted line represents ionic bond, the green dotted line represents hydrogen bond and the value of the midpoint is the length of the bond. (C) This diagram is the molecular docking complex of L protein with B7-2, and it is displayed in the style of secondary structure. The red color represents α-helix, green color represents β-turn, the cyan color represents β-sheet and gray color represents Random Coil. In the interaction interface, the red dotted line represents ionic bond, the green dotted line represents hydrogen bond and the value of the midpoint is the length of the bond. (D) This diagram is the molecular docking complex of V_C4HBL with B7-2, and it is displayed in the style of secondary structure. The red color represents α-helix, green color represents β-turn, the cyan color represents β-sheet and gray color represents Random Coil. In the interaction interface, the red dotted line represents ionic bond, the green dotted line represents hydrogen bond and the value of the midpoint is the length of the bond.
3.10.3. Difference analysis of docking quality evaluation indicators
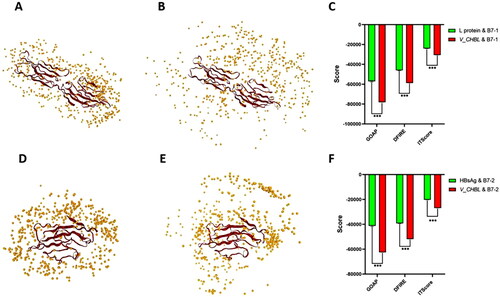
In the docking project of executed by LZerD Web Server 2021.6, the GOAP Score, DFIRE Score and ITScore score were the docking quality evaluation indicators (Huang & Zou, Citation2011; Zhou & Skolnick, Citation2011; Zhou & Zhou, Citation2002). The simulation diagram of 500 L protein with B7-1 docking complex Pose (s) were shown in , 500 V_C4HBL with B7-1 docking complex Pose (s) were shown in , 500 L protein with B7-2 docking complex Pose (s) were shown in and 500 V_C4HBL with B7-2 docking complex Pose (s) were shown in . The average of GOAP Score, DFIRE Score and ITScore score were calculated. In all L protein with B7-1 complexes, the GOAP Score average was −57037.04, the DFIRE Score average was −46090.52 and the GOAP Score average was −24096.74. In all V_C4HBL with B7-1 complexes, the GOAP Score average was −78128.99, the DFIRE Score average was −58711.45 and the GOAP Score average was −30677.37 (). In the two independent samples t-test, the three kinds of V_C4HBL with B7-1 docking scores significantly higher than L protein with B7-1 (t = 524.757, p < 0.001; t = 703.765, p < 0.001; t = 971.166, p < 0.001). In all L protein with B7-2 complexes, the GOAP Score average was −41295.19, the DFIRE Score average was −39237.12 and the GOAP Score average was −20292.34. In all V_C4HBL with B7-2 complexes, the GOAP Score average was −62543.91, the DFIRE Score average was −51843.66 and the GOAP Score average was −26881.56 (). The three kinds of V_C4HBL with B7-2 docking scores significantly higher than L protein with B7-2 (t = 781.821, p < 0.001; t = 996.725, p < 0.001; t = 1263.134, p < 0.001).
Figure 4. Difference analysis of quality score of docking complex. (A) This diagram is the top 500 quality docking Pose (s) of L protein with B7-1 and each yellow ball represents a spatial location of L protein. The relative space combination of any yellow ball with red region (B7-1) is a docking Pose. (B) This diagram is the top 500 quality docking Pose (s) of V_C4HBL with B7-1 and each yellow ball represents a spatial location of V_C4HBL. The relative space combination of any yellow ball with red region (B7-1) is a docking Pose. (C) This diagram is the difference analysis of docking quality scores between L protein with B7-1 and V_C4HBL with B7-1. The statistical method is two independent samples t-test (***p < 0.001). (D) This diagram is the top 500 quality docking Pose (s) of L protein with B7-2 and each yellow ball represents a spatial location of L protein. The relative space combination of any yellow ball with red region (B7-2) is a docking Pose. (E) This diagram is the top 500 quality docking Pose (s) of V_C4HBL with B7-2 and each yellow ball represents a spatial location of V_C4HBL. The relative space combination of any yellow ball with red region (B7-2) is a docking Pose. (F) This diagram is the difference analysis of docking quality scores between L protein with B7-2 and V_C4HBL with B7-2. The statistical method is two independent samples t-test (***p < 0.001).
3.11. MD simulation
3.11.1. The RMSD of MD simulation
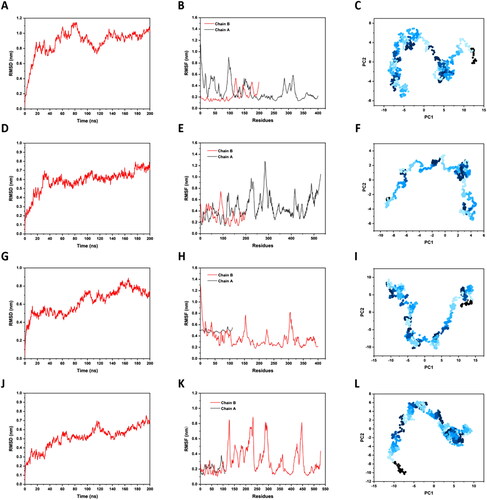
We performed the 200 ns MD simulation for four docking complexes. After running, the results showed that the RMSD fluctuation value of L protein with B7-1 complex was 0 ∼ 1.1 nm (), the fluctuation value of V_C4HBL with B7-1 complex was 0 ∼ 0.8 nm (). The fluctuation value of L protein with B7-2 complex was 0 ∼ 0.9 nm (), the fluctuation value of V_C4HBL with B7-2 complex was 0 ∼ 0.7 nm (). The fluctuation range of RMSD trajectory was small and the difference between L protein with B7 and V_C4HBL with B7 was low, which indicated that indicated that the docking system of complexes is stable.
Figure 5. The MD simulation. (A) This is the RMSD trajectory of L protein with B7-1 complex. The abscissa is the running time of MD simulation and the ordinate is the RMSD-value. (B) This is the RMSF trajectory of L protein with B7-1 complex. The abscissa is the amino acid residues in docking complexes and the ordinate is the RMSF-value. (C) This is the PCA process of L protein with B7-1 complex. The abscissa represents the principal component 1 of conformation, and the ordinate represents the principal component 2 of conformation. (D) This is the RMSD trajectory of V_C4HBL with B7-1 complex. (E) This is the RMSF trajectory of V_C4HBL with B7-1 complex. (F) This is the PCA process of V_C4HBL with B7-1 complex. (G) This is the RMSD trajectory of L protein with B7-2 complex. (H) This is the RMSF trajectory of L protein with B7-2 complex. (I) This is the PCA process of L protein with B7-2 complex. (J) This is the RMSD trajectory of V_C4HBL with B7-2 complex. (K) This is the RMSF trajectory of V_C4HBL with B7-2 complex. (L) This is the PCA process of V_C4HBL with B7-2 complex.
3.11.2. The RMSF of MD simulation
The results showed that RMSF fluctuation value of L protein with B7-1 complex was 0.1 ∼ 0.9 nm (), the fluctuation value of V_C4HBL with B7-1 complex was 0.1 ∼ 1.3 nm (). The fluctuation value of L protein with B7-2 complex was 0.2 ∼ 1.3 nm (), the fluctuation value of V_C4HBL with B7-2 complex was 0.1 ∼ 0.9 nm (). Similarly, the small fluctuation range and low variability between complexes in RMSF trajectory showed that the docking complex is stable.
3.11.3. The PCA of MD simulation
In this study, the most critical principal component 1 (PC1) and principal component 2 (PC2) were projected into 2D drawing to observe the protein conformational states in a PC phase space. The results of PCA showed that the PC1 was within −10 ∼ 13 and PC2 was within −8 ∼ 8 in the complex of L protein with B7-1 (), the PC1 was within −10 ∼ 5 and PC2 was within −6 ∼ 4 in the complex of V_C4HBL with B7-1 (), so the PCA fluctuation of L protein with B7-1 complex was more violent than the fluctuation of V_C4HBL with B7-1 complex. In addition, the PC1 was within −13 ∼ 15 and PC2 was within −10 ∼ 10 in the complex of L protein with B7-2 (Figure 51), the PC1 was within −13 ∼ 10 and PC2 was within −11 ∼ 6 in the complex of V_C4HBL with B7-2 (), so the PCA fluctuation of L protein with B7-2 complex was more violent than the fluctuation of V_C4HBL with B7-2 complex. The above results showed that the docking of V_C4HBL with B7 molecules is more stable than the docking of L protein with B7 molecules.
3.11.4. MM/PBSA calculation of MD simulation
The MM/PBSA calculation split the binding free energy into the molecular mechanics term and the solvation free energy two parts. Among them, the energy of molecular mechanics (ΔGGAS) was composed of van der Waals interaction energy (ΔVDWAALS) and electrostatic energy (ΔEEL), and the solvation energy (ΔGSOLV) was composed of polar solvation energy (ΔEGB) and nonpolar solvation energy (ΔESURF). The total binding free energy (ΔTOTAL) was the sum of ΔGGAS and ΔGSOLV. In the result of MM/PBSA calculation, the ΔTOTALL protein with B7-1 was −67.73 kJ/mol, the ΔTOTALV_C4HBL with B7-1 was −46.58 kJ/mol, the ΔTOTALL protein with B7-2 was −55.23 kJ/mol, the ΔTOTALV_C4HBL with B7-2 was −52.18 kJ/mol (). The smaller the value of binding free energy, the stronger the binding force. Therefore, the binding force of V_C4HBL with B7 molecules is stronger than that of L and B7 molecules.
Table 2. The MM/PBSA Calculations of average binding free energy for four complexes.
3.12. In vitro experiment
The optimized codon sequence and expression plasmid map of the two antigen proteins required for in vitro experiments were shown in the Supplementary material and the plasmid map was shown in Supplementary Figure 5.
3.12.1. Flow cytometry
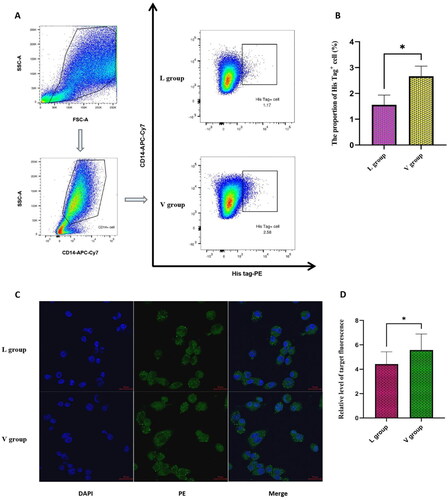
We detected the Mφ bound with the antigen proteins by FCM experiment surface staining method. Because we used the plasmid pET-30a (+) to express L and V_C4HBL proteins, the proteins had the 6X His sequence and the Mφ was marked as CD14+ His tag+ cell. In all Mφ, the average proportion of cells bound with L protein was 1.55%, and the average proportion of cells bound with V_C4HBL protein was 2.66%. The two independent samples t-test was used to detect the proportion difference between L group and V group. After the analysis of software SPSS 26.0, the proportion of Mφ bound with V_C4HBL protein significantly higher than the Mφ bound with L protein and the difference was statistically significant (t = 3.523, p < 0.05). The result was shown in .
Figure 6. the results of FCM and IF. (A) This diagram is the representative FCM Gating strategy in the FCM experiment. The finally delineated cell is Mφ expressing antigen protein. (B) This diagram is the statistical analysis of positive cell proportion between L and V group, and the statistical method is two independent samples t-test (*p < 0.05). (C) This diagram is the representative result of IF experiment. The blue color represents nucleus and the green color represents antigen protein. The antigen protein is expressed in the cytoplasm and cell membrane. (D) This diagram is the statistical analysis of antigen protein expression level between L and V group, and the statistical method is two independent samples t-test (*p < 0.05).
3.12.2. Immunofluorescence
We detected the antigen proteins that Mφ swallowed by IF experiment and the antigen proteins was marked by PE anti-6X His tag. After IF experiment, we used the Image J software to count the target fluorescence spots and nuclei. Then, the ratio of target fluorescent spots number to the nuclei number was taken as the relative level of antigen proteins that Mφ swallowed. The relative level of L proteins in L group was 4.42 and the relative level of V_HBL proteins in V group was 5.58. The two independent samples t-test was used to detect the relative level difference between L group and V group. After the analysis of software SPSS 26.0, the relative level of V_C4HBL protein significantly higher than the relative level of L protein and the difference was statistically significant (t = 2.209, p < 0.05). The result was shown in .
3.12.3. Enzyme linked immunosorbent assay
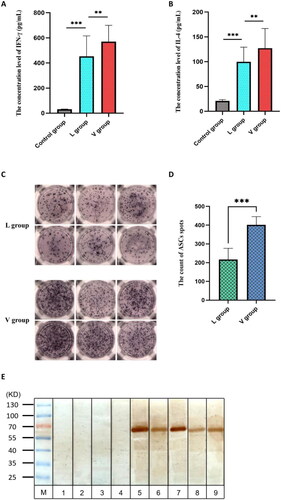
We detected the secretion of IFN-γ and IL-4 after the PBMCs was stimulated by antigen proteins. After determination, the average amount of IFN-γ secretion in Control group was 31.04 pg/mL, the average amount of IFN-γ secretion in L group was 452.99 pg/mL, and the average secretion amount in V group was 570.63 pg/mL. The average secretion amount of IL-4 in Control group was 20.84 pg/mL, the average secretion amount of IL-4 in L group was 99.57 pg/mL and the average amount in V group was 127.15 pg/mL. The two independent samples t-test was used to detect the secretion amount difference of IFN-γ and IL-4 between Control group, L group and V group. The secretion amount of IFN-γ in L group was significantly higher than the secretion amount in Control group (t = −14.181, p < 0.001), and the secretion amount of IFN-γ in V group was significantly higher than the secretion amount in L group (t = −3.100, p < 0.01) (). The secretion amount of IL-4 in L group was significantly higher than the secretion amount in Control group (t = −14.473, p < 0.001), and the secretion amount of IL-4 in V group was significantly higher than the secretion amount in L group (t = −3.047, p < 0.01) ().
Figure 7. the results of in vitro experiment. (A) This diagram is the statistical analysis of IFN-γ concentration level between L and V group, and the statistical method is two independent samples t-test (**p < 0.01, ***p < 0.001). (B) This diagram is the statistical analysis of IL-4 concentration level between L and V group, and the statistical method is two independent samples t-test (**p < 0.01, ***p < 0.001). (C) This diagram is the representative ELISPOT spots. The blue purple spots represent ASCs. (D) This diagram is the statistical analysis of ASCs spot count between L and V group, and the statistical method is two independent samples t-test (***p < 0.001). (E) This diagram is the representative Western Blot bands. The bound 1-4 derived from healthy people and the bound 5-9 derived from CHB patients. The brown yellow band is the imprint of V_C4HBL protein.
3.12.4. Enzyme-linked immunospot assay
We detected the ASCs in PBMCs of CHB patients. After the PBMCs was stimulated by antigen proteins, we found that the V_C4HBL can activate B cell more obviously compared with L protein. The average immune spot count was 217 in L group, the average immune spot count was 402 in V group and the difference was statistically significant (t = 6.097, p < 0.001). The result was shown in .
3.12.5. Western blot
The specific antibody against V_C4HBL in serum of infected patients was assessed by Western Blot. In CHB patients, the body had the specific HBV L protein antibody. Therefore, when V_C4HBL protein was incubated with patient serum, the target band of about 57 kDa could be produced. The result was shown in .
3.13. In vivo experiment
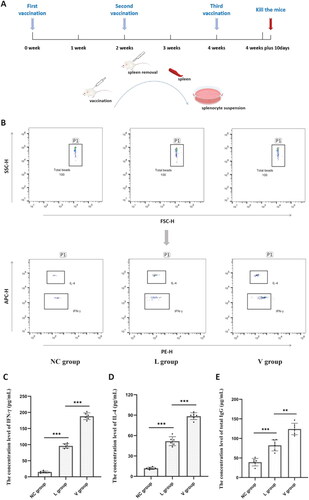
The function of the C-ImmSim server is to simulate antigens to stimulate multiple immune cells, so that they can secrete cytokines and antibodies. The immune simulation results showed that the high levels of IFN-γ and IL-2 induced during the simulation contributed to the generation of a robust immune response (). Furthermore, the levels of IgM, IgG, IgG1 and IgG2 antibodies are higher in secondary and tertiary immune responses compared to the primary immune response. These secondary and tertiary reactions indicate a decrease in antigen concentration accompanied by an increase in the level of immunoglobulin activity (). The flow chart of mouse vaccination strategy was shown in . The immunogenicity of vaccine V_C4HBL was further verified by the mouse immunization model. In the CBA experiment, FCM analysis chart of cytokine was shown in . In splenocyte culture supernatant, the concentration of IFN-γ was 14.91 pg/mL in Control group, 95.86 pg/mL in L group and 188.12 pg/mL in V group (). The IFN-γ concentration level of L group was significantly higher than Control group (t = −25.517, p < 0.001), and the IFN-γ concentration level of V group was significantly higher than L group (t = −17.958, p < 0.001). The concentration of IL-4 was 11.89 pg/mL in Control group, 51.72 pg/mL in L group and 88.43 pg/mL in V group (). The IL-4 concentration level of L group was significantly higher than Control group (t = −14.320, p < 0.001), and the IL-4 concentration level of V group was significantly higher than L group (t = −10.801, p < 0.001). In the ELISA experiment, the concentration of total IgG was 39.17 μg/mL in Control group, 82.19 μg/mL in L group and 124.05 μg/mL in V group (). The total IgG concentration level of L group was significantly higher than Control group (t = −6.178, p < 0.001), and the total IgG concentration level of V group was significantly higher than L group (t = −5.030, p < 0.01).
Figure 8. the results of immune simulation. (A) This Figure shows the different immune response and host immune factor secretion on the injection of different doses at different intervals, including concentration of cytokines and interleukins. The inset plot shows danger signal together with leukocyte growth factor IL-2. (B) The virus, the immunoglobulins and the immunocomplexes. The mainly reflects the relationship between the level of these immune molecules and the amount of antigen entering the body.
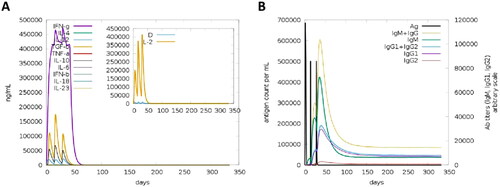
Figure 9. The results of in vivo experiment. (A) The flow chart of mouse vaccination strategy, Representing the steps of mouse vaccination experiment. The mice in different groups were inoculated with ‘adjuvant’, ‘adjuvant + L protein’ or ‘adjuvant + V_C4HBL protein’ respectively. (B) This is the representative CBA’s FCM analysis chart of IFN-γ and IL-4, and the label for detecting antibody is PE fluorescein. (C) This diagram is the statistical analysis of IFN-γ concentration level in NC, L and V group. The sample size of each group is 6 (n = 6), the spleen cells in each group were stimulated by L protein and the stimulation time is 24 h. The statistical method is two independent samples t-test (***p < 0.001). (D) This diagram is the statistical analysis of IL-4 concentration level in NC, L and V group. The sample size of each group is 6 (n = 6), the spleen cells in each group were stimulated by L protein and the stimulation time is 24 h. The statistical method is two independent samples t-test (***p < 0.001). (E) This diagram is the statistical analysis of total IgG concentration level in NC, L and V group. The sample size of each group is 6 (n = 6), the spleen cells in each group were stimulated by L protein and the stimulation time is 72 h. The statistical method is two independent samples t-test and the statistical method is two independent samples t-test (**p < 0.01, ***p < 0.001).
4. Discussion
In 2016, WHO proposed the ‘2016 ∼ 2021 Global Health Sector Viral Hepatitis Strategy’, which proposed the initiatives and goals to eliminate hepatitis B worldwide by 2030. However, China still faces great challenges in eliminating HBV infection due to its large number of existing infected persons (Cheng et al., Citation2019). And, the clinically standard antiviral strategy cannot fully achieve the functional cure of patients because the T cell response is dysfunctional in CHB (Gehring & Protzer, Citation2019). Fortunately, the emergence of therapeutic vaccines seems to have reversed this scenario. As an immunotherapy, vaccination with therapeutic vaccine can directly target the immune response of the body (Alexopoulou et al., Citation2020). It has become the most likely alternative therapy to achieve a functional cure or even complete HBV clearance in CHB patients (Lin & Kao, Citation2015).
The study had contrived a CHB therapeutic vaccine—V_C4HBL. It was consisted of IgV_CTLA-4 at the N-terminal and the L protein of HBV at the C-terminal two components. The L protein was encoded by intact S region of HBV which contains the S, pre-S1 and pre-S2 three gene segments (Krawczyk et al., Citation2014; Megahed et al., Citation2020). The L protein covers all surface antigens of HBV and provides the effective and specific immunogens stimulation to CHB patients (Han et al., Citation2013; Shouval et al., Citation2015). It has been confirmed that the L protein encoded by the S gene segment can induce host immune tolerance and resulting in impaired DC, NK, T cell and B cell function (Jiang et al., Citation2021). The L protein can bypass immune tolerance initiated by single L protein antigen and retain the protective role (Bian et al., Citation2017; Rapin et al., Citation2010). Furthermore, the IgV_CTLA-4 was fused with L protein. The CTLA-4 has a high affinity for CD80 (B7-1) and CD86 (B7-2) the affinity of CTLA-4 with B7 is more than 20 times that of CD28 with B7 (Karimi et al., Citation2021). This is why we consider IgV_CTLA-4 as a ‘navigator’ for the fusion protein V_C4HBL to target APCs. It can mediate the efficient binding of V_C4HBL to APCs and to improve the uptake efficiency of APCs and facilitate their presentation to T lymphocyte. Although the HBV preventive vaccine has been used safely for more than 30 years, it is ineffective for CHB patients (Maini & Burton, Citation2019). Therefore, V_C4HBL vaccine can restore or replace the innate immune response and drive adaptive immunity to circumvent immune tolerance of CHB patient, and acts as an available clinical antiviral adjunctive therapy for CHB patients.
After the IgV_CTLA-4 was fused on the N-terminal of L protein by Linker-(GGGGS)3, would the formation of L protein antigen epitopes be disturbed? In this respect, we had adopted the approach of immunoinformatics epitope prediction for verification. First, the antigen epitopes of L protein were identified by immunoinformatics, and then the antigen epitopes of V_C4HBL were also identified by same approaches. By comparing the epitopes between L protein and V_C4HBL, we found that the fusion of IgV_CTLA-4 does not interfere with the formation of HTLEs and BLEs. This may be mainly attributed to the use of IgV_CTLA-4 with a smaller molecular weight, which not only ensures that the vaccine can be targeted and efficiently binds to APCs, but also does not affect the spatial structure of the functional antigen L protein.
In order to better express the vaccine protein for in vitro and in vivo experiments, provide guiding parameters for possible mass production of the vaccine in the future, and we analyzed the physicochemical properties of L protein and V_C4HBL. In the prediction of L protein physicochemical properties, we found that the L protein was unstable and hydrophobic. The signal peptide is a short peptide chain (5–30 aa) that guides the transfer of newly synthesized proteins to the secretory pathway, and it does not participate in the composition of protein structure actually, so we first predicted and eliminated protein signal peptides before identifying antigen epitopes. Similarly, the physicochemical properties of V_C4HBL were analyzed and the results showed that the V_C4HBL was unstable and hydrophobic. In the evaluation of antigenicity and allergenicity, the immunological significance of the results was also satisfactory, that is, V_C4HBL was a non-allergic antigen with good antigenicity.
In the molecular docking, the quality of all docking models was reflected by GOAP, DFIRE and ITScore three evaluation indicators in docking server. They are statistical potentials developed by the Skolnick lab, Yaoqi Zhou lab and Xiaoqin Zou lab respectively, which are primarily used for ranking the outputted models (Huang & Zou, Citation2011; Zhou & Skolnick, Citation2011; Zhou & Zhou, Citation2002). After the independent two-sample t-test of these three indicators, we found the results of IgV_CTLA-4 fusion group are significantly better than those of non-fusion group, which hinted the addition of IgV_CTLA-4 had improved the affinity of vaccine with B7 molecules (Grimm et al., Citation2013). In the MD simulation, the investigation and analysis of RMSD, RMSF, PCA and MM/PBSA calculation showed that the docking of V_C4HBL with B7 complexes was more stable than L protein with B7 complexes. It indirectly prompted that the fusion of IgV_CTLA-4 to L protein can improve the binding of APCs to vaccine antigens.
Notably, the study had implemented the in vitro and in vivo experiments to verify the immunogenicity and antigenicity of the V_C4HBL. In the in vitro experiment, firstly, the phagocytosis of Mφ on the V_C4HBL was determined by FCM and IF experiments. We found that the Mφ can bind and devour more V_C4HBL compared with L protein. In view of the ‘classically activated’ M1 can express the CD80 and CD86 cell surface markers (Liu et al., Citation2018), the V_C4HBL better activated Mφ with the help of B7 molecules. Secondly, the cellular immunity was determined by ELISA and ELISPOT experiments. The result showed that the V_C4HBL can more significantly stimulate the response of HBV specific Th1 and Th2 lymphocytes. Thirdly, we found that the V_C4HBL can bind with the patient plasma specific antibodies in Western Blot experiment, which suggested that the V_C4HBL has good antigenicity. The immune simulation indicated that the V_C4HBL has a good potential to stimulate the body to release cytokines and antibodies. In the in vivo experiment, we found that the levels of IFN-γ, IL-4 and total IgG levels in splenocyte culture supernatant between three groups of immunized mice were significantly different, which indicated that V_ C4HBL can not only activate cellular and humoral immunity in mice, but also has a much higher effect than L protein.
In this study, the immunoinformatics techniques were used to demonstrate that the epitopes of L protein did not change before and after fusion of IgV_CTLA-4. Then the molecular docking and MD simulation techniques were used to demonstrate that IgV_CTLA-4 on V_C4HBL could interact closely with B7 molecules on APCs, and the docking process was relatively stable. Finally, the in vitro and in vivo experiments confirmed that V_C4HBL has satisfactory antigenicity and immunogenicity. To sum up, the study has contrived a novel CHB therapeutic vaccine V_C4HBL, which is expected to reverse the tolerance of CHB patients to HBV and achieve functional cure. Therefore, vaccination of V_C4HBL may be an effective method for CHB clinical treatment in the future (Bian et al., Citation2017).
Authors’ contributions
X.L and J.D provided research ideas and experimental design. Y.Z and M.Y wrote the paper, and C.Z guided and revised the writing of the paper. Y.Z, M.Y, M.A, Y.H, Z.C, R.H and Y.Y performed the experimental testing. Z.L and F.Z organized data and performed statistical analysis. All authors participated in the review and revision of the paper and approved the submission of the final version of the manuscript.
Ethics statement
The collection of blood samples from clinical patients in this study strictly followed the ethical norms of the First Affiliated Hospital of Xinjiang Medical University, and the study was approved by the ethics committee of the First Affiliated Hospital of Xinjiang Medical University (approval number: 20200320-21) and the animal Ethics Committee of First Affiliated Hospital of Xinjiang Medical University (approval number: IACUC-20200318-28).
Supplemental Material
Download MS Word (681.9 KB)Acknowledgments
We would like to thank all the staff and volunteer patients of the Infection Center of the First Affiliated Hospital of Xinjiang Medical University for their help in collecting relevant scientific research samples for this study.
Data availability statement
All generated/analyzed data from this study have been included in the article/supplementary material, please contact the authors for more detailed inquiries.
Disclosure statement
None of the authors of this study have any business or financial relationships that could be considered potential conflicts of interest.
Additional information
Funding
References
- Alexopoulou, A., Vasilieva, L., & Karayiannis, P. (2020). New approaches to the treatment of chronic hepatitis B. Journal of Clinical Medicine, 9(10), 3187. https://doi.org/10.3390/jcm9103187
- Almagro Armenteros, J. J., Tsirigos, K. D., Sønderby, C. K., Petersen, T. N., Winther, O., Brunak, S., von Heijne, G., & Nielsen, H. (2019). SignalP 5.0 improves signal peptide predictions using deep neural networks. Nature Biotechnology, 37(4), 420–423. https://doi.org/10.1038/s41587-019-0036-z
- Baek, M., DiMaio, F., Anishchenko, I., Dauparas, J., Ovchinnikov, S., Lee, G. R., Wang, J., Cong, Q., Kinch, L. N., Schaeffer, R. D., Millán, C., Park, H., Adams, C., Glassman, C. R., DeGiovanni, A., Pereira, J. H., Rodrigues, A. V., van Dijk, A. A., Ebrecht, A. C., … Baker, D. (2021). Accurate prediction of protein structures and interactions using a three-track neural network. Science (New York, N.Y.), 373(6557), 871–876. https://doi.org/10.1126/science.abj8754
- Baudi, I., Kawashima, K., & Isogawa, M. (2021). HBV-specific CD8+ T-Cell tolerance in the liver. Frontiers in Immunology, 12, 721975. https://doi.org/10.3389/fimmu.2021.721975
- Betancourt, A. A., Delgado, C. A. G., Estévez, Z. C., Martínez, J. C., Ríos, G. V., Aureoles-Roselló, S. R. M., Zaldívar, R. A., Guzmán, M. A., Baile, N. F., Reyes, P. A. D., Ruano, L. O., Fernández, A. C., Lobaina-Matos, Y., Fernández, A. D., Madrazo, A. I. J., Martínez, M. I. A., Baños, M. L., Alvarez, N. P., Baldo, M. D., … Rubido, J. C. A. (2007). Phase I clinical trial in healthy adults of a nasal vaccine candidate containing recombinant hepatitis B surface and core antigens. International Journal of Infectious Diseases: IJID: Official Publication of the International Society for Infectious Diseases, 11(5), 394–401. https://doi.org/10.1016/j.ijid.2006.09.010
- Bhattacharya, M., Sharma, A. R., Ghosh, P., Lee, S. S., & Chakraborty, C. (2021). A next-generation vaccine candidate using alternative epitopes to protect against wuhan and all significant mutant variants of SARS-CoV-2: An immunoinformatics approach. Aging and Disease, 12(8), 2173–2195. https://doi.org/10.14336/AD.2021.0518
- Bian, Y., Zhang, Z., Sun, Z., Zhao, J., Zhu, D., Wang, Y., Fu, S., Guo, J., Liu, L., Su, L., Wang, F.-S., Fu, Y.-X., & Peng, H. (2017). Vaccines targeting preS1 domain overcome immune tolerance in hepatitis B virus carrier mice. Hepatology (Baltimore, Md.), 66(4), 1067–1082. https://doi.org/10.1002/hep.29239
- Cargill, T., & Barnes, E. (2021). Therapeutic vaccination for treatment of chronic hepatitis B. Clinical and Experimental Immunology, 205(2), 106–118. https://doi.org/10.1111/cei.13614
- Cheng, Y., Zhu, Y. O., Becht, E., Aw, P., Chen, J., Poidinger, M., de Sessions, P. F., Hibberd, M. L., Bertoletti, A., Lim, S. G., & Newell, E. W. (2019). Multifactorial heterogeneity of virus-specific T cells and association with the progression of human chronic hepatitis B infection. Science Immunology, 4(32), eaau6905. https://doi.org/10.1126/sciimmunol.aau6905
- Chinese Medical Association, Chinese Medical Journals Publishing House, Chinese Society of General Practice, Editorial Board of Chinese Journal of Ceneral Practitioners of Chinese Medical Association, Expert Group of Guidelines for Primary Care of Chronic Hepatitis B. (2021). Guideline for primary care of chronic hepatitis B (2020). Chinese Journal of General Practitioners, 20, 137–149. https://doi.org/10.3760/cma.j.cn114798-20201218-01262
- Christoffer, C., Chen, S., Bharadwaj, V., Aderinwale, T., Kumar, V., Hormati, M., & Kihara, D. (2021). LZerD webserver for pairwise and multiple protein-protein docking. Nucleic Acids Research, 49(W1), W359–W365. P https://doi.org/10.1093/nar/gkab336
- Cornberg, M., Lok, A. S., Terrault, N. A., & Zoulim, F. (2020). Guidance for design and endpoints of clinical trials in chronic hepatitis B - Report from the 2019 EASL-AASLD HBV Treatment Endpoints Conference. Hepatology, 71(3), 1070–1092. https://doi.org/10.1002/hep.31030
- David, C. C., & Jacobs, D. J. (2014). Principal component analysis: a method for determining the essential dynamics of proteins. Methods in Molecular Biology (Clifton, N.J.), 1084, 193–226. https://doi.org/10.1007/978-1-62703-658-0_11
- Dimitrov, I., Bangov, I., Flower, D. R., & Doytchinova, I. (2014). AllerTOP v.2-a server for in silico prediction of allergens. Journal of Molecular Modeling, 20(6), 2278. https://doi.org/10.1007/s00894-014-2278-5
- Doytchinova, I. A., & Flower, D. R. (2007). VaxiJen: A server for prediction of protective antigens, tumour antigens and subunit vaccines. BMC Bioinformatics, 8(1), 4. https://doi.org/10.1186/1471-2105-8-4
- Farmer, J., Kanwal, F., Nikulsin, N., Tsilimigras, M. C. B., & Jacobs, D. J. (2017). Statistical measures to quantify similarity between molecular dynamics simulation trajectories. Entropy, 19(12), 646. https://doi.org/10.3390/e19120646
- Fitzmaurice, C., Allen, C., Barber, R. M., Barregard, L., Bhutta, Z. A., Brenner, H., Dicker, D. J., Chimed-Orchir, O., Dandona, R., Dandona, L., Fleming, T., Forouzanfar, M. H., Hancock, J., Hay, R. J., Hunter-Merrill, R., Huynh, C., Hosgood, H. D., Johnson, C. O., Jonas, J. B., … Naghavi, M. (2017). Global, regional, and national cancer incidence, mortality, years of life lost, years lived with disability, and disability-adjusted life-years for 32 cancer groups, 1990 to 2015: A systematic analysis for the global burden of disease study. JAMA Oncology, 3(4), 524–548. https://doi.org/10.1001/jamaoncol.2016.5688
- Fu, Y., Wu, S., Hu, Y., Chen, T., Zeng, Y., Liu, C., & Ou, Q. (2020). Mutational characterization of HBV reverse transcriptase gene and the genotype-phenotype correlation of antiviral resistance among Chinese chronic hepatitis B patients. Emerging Microbes & Infections, 9(1), 2381–2393. https://doi.org/10.1080/22221751.2020.1835446
- Gaggar, A., Coeshott, C., Apelian, D., Rodell, T., Armstrong, B. R., Shen, G., Subramanian, G. M., & McHutchison, J. G. (2014). Safety, tolerability and immunogenicity of GS-4774, a hepatitis B virus-specific therapeutic vaccine, in healthy subjects: A randomized study. Vaccine, 32(39), 4925–4931. https://doi.org/10.1016/j.vaccine.2014.07.027
- Gan, L., Jia, R., Zhou, L., Guo, J., & Fan, M. (2014). Fusion of CTLA-4 with HPV16 E7 and E6 enhanced the potency of therapeutic HPV DNA vaccine. PloS One, 9(9), e108892. https://doi.org/10.1371/journal.pone.0108892
- Gehring, A. J., & Protzer, U. (2019). Targeting innate and adaptive immune responses to cure chronic HBV infection. Gastroenterology, 156(2), 325–337. https://doi.org/10.1053/j.gastro.2018.10.032
- Grimm, F. A., Lehmler, H. J., He, X., Robertson, L. W., & Duffel, M. W. (2013). Sulfated metabolites of polychlorinated biphenyls are high-affinity ligands for the thyroid hormone transport protein transthyretin. Environmental Health Perspectives, 121(6), 657–662. https://doi.org/10.1289/ehp.1206198
- Han, Q., Lan, P., Zhang, J., Zhang, C., & Tian, Z. (2013). Reversal of hepatitis B virus-induced systemic immune tolerance by intrinsic innate immune stimulation. Journal of Gastroenterology and Hepatology, 28, 132–137. https://doi.org/10.1111/jgh.12034
- He, J., Huang, F., Zhang, J., Chen, Q., Zheng, Z., Zhou, Q., Chen, D., Li, J., & Chen, J. (2021). Vaccine design based on 16 epitopes of SARS CoV-2 spike protein. Journal of Medical Virology, 93(4), 2115–2131. https://doi.org/10.1002/jmv.26596
- He, Y., Li, J., Mao, W., Zhang, D., Liu, M., Shan, X., Zhang, B., Zhu, C., Shen, J., Deng, Z., Wang, Z., Yu, W., Chen, Q., Guo, W., Su, P., Lv, R., Li, G., Li, G., Pei, B., … Du, D. (2018). HLA common and well-documented alleles in China. HLA, 92(4), 199–205. https://doi.org/10.1111/tan.13358
- Huang, S. Y., & Zou, X. (2011). Statistical mechanics‐based method to extract atomic distance‐dependent potentials from protein structures. Proteins, 79(9), 2648–2661. https://doi.org/10.1002/prot.23086
- Jespersen, M. C., Peters, B., Nielsen, M., & Marcatili, P. (2017). BepiPred-2.0: Improving sequence-based B-cell epitope prediction using conformational epitopes. Nucleic Acids Research, 45(W1), W24–W29. https://doi.org/10.1093/nar/gkx346
- Jia, R., Guo, J. H., & Fan, M. W. (2012). The effect of antigen size on the immunogenicity of antigen presenting cell targeted DNA vaccine. International Immunopharmacology, 12(1), 21–25. https://doi.org/10.1016/j.intimp.2011.08.016
- Jiang, X., Chang, L., Yan, Y., & Wang, L. (2021). Paradoxical HBsAg and anti-HBs coexistence among chronic HBV infections: Causes and consequences. International Journal of Biological Sciences, 17(4), 1125–1137. https://doi.org/10.7150/ijbs.55724
- Jin, S., Zou, H., Zhen, J., Wang, D., He, L., & Deng, Z. (2017). Study of polymorphisms of HLA class I (-A, -B, -C) and class II (DRB1, DQA1, DQB1, DPA1, DPB1) genes among ethnic Hans from Southern China. Zhonghua yi Xue yi Chuan Xue za Zhi = Zhonghua Yixue Yichuanxue Zazhi = Chinese Journal of Medical Genetics, 34(1), 110–114. https://doi.org/10.3760/cma.j.issn.1003-9406.2017.01.026
- Karimi, A., Alilou, S., & Mirzaei, H. R. (2021). Adverse events following administration of anti-CTLA4 antibody ipilimumab. Frontiers in Oncology, 11, 624780. https://doi.org/10.3389/fonc.2021.624780
- Krawczyk, A., Ludwig, C., Jochum, C., Fiedler, M., Heinemann, F. M., Shouval, D., Roggendorf, M., Roggendorf, H., & Lindemann, M. (2014). Induction of a robust T- and B-cell immune response in non- and low-responders to conventional vaccination against hepatitis B by using a third generation PreS/S vaccine. Vaccine, 32(39), 5077–5082. https://doi.org/10.1016/j.vaccine.2014.06.076
- Li, J., Bao, M., Ge, J., Ren, S., Zhou, T., Qi, F., Pu, X., & Dou, J. (2017). Research progress of therapeutic vaccines for treating chronic hepatitis B. Human Vaccines & Immunotherapeutics, 13(5), 986–997. https://doi.org/10.1080/21645515.2016.1276125
- Li, Y., Zhu, Y., Sha, T., Chen, Z., Yu, M., Zhang, F., & Ding, J. (2021). A multi-epitope chitosan nanoparticles vaccine of canine against Echinococcus granulosus. Journal of Biomedical Nanotechnology, 17(5), 910–920. https://doi.org/10.1166/jbn.2021.3065
- Lin, C. L., & Kao, J. H. (2015). Hepatitis B virus genotypes and variants. Cold Spring Harbor Perspectives in Medicine, 5(5), a021436. https://doi.org/10.1101/cshperspect.a021436
- Liu, J., & Liu, M. (2019). Progress and challenges in achieving the WHO goal on ‘Elimination of Hepatitis B by 2030’ in China. Zhonghua Liu Xing Bing Xue za Zhi = Zhonghua Liuxingbingxue Zazhi, 40(6), 605–609. https://doi.org/10.3760/cma.j.issn.0254-6450.2019.06.001
- Liu, R., Li, X., Huang, Z., Zhao, D., Ganesh, B. S., Lai, G., Pandak, W. M., Hylemon, P. B., Bajaj, J. S., Sanyal, A. J., & Zhou, H. (2018). C/EBP homologous protein-induced loss of intestinal epithelial stemness contributes to bile duct ligation-induced cholestatic liver injury in mice. Hepatology (Baltimore, Md.), 67(4), 1441–1457. https://doi.org/10.1002/hep.29540
- Maini, M. K., & Burton, A. R. (2019). Restoring, releasing or replacing adaptive immunity in chronic hepatitis B. Nature Reviews. Gastroenterology & Hepatology, 16(11), 662–675. https://doi.org/10.1038/s41575-019-0196-9
- Megahed, F. A. K., Zhou, X., & Sun, P. (2020). The interactions between HBV and the innate immunity of hepatocytes. Viruses, 12(3), 285. https://doi.org/10.3390/v12030285
- Melenhorst, J. J., Chen, G. M., Wang, M., Porter, D. L., Chen, C., Collins, M. A., Gao, P., Bandyopadhyay, S., Sun, H., Zhao, Z., Lundh, S., Pruteanu-Malinici, I., Nobles, C. L., Maji, S., Frey, N. V., Gill, S. I., Loren, A. W., Tian, L., Kulikovskaya, I., … June, C. H. (2022). Decade-long leukaemia remissions with persistence of CD4+ CAR T cells. Nature, 602(7897), 503–509. https://doi.org/10.1038/s41586-021-04390-6
- Ott, J. J., Horn, J., Krause, G., & Mikolajczyk, R. T. (2017). Time trends of chronic HBV infection over prior decades – A global analysis. Journal of Hepatology, 66(1), 48–54. https://doi.org/10.1016/j.jhep.2016.08.013
- Pimpin, L., Cortez-Pinto, H., Negro, F., Corbould, E., Lazarus, J. V., Webber, L., & Sheron, N. (2018). Burden of liver disease in Europe: Epidemiology and analysis of risk factors to identify prevention policies. Journal of Hepatology, 69(3), 718–735. https://doi.org/10.1016/j.jhep.2018.05.011
- Polaris Observatory Collaborators. (2018). Global prevalence, treatment, and prevention of hepatitis B virus infection in 2016: A modelling study. The Lancet. Gastroenterology & Hepatology, 3(6), 383–403. https://doi.org/10.1016/S2468-1253(18)30056-6
- Rapin, N., Lund, O., Bernaschi, M., & Castiglione, F. (2010). Computational immunology meets bioinformatics: The use of prediction tools for molecular binding in the simulation of the immune system. PLoS One,.5(4), e9862. https://doi.org/10.1371/journal.pone.0009862
- Ru, Z., Yu, M., Zhu, Y., Chen, Z., Zhang, F., Zhang, Z., & Ding, J. (2022). Immmunoinformatics‐based design of a multi‐epitope vaccine with CTLA‐4 extracellular domain to combat Helicobacter pylori. FASEB Journal: Official Publication of the Federation of American Societies for Experimental Biology, 36(4), e22252. https://doi.org/10.1096/fj.202101538RR
- Sargsyan, K., Grauffel, C., & Lim, C. (2017). How molecular size impacts RMSD applications in molecular dynamics simulations. Journal of Chemical Theory and Computation, 13(4), 1518–1524. https://doi.org/10.1021/acs.jctc.7b00028
- Sarin, S. K., Kumar, M., Eslam, M., George, J., Al Mahtab, M., Akbar, S. M. F., Jia, J., Tian, Q., Aggarwal, R., Muljono, D. H., Omata, M., Ooka, Y., Han, K.-H., Lee, H. W., Jafri, W., Butt, A. S., Chong, C. H., Lim, S. G., Pwu, R.-F., & Chen, D.-S. (2020). Liver diseases in the Asia-Pacific region: A Lancet Gastroenterology & Hepatology Commission. The Lancet. Gastroenterology & Hepatology, 5(2), 167–228. https://doi.org/10.1016/S2468-1253(19)30342-5
- Shouval, D., Roggendorf, H., & Roggendorf, M. (2015). Enhanced immune response to hepatitis B vaccination through immunization with a Pre-S1/Pre-S2/S vaccine. Medical Microbiology and Immunology, 204(1), 57–68. https://doi.org/10.1007/s00430-014-0374-x
- Song, Y., Ma, C., Lv, H., Zhu, C., Nie, X., Wang, M., Liu, Y., Zhang, P. (2007). HLA allele polymorphism in northern Hans of China. Journal of Shandong University (Health Science), 45, 546–553. https://doi.org/10.3969/j.issn.1671-7554.2007.06.002
- Tseng, T. C., & Kao, J. H. (2017). Elimination of hepatitis B: Is it a mission possible? BMC Medicine, 15(1), 53. https://doi.org/10.1186/s12916-017-0820-x
- Venkatraman, V., Yang, Y. D., Sael, L., & Kihara, D. (2009). Protein-protein docking using region-based 3D Zernike descriptors. BMC Bioinformatics, 10, 407. https://doi.org/10.1186/1471-2105-10-407
- Wang, P., Sidney, J., Dow, C., Mothé, B., Sette, A., & Peters, B. (2008). A systematic assessment of MHC class II peptide binding predictions and evaluation of a consensus approach. PLoS Computational Biology, 4(4), e1000048. https://doi.org/10.1371/journal.pcbi.1000048
- Waterhouse, A., Bertoni, M., Bienert, S., Studer, G., Tauriello, G., Gumienny, R., Heer, F. T., de Beer, T. A. P., Rempfer, C., Bordoli, L., Lepore, R., & Schwede, T. (2018). SWISS-MODEL: Homology modelling of protein structures and complexes. Nucleic Acids Research, 46(W1), W296–W303. https://doi.org/10.1093/nar/gky427
- Wei, L., Zhao, T., Zhang, J., Mao, Q., Gong, G., Sun, Y., Chen, Y., Wang, M., Tan, D., Gong, Z., Li, B., Niu, J., Li, S., Gong, H., Zou, L., Zhou, W., Jia, Z., Tang, Y., Fei, L., … Wu, Y. (2022). Efficacy and safety of a nanoparticle therapeutic vaccine in patients with chronic hepatitis B: A randomized clinical trial. Hepatology (Baltimore, Md.), 75(1), 182–195. https://doi.org/10.1002/hep.32109
- Wilkins, M. R., Gasteiger, E., Bairoch, A., Sanchez, J. C., Williams, K. L., Appel, R. D., & Hochstrasser, D. F. (1999). Protein identification and analysis tools in the ExPASy server. Methods in Molecular Biology (Clifton, N.J.), 112, 531–552. https://doi.org/10.1385/1-59259-584-7:531
- Xu, D.-Z., Zhao, K., Guo, L.-M., Li, L.-J., Xie, Q., Ren, H., Zhang, J.-M., Xu, M., Wang, H.-F., Huang, W.-X., Bai, X.-F., Niu, J.-Q., Liu, P., Chen, X.-Y., Shen, X.-L., Yuan, Z.-H., Wang, X.-Y., & Wen, Y.-M. (2008). A randomized controlled phase IIb trial of antigen-antibody immunogenic complex therapeutic vaccine in chronic hepatitis B patients. PloS One,.3(7), e2565. https://doi.org/10.1371/journal.pone.0002565
- Yin, Y., Wu, C., Song, J., Wang, J., Zhang, E., Liu, H., Yang, D., Chen, X., Lu, M., & Xu, Y. (2011). DNA immunization with fusion of CTLA-4 to hepatitis B virus (HBV) core protein enhanced Th2 type responses and cleared HBV with an accelerated kinetic. PLoS One,.6(7), e22524. https://doi.org/10.1371/journal.pone.0022524
- Yu, M., Zhu, Y., Li, Y., Chen, Z., Li, Z., Wang, J., Li, Z., Zhang, F., & Ding, J. (2022). Design of a recombinant multivalent epitope vaccine based on SARS-CoV-2 and its variants in Immunoinformatics approach. Frontiers in Immunology, 13, 884433. https://doi.org/10.3389/fimmu.2022.884433
- Yu, M., Zhu, Y., Li, Y., Chen, Z., Sha, T., Li, Z., Zhang, F., & Ding, J. (2021). Design of a Novel Multi-Epitope Vaccine Against Echinococcus granulosus in Immunoinformatics. Frontiers in Immunology, 12, 668492. https://doi.org/10.3389/fimmu.2021.668492
- Zhang, L., & Bansal, M. B. (2020). Role of Kupffer cells in driving hepatic inflammation and fibrosis in HIV infection. Frontiers in Immunology, 11, 1086. https://doi.org/10.3389/fimmu.2020.01086
- Zhang, T.-Y., Guo, X.-R., Wu, Y.-T., Kang, X.-Z., Zheng, Q.-B., Qi, R.-Y., Chen, B.-B., Lan, Y., Wei, M., Wang, S.-J., Xiong, H.-L., Cao, J.-L., Zhang, B.-H., Qiao, X.-Y., Huang, X.-F., Wang, Y.-B., Fang, M.-J., Zhang, Y.-L., Cheng, T., … Xia, N.-S. (2020). A unique B cell epitope-based particulate vaccine shows effective suppression of hepatitis B surface antigen in mice. Gut, 69(2), 343–354. https://doi.org/10.1136/gutjnl-2018-317725
- Zhou, H., & Skolnick, J. (2011). GOAP: A generalized orientation-dependent, all-atom statistical potential for protein structure prediction. Biophysical Journal, 101(8), 2043–2052. https://doi.org/10.1016/j.bpj.2011.09.012
- Zhou, H., & Zhou, Y. (2002). Distance‐scaled, finite ideal‐gas reference state improves structure‐derived potentials of mean force for structure selection and stability prediction. Protein Science : A Publication of the Protein Society, 11(11), 2714–2726. https://doi.org/10.1110/ps.0217002