
 ?Mathematical formulae have been encoded as MathML and are displayed in this HTML version using MathJax in order to improve their display. Uncheck the box to turn MathJax off. This feature requires Javascript. Click on a formula to zoom.
Abstract
One of the most prevalent ailments is kidney disease. Effective therapies for chronic renal disease are hard to come by. As a result, there is significant clinical and social interest to predict and develop novel compounds to treat renal disorders. So, specific natural products have been employed in this study because they have protective effects against kidney diseases. When taken orally, natural products can help protect against or lessen the severity of the kidney damage caused by high fructose intake, a high-fat diet, and both Type I and Type 2 diabetes. Reduced podocyte injury, a contributor to albuminuria in diabetic nephropathy, reduces renal endothelial barrier function disruption due to hyperglycemia, as well as urinary microalbumin excretion and glomerular hyperfiltration. Multiple natural products have been shown to protect the kidneys from nephrotoxic chemicals such as LPS, gentamycin, alcohol, nicotine, lead, and cadmium, all of which can persuade acute kidney injury (AKI) or chronic kidney disease (CKD). Natural compounds inhibit regulatory enzymes for controlling inflammation-related diseases. For this, use computational methods such as drug design to identify novel flavonoid compounds against kidney diseases. Drug design via computational methods gaining admiration as a swift and effective technique to identify lead compounds in a shorter time at a low cost. In this in-silico study, we screened The Natural Product Atlas based on a structure-based pharmacophore query. Top hits were analyzed for ADMET analysis followed by molecular docking and docking validation. Finally, the lead compound was simulated for a period of 200 ns and trajectories were studied for stability. We found that NPA024823 showed promising binding and stability with the AIM2. This research work aims to predict novel anti-inflammatory compounds against kidney diseases to inhibit kidney inflammasome by targeting the AIM2 protein. So, in initial preclinical research, there will be lower failure rates that demonstrate safety profiles against predicted compounds.
Communicated by Ramaswamy H. Sarma
Introduction
Inflammasomes, cytosolic receptors of the inborn immune system, oversee detecting danger signals and activating inflammatory responses. The upstream sensor/receptor protein, the downstream effector protein, and the connecter protein ASC (apoptosis-associated speck-like protein containing a CARD) make an inflammasome (Abdul-Sater & Philpott, Citation2016; Komada et al., Citation2018). Several cytosolic pattern recognition receptors (PRRs) that classify based on structure and recognize cytosolic and nuclear pathogen double-stranded DNA are thought to cause inflammasomes to oligomerize. The adaptor protein of active inflammasomes further activates caspase-1 and effector protein to induce pyroptosis and apoptosis in cells, making it a crucial part of the inborn immune system. In reaction to poisons in the body, it also causes apoptosis (Xiang et al., Citation2020).
Inflammasome activation is the main host-based innate immune mechanism linked to a range of inflammatory illnesses, and it is crucial for the advancement of kidney diseases. Asthma, cancer, diabetes, Alzheimer’s, atherosclerosis, and other microbial and non-microbial disorders that affect the heart, colon, lungs, and liver have also been related to inflammasomes (Zhang, Citation2020). It also plays a crucial role in autoimmune illnesses like psoriasis by detecting host DNA. Recently, kidney issues have gotten more attention than other issues (Dombrowski et al., Citation2011; Komada et al., Citation2018). Kidney diseases are a significant and growing public health issue worldwide. Renal illness is thought to affect 8–16% of people globally, with treatment costing more than $130 billion (Imig et al., Citation2021; Jha et al., Citation2013). Inborn immunity is commonly implicated in the onset and development of renal inflammation. Renal chronic diseases play a significant part in the pathophysiology and development of inflammation. It also contributes significantly to the onset of renal fibrosis. Inflammation may make it harder for the kidneys to filter excess water and waste. End-stage renal disease, chronic kidney disease, and finally kidney failure can all be caused by the severe and occasionally deadly condition known as kidney inflammation. Due to these causes, the inflammasome is now thought of as a desirable and viable therapeutic target for several renal illnesses (Tucker et al., Citation2015; Turner et al., Citation2014).
The inflammasomes NLRP1, IPAF, NOD-, LRR-, NLRC4, NLRP3, and AIM2 are categorized based on their structural characteristics. An extensively researched non-NLR protein associated with renal diseases is AIM2, which is expressed in the kidneys. AIM2 is an essential member of the PYHIN family and an inflammasome component. Its pyrin (PYD) at the N terminal forms protein-protein interactions that activate the connecter protein ASC and indorse pyroptotic cell demise in cells comprising caspase-1. It charged HIN domain senses and quandaries to potentially harmful cytoplasmic dsDNA via electrostatic attraction. The AIM2 inflammasome is connected to kidney problems and then controls renal damage, swelling, and fibrosis by building multiprotein podiums for caspase initiation (Fernandes-Alnemri et al., Citation2009; Komada et al., Citation2018; Schattgen & Fitzgerald, Citation2011). In the lack of dsDNA, PYD and HIN domain interaction retains the receptor auto-inhibited. AIM2 inhibition in the occurrence of cytosolic DNA decreases inflammasome stimulation, which in turn reduces inflammation-related diseases this renal kidney disease. The study focused on the interferon-inducible protein AIM2, which has been widely investigated and linked to the etiology of renal diseases (Jin et al., Citation2012).
Natural remedies are gradually gaining popularity for the treatment of kidney ailments all around the world because they don’t have any unfavorable side effects. These substances consume an extensive range of functions in biotic systems. Flavonoids, a family of less-molecular-weight phenolic chemicals, are gaining popularity due to their multiple biological benefits, comprising protection against kidney disorders and usage in nutraceutical, pharmacological, medical, and enhancing applications (Atanasov et al., Citation2021; Panche et al., Citation2016). Since they have no negative lateral effects, natural compounds are quickly acquiring acceptance for the handling of renal diseases all around the world. These compounds play a large variety of roles in biological processes. Because of their numerous biological effects, such as protection against kidney illnesses and practice in nutraceutical, pharmacological, therapeutic, and cosmetic submissions, flavonoids, a group of low-molecular-weight phenolic structures, are becoming more and more popular (Cao et al., Citation2022). Natural products have a big influence on the treatment and prevention of inflammatory disorders such as kidney disease because of their effects on immune cell activation, maturation, and signaling transduction. These outcomes may impede transcription factors or regulatory enzymes that are essential for controlling inflammation (Ginwala et al., Citation2019). Therefore, utilizing information from The Natural Product Atlas database, a variety of acute and chronic human ailments have been investigated for their potential anti-inflammatory, antioxidant, anti-cardiovascular, neuroprotective, and effective anticancer effects (Kopustinskiene et al., Citation2020; Serafini et al., Citation2010). We need a variety of evaluation methodologies to draw conclusions that are significant from a substance’s biological activity. In this study, we’ll concentrate on using a few bioinformatics tools to carry out our research (Iqbal et al., Citation2020).
Materials and methods
Target retrieval from RCSB PDB
The 3D structure of the targeted protein interferon-inducible protein AIM2 was downloaded from RCSB PDB by using its specific PDB ID 3RN2 (Jin et al., Citation2012). PDB, the online internet information portal provides access to 3D structural data of macromolecules (proteins, DNA, and RNA) (Berman et al., Citation2000).
Target protein optimization and minimization
The missing residues were filled in using MODELLER (Eswar et al., Citation2006). The protein crystal structure was optimized and minimized using Swiss PDB Viewer and RAMPAGE (Guex & Peitsch, Citation1997). RAMPAGE created a Ramachandran Plot that revealed no protein conflicts. The plot also shows which residues are in the favored, allowed, and outlier zones (Ho & Brasseur, Citation2005).
Database preparation
The Natural Products Atlas, a comprehensive database that contains natural compounds, was downloaded from PubChem, and drug-like behavior molecules were chosen using the Lipinski criterion. There were 32552 compounds in all (van Santen et al., Citation2019).
Pharmacophore modeling and virtual screening
The pharmacophore model was created using the Molecular Operating Environment software. The pharmacophore model was created based on the co-crystallized structure and already reported inhibitors of our target proteins. Virtual screening is a technique of drug discovery that searches through libraries of molecules for structures that have the highest probability of binding to a therapeutic target on the bases of distinct descriptors. This was carried out with the help of MOE software against the Natural Product Atlas database (Ulc, Citation2015).
Molecular docking and docking validation
The top 20 compounds from pharmacophore-based virtual screening were chosen after sorting hits by their pharmacophore-fit RMSD score for 3RN2. Using AutoDock Vina (Trott & Olson, Citation2010), these top 20 compounds were docked with receptors and analyzed their binding affinities and protein-ligand interactions. PyMOL (Mura et al., Citation2010) was used to create complex receptor and ligand files, whereas BIOVIA Discovery Studio (Systèmes, Citation2022) was applied to find interactions in two dimensions. Molecules are prepared using AutoDock Tool (Goodsell et al., Citation2021). For molecular docking analyses, AutoDock Vina was used to test the top-ranked compounds. Before docking, we remove all water molecules and ions to achieve accurate outcomes. Swiss PDB Viewer minimized the protein. First, the ligand is preprocessed by calculating its torsion angle and root and saving the file in 'pdbqt’ format. The Coleman charges and the Lamarckian genetic algorithm are then used to prepare the protein. Docking was performed on a previously produced protein target. The grid box was used with dimensions of center_x = −12.3075, center_y = −3.9164, center_z = −23.6424, size_x = 62.0059221268, size_y = 44.0318692589, and size_z = 44.5199591112.
Recent studies have demonstrated the value of molecular docking but also its drawbacks, notably in terms of discovering inactive molecules. The use of 'universal’ energy-based scoring systems, which simplify complex molecular interactions, poses the problem of potential false positives. This setting governs the operation of our study, which focuses on the structural investigation of AIM2 utilizing PDB data (code = 3RN2). To enable the effective discovery of pharmacologically active molecules in drug development, we underline the necessity for caution when interpreting docking data and push for a balance between computational predictions and experimental validations (Cerón-Carrasco, Citation2022). To address this problem, we did molecular docking validation.
The computer-generated screening was conducted to evaluate the most qualified entrants using the best scoring methodology. The top-scoring algorithms were created utilizing a decoy dataset of active and inactive ligands to filter the unidentified compounds. The useful decoy dataset was created using a Database of Useful Decoys Enhanced (Mysinger et al., Citation2012). The two-dimensional structures of the chosen compounds were produced in Data Warrior using the SMILES of the decoys (Sander et al., Citation2015). The selected target protein was docked to both real and fake substances. Using the receiver operating characteristic curve (ROC curve), which awarded active ligands more points than inactive ligands, the validity of the chosen scoring functions was evaluated. The ROC curve is calculated using a script written in R (http://www.ub.edu/cbdd/?q=content/how-calculate-roc-curves) (Carmona, Citation2013; Empereur-Mot et al., Citation2015).
Toxicity analysis
To regulate the drug correspondence and toxicity features of ligands, the pkCSM (Pires et al., Citation2015) and QikProp developed by Professor William L. Jorgensen (Laoui & Polyakov, Citation2011) were utilized that are reported as essential and valuable tools for the evaluation of important druglike descriptors like adsorption, distribution, metabolism, excretion, and toxicity (ADMET). These tools are also employed for forecasting lead correspondence concerning mutagenicity and carcinogenicity.
Lead identification
The most efficient inhibitors were determined using the docking score, RMSD values, protein-ligand interactions, lead and drug-likeness analysis, lead, and drug-likeness analysis, lead and drug-likeness analysis, and toxicity analysis studies such as Molecular Weight (MW), Hydrogen Bond Donner (HBD), Hydrogen Bond Acceptor (HBA), rings, Polar Surface Area (PSA), rotatable bonds, Blood-Brain Barrier, and Ames Toxicity. As potential anti-aggregation inhibitors, the substances with the lowest binding affinities, lowest RMSD values, highest lead likeness, and best interactions were chosen.
MD simulation, PCA and DCCM
To study 200 ns MD simulations, Schrödinger LLC's Desmond software module was employed. Receptor-ligand docking, which provides a stationary representation of the molecule’s attraction location at the protein’s active binding site, was the first and most important step in molecular dynamics modeling (Bowers et al., Citation2006; Ferreira et al., Citation2015). In physiological contexts, MD simulations frequently forecast the ligand binding rank by including Newton’s classical formula of motion (Hildebrand et al., Citation2019; Rasheed et al., Citation2021).
The receptor-ligand complex underwent preprocessing (optimization and minimization) using Maestro. Steric conflicts, weak associates, and slanted geometries were all removed throughout this procedure. All structures were created using the System Builder tool, and the TIP3P (Intermolecular Interaction Potential 3 Points Transferable) was the solvent model, and an orthorhombic grid was used with the OPLS5 force field (Shivakumar et al., Citation2010). Physiological conditions were replicated during the simulation period by using 300K temperature and 1 atm pressure, while the models were neutralized by opposite ions and 0.15 M sodium chloride was administered. Before the simulation, the structures were made more flexible. Trajectories were stored for analysis after each 100 ps, and RMSD was accustomed to gauge the steadiness of the protein-ligand combination throughout time. Principal component analysis (PCA) and dynamic cross-correlation matrix (DCCM) were investigated using the 'Bio3D' package of R (Grant et al., Citation2021).
Molecular mechanics and generalized born surface area (MM-GBSA) calculations
The binding free energy (Gbind) of the protein-ligand complex was generally calculated using molecular mechanics throughout MD simulations of AIM2 complexed with NPA024823 using the Born surface area (MM-GBSA) module of prime. The OPLS5 force field, the VSGB solvent model, and rotamer search techniques were used to determine the binding free energy. After the MD run, the MD trajectory frames were selected at intervals of 10 ns. It was essential to use EquationEq. (1)(1)
(1) to obtain the overall free energy binding.
(1)
(1)
dGbind stands for the binding free energy, Gcomplex for the complex free energy, Gprotein for the free energy of the target protein, and Gligand for the free energy of the ligand.
Results and discussion
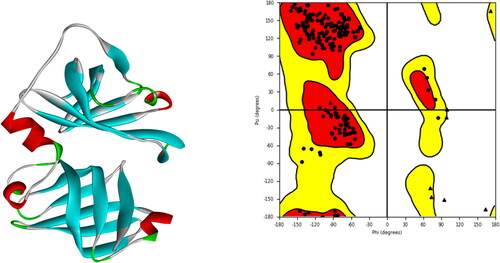
Protein Data Bank provided the target protein’s (3RN2) 3D structure. The weight of the whole structure is 59.60 kDa. It has cyclic-C2 global symmetry and homo 2-mer A2 stoichiometry. Following the addition of missing residues, optimization, and minimization, the protein structure is shown in along with the corresponding Ramachandran plot. 99% of the structure was of good quality, with highly favored findings. Glycine and proline are depicted as triangles and squares, respectively, while all other residues are shown in the figure as circles. The ‘favored’ locations are in orange, the ‘allowed’ areas are in yellow, and the ‘disallowed’ parts are in white.
Figure 1. Protein’s 3D structure was taken from the PDB along with a Ramachandran plot showing various regions of the target protein’s structure.
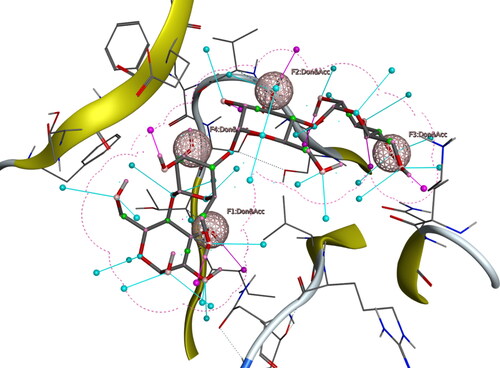
For the construction of the pharmacophore model via Molecular Operating Environment (MOE), the complex compounds were selected. , shown combined pharmacophoric features on the bases of matching properties. Hydrophobic centroids, hydrogen bond acceptors or donors, aromatic rings, cations, and anions are common pharmacophoric characteristics. These pharmacophoric locations can be found either on the ligand itself, or they can be projected points in the receptor. For 3rn2, F1, F2, F3, and F4 stand for a hydrogen bond acceptor as well as a donor functional group. For virtual screening, The Natural Product Atlas database was utilized after pharmacophore modeling to identify compounds with similar attributes to the pharmacophore model. The Natural Products Atlas was built using FAIR principles (Findable, Accessible, Interoperable, and Reusable) which interlinked with other databases of natural products. A library of 32552 compounds was created using the PubChem data source. The top 20 compounds from pharmacophore-based virtual screening were chosen after sorting 50 hits by their pharmacophore-fit RMSD score for 3rn2.
Figure 2. Ligand based pharmacophore and selected ligand fit on pharmacophore hypothesis.
AutoDock Vina performed the docking of the top hits. ADMET (absorption, distribution, metabolism, excretion, and toxicity) study was accomplished via QikProp and pkCSM. The top 10 compounds are included in based on ADMET and docking findings.
Table 1. Table showing ADMET properties, binding affinity, and pharmacophore score of top compounds.
shows the predicted number of hydrogen bonds between the solute and water molecules, donorHB, and the molecular weight, mol_MW, which should be between 130.0 and 725.0. AccptHB is a non-integer figure that can fall within the acceptable range of 0.0 to 6.0. It represents the anticipated number of hydrogen bonds that the solute will accept from water molecules in an aqueous solution. This is a result of the value being an average over a variety of combinations. Values may not always be integers since they are computed as the average of several states. It works in the range of 2.0 and 20.0. QPlogPo/w is used to represent the octanol/water partition coefficient, which is thought to be in the range of −2.0 to 6.5. Negative values below −5 are cause for alarm. QPPCaco Caco-2 cell permeability prediction, expressed as some nanometers per second. The gut-blood barrier can be mimicked using Caco2 cells. The results of QikProp are for passive transport only. In the range of 0–25, consider it poor, and anything beyond 500 is excellent. QPlogBB Expected brain/blood separation ratio. Dopamine and serotonin, for instance, are CNS-negative because they are too polar to cross the blood-brain barrier, with predicted ranges of −3.0 to −1.2 when using QikProp to predict orally administered drugs. QPlogKhsa and Human serum albumin binding predictions range from −1.5 to 1.5. The selected ligand showed zero violation of the rule of five and the number of likely metabolic reactions is one in an acceptable range. The compound showed medium human qualitative oral absorption.
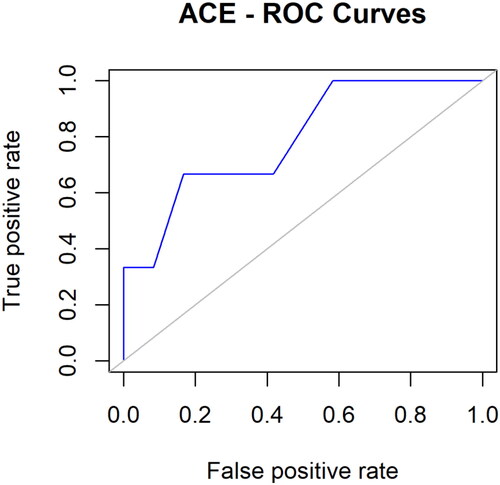
Visual representations of the correlation among test specificity and sensitivity candidates were created using ROC curves. The proportion of real positives, the percentage of false positives, and the fraction of true negatives were used to produce the ROC curves. The compounds selected for molecular docking experiments were validated using the recommended ROC curves pattern, guaranteeing that they are active ligands rather than inert ligands (decoys). Additionally, it was found that the anticipated pattern focused on the top-rated compounds in the selected database’s active ligands. In , the area under the curve was 0.7917. Redocking the co-crystallized ligand with the protein further verified the docking. Therefore, we discovered that the docked ligand was bound to the same protein binding pocket as the actual ligand. In Figure S5, a docked ligand and cocrystal ligand are superimposed.
Figure 3. ROC curves of docking validation score.
In this study, AutoDock Vina served as the main docking program for virtual screening. In the realm of molecular docking and virtual screening, AutoDock Vina is a commonly used tool that is renowned for its efficiency and effectiveness in predicting ligand-receptor binding interactions. Several significant advantages of AutoDock Vina include its speed, user-friendly interface, and capacity to handle flexible ligands and receptors. It has proven useful in various prior investigations. It is a good option for virtual screening because of these capabilities, especially for projects that call for extensive ligand screening and when computational resources are an issue.
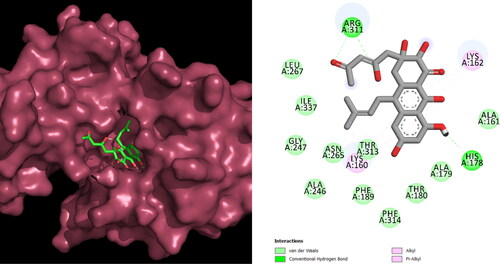
Following lead identification, one compound (ID: NPA024823) was discovered as the most active of all compounds. shows the interaction of the top ligand with protein in 2d and 3d representation. Its binding affinity was −8.1 kcal/mol. The residues in the binding pocket interacting with the ligand are ARG_A:311, LYS_A:162, HIS_A:178, THR_A:313, and LYS_A:160. All bonded and nonbonded interactions are shown in . There is information about the natural substance neosartoricin B, which is discovered in Trichophyton tonsurans. The O-diacetyl analog of the immunosuppressive drug neosartoricin A is called neosartoricin B (Yin et al., Citation2013). The properties of the best one is shown in . Molecular dynamics was used to mimic the ideal chemical combination with the protein target for 200 ns. Desmond’s simulated pathways were investigated. MD trajectory analysis was used to determine values for root-mean-square-deviation (RMSD) and root-mean-square-fluctuation (RMSF), as well as interactions between proteins and ligands.
Figure 4. Interactions of the lead compound with protein target showing interacting residues and length of the bond.
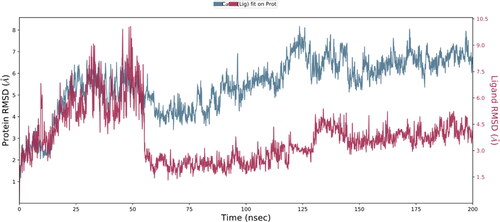
The time-dependent rise in the RMSD values for C-alpha atoms in ligand-bound proteins is seen in . The complexed NPA024823-3rn2 protein stabilized at 20 ns, according to the RMSD plot. Once the equilibrium is achieved, the RMSD stays in the range of 1.5 Angstrom for the rest of the run, which is fine. The protein structure (PDB ID: 3rn3) is shown to have an increasing RMSD at the same pace and with very little variation. The experiment validated the general belief that the building was sturdy. Ligand fit on protein got equilibrium at 50 ns. After that, throughout the simulation, there was no significant change in the Ligand Fit to Protein. The RMSD numbers would fluctuate suddenly, sometimes going up and sometimes down. After equilibrium was reached, there was no change in the ligand’s RMSD. To validate the molecular dynamics simulation experiment we rerun the protein-ligand complex at 200 ns. We found that the 2nd run gave the same results with no significant deviation. Results of 2nd run are shown in supplementary figures from Figures S1–S4.
Figure 5. Root mean square distance (RMSD) changes over time between the C-alpha atoms of proteins and their ligand (NPA024823-3rn2). On the left Y axis, protein RMSD shifts over time are displayed. The right Y-axis displays changes in ligand root-mean-square distance (RMSD) over time.
Principal component analysis, or PCA, is used to describe protein dynamics. During MD simulations, observing collective trajectory movements is a useful technique. Graph of the first 20 modes of motion (NPA024823-3rn2)'s eigenvalues (protein) vs eigenvector index (eigenmode) (). The eigenvalues display hyperspace eigenvector variations. In molecular dynamics, eigenvectors with greater eigenvalues regulate the proteins’ total movement. The upper five eigenvectors in our model demonstrated principal changes and had greater eigenvalues (20.3 to 61.3%) compared to the remaining eigenvectors, which had low eigenvalues (David & Jacobs, Citation2014). More than half of all modifications were covered by the first three PCs (PC1, PC2, and PC3) on the plot. According to : Plots showed that PC1 clusters had the largest variability (20.2%), followed by PC2 (12.9%), and PC3 (9%). In addition to having a farther compact form than PC1 and PC2 due to its low variability, PC3 is anticipated to have the most stable protein-ligand binding. Simple clustering in the PC subspace revealed structural variations between each group, with blue exhibiting the most mobility, white exhibiting intermediate mobility, and red exhibiting less flexibility.
Figure 6. (A) Principal Components analysis plotting of eigenvalue vs. Variance% (NPA024823-3rn2). the various regions are displayed using three separate components. Variations in PC1, PC2, and PC3 are correspondingly 20.0 percentile, 12.9 percentile, and 9.0 percentile. For 107876-3rn2, see (B) a complex DCCM. The positive and negative associations between the residues are represented by the colors cyan and purple, respectively.
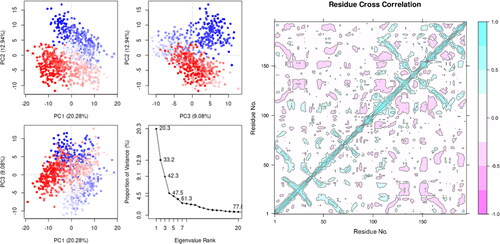
The high pairwise cross-correlation coefficient value of NPA024823 and the 3rn2 protein on the cross-correlation map () demonstrated their considerable association with one another. Compared to blue, which symbolizes correlated residues (>0.8), magenta represents anti-correlated residues (-0.4). The fact that the 3rn2 protein and ligand have a significant number of pairwise correlated residues indicates that their binding link is persistent.
displays the RMSF value for the protein that is ligand-coupled. According to MD trajectories (), residues in C-terminus and N-terminus showed comparatively high values of RMSF. Residues that are in contact with ligands showed lower values of RMSF. Examples of secondary structural traits that are tracked throughout the simulation (SSE) are helix and strands. In the graph below, SSE is plotted against the residue index to display its distribution across the protein structure. 1.39% of the whole 48.66% was made up of helix, whereas 47.27% was made up of strands.
Figure 7. Residue-wise root mean square fluctuation (RMSF) of protein complexed with ligand.
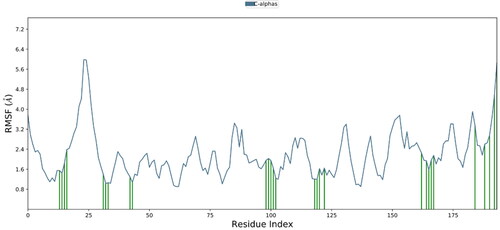
Figure 8. Depending on the residue index, proteins’ secondary structural components are distributed among protein-ligand complexes. The red columns stand in for alpha helices, while the blue ones are for beta strands.
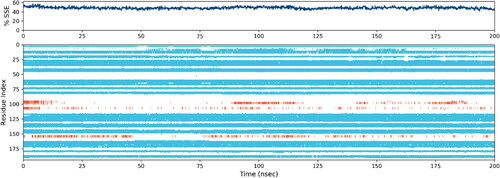
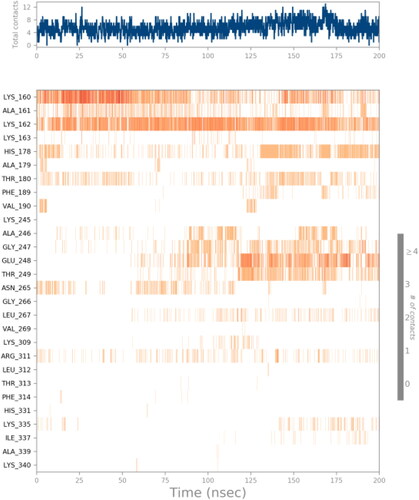
According to , hydrogen bonds account for the great majority of the significant ligand-protein interactions discovered by MD. For the amino acids LYS_160, ALA_161, LYS_162, HIS_178, THR_180, and GLU_248 hydrogen bonding is extremely important. During the simulation, the interaction between the ligand and protein may be observed. according to the graph below. On this page, a timeline illustrates the contacts and interactions (H-bonds, hydrophobic, ionic, and water bridges) covered on the previous page. We can count the number of different interactions between the protein and ligand at the top. The panel at the bottom shows which residues are interacting with the ligand for each frame of the trajectory. Some residues, shown in a darker orange, make many independent interactions with the ligand, as indicated by the scale on the plot’s right.
Figure 9. Protein-ligand contact heatmap throughout the trajectory.
We MMGBSA to calculate the binding energies of protein-ligand complexes. Each AIM2-NPA024823 complex’s binding free energy and additional non-bonded interaction energies were investigated about one another. Totaling binding energy of −37.5398 kcal/mol, NPA024823 binds to AIM2. Gbind is controlled in non-bonded interactions such as Coulomb, Packing energy showing pi-pi interactions, Hydrogen bonding energy, Lipo, and Van der Waals (). Complete results of MMGBSA after every 10 ns are shown in Table S1. All nonbonded types of energies contribute to the total binding energy of protein and ligand. On the other hand, the GbindSolvGB and Gbind Covalent energies made the smallest contributions to the average binding energies as a whole. It was also shown that the AIM2-NPA024823 complexes included committed H-bonds with residues based on the GbindHbond values. As a result, the binding energy identified from the docking data was fully validated by the MM-GBSA estimations generated from the MD simulation trajectories.
Table 2. Calculation of NPA024823's average MM-GBSA binding energy using AIM2 per 10 ns using MD simulation trajectories.
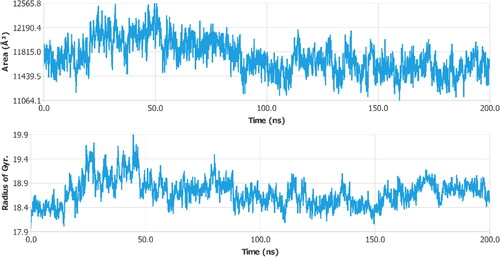
The relationship between a ligand’s solvent-accessible surface area (SASA) and simulation time provides details on the ligand’s behavior inside the enzyme’s binding pocket. When a ligand binds to a protein, the solvent-accessible surface area (SASA), which measures the protein’s exposure to the solvent, may determine if the protein is in its natural shape. Here, the target protein 3rn2's SASA was evaluated when it was attached to the ligand (). Complexes’ SASA differed somewhat from the permitted limits. The ligand was bound to 3rn2 with an average SASA value of 11736.74 ± 263.1398. These findings imply that the ligand maintained a stable shape inside the binding cavity of 3rn2. The radius of gyration (Rg) refers to how a protein’s atoms are arranged along its axis. The distance between the spinning point and the location where the energy transfer has the greatest impact is measured as length Rg. The identification of different types of polymers, including proteins, is made easier by the application of this conceptual notion. Rg and distance measurements are the two most crucial parameters for figuring out a macromolecule’s structural activity. A conformational shift occurs when a ligand/lead molecule attaches to a protein, which alters the radius of gyration. A sophisticated computer method for calculating the radius of gyration may be used to track a protein’s compactness, which is directly connected to the rate of folding of a protein. shows the fluctuation in Rg of the ligand attached to a protein (3rn2) as a function of simulation duration. The findings demonstrate that during the simulation, the Rg values of protein-ligand complexes varied within the allowed range. The calculated average Rg values of the lead compound-bound 3rn2 were 18.70634 ± 0.27518.
Figure 10. Radius of gyration and SASA calculated for three targets bound with ligand.
The reported ligand NPA024823 has shown effectiveness against the human interferon-inducible protein by thorough computational analysis, and it may be a promising drug to treat renal inflammasomes with fewer side effects and more advantageous outcomes. Based on the parameters used, the effective binding affinity, and the least binding energy, extensive in silico evaluations of AIM2 revealed higher efficacy and likelihood. Site-directed mutagenesis may benefit from the possible interacting residues discovered by molecular docking and simulation investigations. Overall, this study’s conclusions may be useful in developing therapeutic targets for renal inflammasomes.
Conclusion
Drug development has been studied extensively because of the potential for transdisciplinary strategies to both speed up the process and reduce overall costs. The primary objective of this research was to discover target proteins for renal inflammasomes so that a lead drug could be selected for them. To counteract the effects of natural products on the AIM2 protein, we chose substances that have this property. An artificially synthesized inhibitor, identified by the NPA024823, blocks the action of 3nr2 at its receptor. We hypothesized that this information may be used as a springboard for the creation of a drug that specifically targets kidney inflammasomes without impacting other biological functions. These findings will be helpful to researchers and might result in the creation of a brand-new drug to treat renal inflammasomes.
Authors’ contributions
Dr. Shahid Ullah designed and supervised the project with Dr. Tianshun Gao’s assistance and performed data analysis. Farhan Ullah, Wajeeha Rahman, Dr. Anees Ullah, Riffat Jehan, Muhammad Nasir Iqbal, and Iqra Ali contributed to the data analysis. Shahid Ullah wrote the manuscript. All authors reviewed the manuscript.
Supplemental Material
Download Zip (1.5 MB)Disclosure statement
There are no conflicts of interest in this publication, and the manuscript has been approved by all named authors.
Additional information
Funding
References
- Abdul-Sater, A. A., & Philpott, D. J. (2016). Inflammasomes, in Encyclopedia of Immunobiology (M.J.H. Ratcliffe (Ed.), 447–453). Academic Press.
- Atanasov, A. G., Zotchev, S. B., Dirsch, V. M., & Supuran, C. T; International Natural Product Sciences Taskforce. (2021). Natural products in drug discovery: Advances and opportunities. Nature Reviews. Drug Discovery, 20(3), 200–216. https://doi.org/10.1038/s41573-020-00114-z
- Berman, H. M., Westbrook, J., Feng, Z., Gilliland, G., Bhat, T. N., Weissig, H., Shindyalov, I. N., & Bourne, P. E. (2000). The protein data bank. Nucleic Acids Research, 28(1), 235–242. https://doi.org/10.1093/nar/28.1.235
- Bowers, K., David, E., Xu, H., Dror, R. O., Eastwood, M. P., Gregersen, B. A., Klepeis, J. L., Kolossvary, I., Moraes, M. A., Sacerdoti, F. D., Salmon, J. K., Shan, Y., & Shaw, D. E. (2006). Scalable algorithms for molecular dynamics simulations on commodity clusters. SC '06: Proceedings of the 2006 ACM/IEEE conference on supercomputing. Ieee. pp. 43–43.
- Cao, Y.-L., Lin, J.-H., Hammes, H.-P., & Zhang, C. (2022). Flavonoids in treatment of chronic kidney disease. Molecules (Basel, Switzerland), 27(7), 2365. https://doi.org/10.3390/molecules27072365
- Carmona, S. R. (2013). How to calculate ROC curves. http://www.ub.edu/cbdd/?q=content/how-calculate-roc-curves
- Cerón-Carrasco, J. P. (2022). When virtual screening yields inactive drugs: Dealing with false theoretical friends, 17(16), e202200278.
- David, C. C., & Jacobs, D. J. (2014). Principal component analysis: a method for determining the essential dynamics of proteins. Methods in Molecular Biology (Clifton, N.J.), 1084, 193–226.
- Dombrowski, Y., Peric, M., Koglin, S., Kammerbauer, C., Göss, C., Anz, D., Simanski, M., Gläser, R., Harder, J., Hornung, V., Gallo, R. L., Ruzicka, T., Besch, R., & Schauber, J. (2011). Cytosolic DNA triggers inflammasome activation in keratinocytes in psoriatic lesions. Science Translational Medicine, 3(82), 82ra38. https://doi.org/10.1126/scitranslmed.3002001
- Empereur-Mot, C., Guillemain, H., Latouche, A., Zagury, J.-F., Viallon, V., & Montes, M. (2015). Predictiveness curves in virtual screening. Journal of Cheminformatics, 7(1), 52. https://doi.org/10.1186/s13321-015-0100-8
- Eswar, N., Webb, B., Marti-Renom, M. A., Madhusudhan, M. S., Eramian, D., Shen, M.-Y., Pieper, U., & Sali, A. (2006). Comparative protein structure modeling using Modeller. Current Protocols in Bioinformatics, Chapter 5, UnU5.6. https://doi.org/10.1002/0471250953.bi0506s15
- Fernandes-Alnemri, T., Yu, J.-W., Datta, P., Wu, J., & Alnemri, E. S. (2009). AIM2 activates the inflammasome and cell death in response to cytoplasmic DNA. Nature, 458(7237), 509–513. https://doi.org/10.1038/nature07710
- Ferreira, L. G., Dos Santos, R. N., Oliva, G., & Andricopulo, A. D. (2015). Molecular docking and structure-based drug design strategies. Molecules (Basel, Switzerland), 20(7), 13384–13421. https://doi.org/10.3390/molecules200713384
- Ginwala, R., Bhavsar, R., Chigbu, D. I., Jain, P., & Khan, Z. K. (2019). Potential role of flavonoids in treating chronic inflammatory diseases with a special focus on the anti-inflammatory activity of apigenin. Antioxidants (Basel, Switzerland), 8(2) https://doi.org/10.3390/antiox8020035
- Goodsell, D. S., Sanner, M. F., Olson, A. J., & Forli, S. (2021). The AutoDock suite at 30. Protein Science, 30(1), 31–43. https://doi.org/10.1002/pro.3934
- Grant, B. J., Skjaerven, L., & Yao, X. Q. (2021). The Bio3D packages for structural bioinformatics. Protein Science, 30(1), 20–30. https://doi.org/10.1002/pro.3923
- Guex, N., & Peitsch, M. C. (1997). SWISS-MODEL and the Swiss-PdbViewer: An environment for comparative protein modeling. Electrophoresis, 18(15), 2714–2723. https://doi.org/10.1002/elps.1150181505
- Hildebrand, P. W., Rose, A. S., & Tiemann, J. K. S. (2019). Bringing molecular dynamics simulation data into view. Trends in Biochemical Sciences, 44(11), 902–913. https://doi.org/10.1016/j.tibs.2019.06.004
- Ho, B. K., & Brasseur, R. (2005). The Ramachandran plots of glycine and pre-proline. BMC Structural Biology, 5(1), 14. https://doi.org/10.1186/1472-6807-5-14
- Imig, J. D., Merk, D., & Proschak, E. (2021). Multi-target drugs for kidney diseases. Kidney360, 2(10), 1645–1653. https://doi.org/10.34067/KID.0003582021
- Iqbal, M. N., Rasheed, M. A., Awais, M., Chammam, W., Kanwal, S., Khan, S. U., Saddick, S., & Tlili, I. (2020). BMT: Bioinformatics mini toolbox for comprehensive DNA and protein analysis. Genomics, 112(6), 4561–4566. https://doi.org/10.1016/j.ygeno.2020.08.010
- Jha, V., Garcia-Garcia, G., Iseki, K., Li, Z., Naicker, S., Plattner, B., Saran, R., Wang, A. Y.-M., & Yang, C.-W. (2013). Chronic kidney disease: Global dimension and perspectives. Lancet (London, England), 382(9888), 260–272. https://doi.org/10.1016/S0140-6736(13)60687-X
- Jin, T., Perry, A., Jiang, J., Smith, P., Curry, J. A., Unterholzner, L., Jiang, Z., Horvath, G., Rathinam, V. A., Johnstone, R. W., Hornung, V., Latz, E., Bowie, A. G., Fitzgerald, K. A., & Xiao, T. S. (2012). Structures of the HIN domain:DNA complexes reveal ligand binding and activation mechanisms of the AIM2 inflammasome and IFI16 receptor. Immunity, 36(4), 561–571. https://doi.org/10.1016/j.immuni.2012.02.014
- Komada, T., Chung, H., Lau, A., Platnich, J. M., Beck, P. L., Benediktsson, H., Duff, H. J., Jenne, C. N., & Muruve, D. A. (2018). Macrophage uptake of necrotic cell DNA activates the AIM2 inflammasome to regulate a proinflammatory phenotype in CKD. Journal of the American Society of Nephrology, 29(4), 1165–1181. https://doi.org/10.1681/ASN.2017080863
- Kopustinskiene, D. M., Jakstas, V., Savickas, A., & Bernatoniene, J. (2020). Flavonoids as anticancer agents. Nutrients, 12(2), 457. https://doi.org/10.3390/nu12020457
- Laoui, A., & Polyakov, V. R. (2011). Web services as applications’ integration tool: QikProp case study. Journal of Computational Chemistry, 32(9), 1944–1951. https://doi.org/10.1002/jcc.21778
- Mura, C., McCrimmon, C. M., Vertrees, J., & Sawaya, M. R. (2010). An introduction to biomolecular graphics. PLoS Computational Biology, 6(8), e1000918. https://doi.org/10.1371/journal.pcbi.1000918
- Mysinger, M. M., Carchia, M., Irwin, J. J., & Shoichet, B. K. (2012). Directory of useful decoys, enhanced (DUD-E): Better ligands and decoys for better benchmarking. Journal of Medicinal Chemistry, 55(14), 6582–6594. https://doi.org/10.1021/jm300687e
- Panche, A. N., Diwan, A. D., & Chandra, S. R. (2016). Flavonoids: An overview. Journal of Nutritional Science, 5, e47. https://doi.org/10.1017/jns.2016.41
- Pires, D. E., Blundell, T. L., & Ascher, D. B. (2015). pkCSM: Predicting small-molecule pharmacokinetic and toxicity properties using graph-based signatures. Journal of Medicinal Chemistry, 58(9), 4066–4072. https://doi.org/10.1021/acs.jmedchem.5b00104
- Rasheed, M. A., Iqbal, M. N., Saddick, S., Ali, I., Khan, F. S., Kanwal, S., Ahmed, D., Ibrahim, M., Afzal, U., & Awais, M. (2021). Identification of lead compounds against Scm (fms10) in enterococcus faecium using computer aided drug designing. Life (Basel, Switzerland), 11(2). https://doi.org/10.3390/life11020077
- Sander, T., Freyss, J., von Korff, M., & Rufener, C. (2015). DataWarrior: An open-source program for chemistry aware data visualization and analysis. Journal of Chemical Information and Modeling, 55(2), 460–473. https://doi.org/10.1021/ci500588j
- Schattgen, S. A., & Fitzgerald, K. A. (2011). The PYHIN protein family as mediators of host defenses. Immunological Reviews, 243(1), 109–118. https://doi.org/10.1111/j.1600-065X.2011.01053.x
- Serafini, M., Peluso, I., & Raguzzini, A. (2010). Flavonoids as anti-inflammatory agents. The Proceedings of the Nutrition Society, 69(3), 273–278. https://doi.org/10.1017/S002966511000162X
- Shivakumar, D., Williams, J., Wu, Y., Damm, W., Shelley, J., & Sherman, W. (2010). Prediction of absolute solvation free energies using molecular dynamics free energy perturbation and the OPLS force field. Journal of Chemical Theory and Computation, 6(5), 1509–1519. https://doi.org/10.1021/ct900587b
- Systèmes, D. (2022). BIOVIA discovery studio.
- Trott, O., & Olson, A. J. (2010). AutoDock Vina: Improving the speed and accuracy of docking with a new scoring function, efficient optimization, and multithreading. Journal of Computational Chemistry, 31(2), 455–461. https://doi.org/10.1002/jcc.21334
- Tucker, P. S., Scanlan, A. T., & Dalbo, V. J. (2015). Chronic kidney disease influences multiple systems: Describing the relationship between oxidative stress, inflammation, kidney damage, and concomitant disease. Oxidative Medicine and Cellular Longevity, 2015, 806358–806358. https://doi.org/10.1155/2015/806358
- Turner, C. M., Arulkumaran, N., Singer, M., Unwin, R. J., & Tam, F. W. K. (2014). Is the inflammasome a potential therapeutic target in renal disease? BMC Nephrology, 15(1), 21. https://doi.org/10.1186/1471-2369-15-21
- Ulc, C. C. G. (2015). Molecular operating environment (MOE).
- van Santen, J. A., Jacob, G., Singh, A. L., Aniebok, V., Balunas, M. J., Bunsko, D., Neto, F. C., Castaño-Espriu, L., Chang, C., Clark, T. N., Cleary Little, J. L., Delgadillo, D. A., Dorrestein, P. C., Duncan, K. R., Egan, J. M., Galey, M. M., Haeckl, F. P. J., Hua, A., Hughes, A. H., … Linington, R. G. (2019). The natural products atlas: An open access knowledge base for microbial natural products discovery. ACS Central Science, 5(11), 1824–1833. https://doi.org/10.1021/acscentsci.9b00806
- Xiang, H., Zhu, F., Xu, Z., & Xiong, J. (2020). Role of inflammasomes in kidney diseases via both canonical and non-canonical pathways. Frontiers in Cell and Developmental Biology, 8, 106. https://doi.org/10.3389/fcell.2020.00106
- Yin, W.-B., Chooi, Y. H., Smith, A. R., Cacho, R. A., Hu, Y., White, T. C., & Tang, Y. (2013). Discovery of cryptic polyketide metabolites from dermatophytes using heterologous expression in Aspergillus nidulans. ACS Synthetic Biology, 2(11), 629–634. https://doi.org/10.1021/sb400048b
- Zhang, P. (2020). Chapter 15 - Novel preventive mechanisms of vitamin B6 against inflammation, inflammasome, and chronic diseases. In V.B. Patel (Ed.), Molecular nutrition (283–299). Academic Press.