
Abstract
In addition to the growth of protein structures generated through wet laboratory experiments and deposited in the PDB repository, AlphaFold predictions have significantly contributed to the creation of a much larger database of protein structures. Annotating such a vast number of structures has become an increasingly challenging task. CATH is widely recognized as one the most common platforms for addressing this challenge, as it classifies proteins based on their structural and evolutionary relationships, offering the scientific community an invaluable resource for uncovering various properties, including functional annotations. While CATH annotation involves – to some extent – human intervention, keeping up with the classification of the rapidly expanding repositories of protein structures has become exceedingly difficult. Therefore, there is a pressing need for a fully automated approach. On the other hand, the abundance of protein sequences stemming from next generation sequencing technologies, lacking structural annotations, presents an additional challenge to the scientific community. Consequently, 'pre-annotating’ protein sequences with structural features, ensuring a high level of precision, could prove highly advantageous. In this paper, after a thorough investigation, we introduce a novel machine-learning model capable of classifying any protein domain, whether it has a known structure or not, into one of the 40 main CATH Architectures. We achieve an F1 Score of 0.92 using only the amino acid sequence and a score of 0.94 using both the sequence of amino acids and the sequence of structural alphabets.
Communicated by Ramaswamy H. Sarma
Introduction
The extensive utilization of both databases CATH (Class, Architecture, Topology, Homology) (Sillitoe et al., Citation2021) and SCOP (Structural Classification of Proteins) (Andreeva et al., Citation2020) databases in the field of proteomics has been pervasive (Fox et al., Citation2015). Their significance stems from their repository of high-quality data, encompassing a vast wealth of knowledge and encyclopaedic expertise pertaining to proteins and their interrelationships (Dawson et al., Citation2016). Understanding sequence-structure-function triage is considered one of the main purposes such databases were established for. Due to the increasing quantity of information in each component of this complex relationship (sequence-structure-function), both classification hierarchies have been gaining much attention; this three-actor relationship plays a critical role in many fields in protein biology such as understanding disease mechanisms and designing proteins and drugs for therapeutic and bioengineering applications (Bepler & Berger, Citation2021). To serve the purpose, the creation of each grouping within their classification systems has been the result of meticulous, systematic analyses of protein structures, coupled with a deep understanding of protein function and evolutionary dynamics (Andreeva, Citation2016). These resources have proven invaluable to experimental and structural biologists, aiding them in the examination and exploration of protein structures akin to those relevant to their research (Andreeva & Murzin, Citation2010). Furthermore, computational biologists have harnessed the extensive spectrum of protein structural and evolutionary relationships within these databases for benchmarking and assessing protein structure comparison and prediction methods (van Kempen et al., Citation2023). The straightforward hierarchical classification system has also fostered the development of numerous tools and algorithms, effectively employed across various applications. These databases have extended their utility to other realms of protein research, including protein structure prediction and large-scale genome analyses and annotations (Lewis et al., Citation2013; Oates et al., Citation2015) as well as in predicting protein-protein interactions, correlating protein structure with enzymatic activity, and conducting investigations aimed at comprehending the intricacies of the protein repertoire (Andreeva et al., Citation2020; Chothia et al., Citation2003).
Whilst significant efforts were being made to annotate the high number of structures deposited in the PDB via experimental means, in August 2022, the PDB decided to include, alongside the ∼200,000 experimentally determined structures, ∼1 million Computed Structure Models (CSMs) predicted mainly by AlphaFold (Tunyasuvunakool et al., Citation2021). This has made the task of annotating protein structures extremely challenging. Currently, besides the standard (experimentally-determined) database of protein structures for which both CATH and SCOP have already fallen short (73% and 56%, respectively—See ), all computed structure models obtained from the AlphaFold Database (Alpha Fold DB) (Varadi et al., Citation2022)—a collaborative effort between the European Bioinformatics Institute (EMBL-EBI) and DeepMind – lack any CATH/SCOP official annotations in the PDB. The size of the overall AlphaFold database currently exceeds 214 million, and only a tiny fraction (∼1 M) has been added to the PDB (the latest set was added in February 2023) after passing the predicted local distance difference test (pLDDT) quality/confidence threshold; further information on pLDDT and the process AlphaFold adopts to evaluate their models can found in the literature (Tunyasuvunakool et al., Citation2021). In general, two main approaches have been employed for CATH/SCOP classification/annotation purposes and can be simply described as (1) sequence-based and (2) structure-based. Whilst the ultimate goal for both approaches is detecting homologous proteins, the former relies on sequence similarity search, the latter uses structural alignment methodologies (superpositions). However, challenges have arisen; accuracy in detecting distant evolutionary relationships and the inefficiency in handling the vast number of structures, respectively (van Kempen et al., Citation2023).
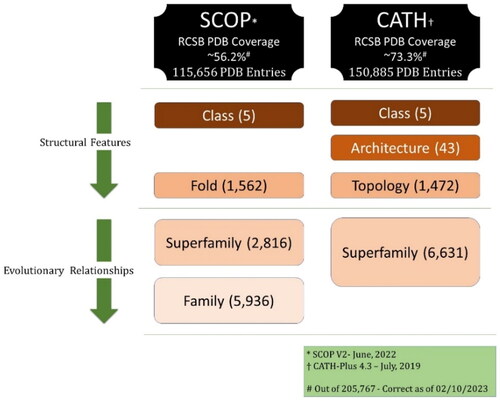
Figure 1. Schematic comparison between SCOP and CATH.
One way to help annotate those structures has been to employ machine learning (ML) and/or deep learning (DL) algorithms (Bileschi et al., Citation2022; Nallapareddy et al., Citation2023). Such algorithms have proven effective in addressing various challenges within not only proteomics but also genomics and transcriptomics domains. An important step is required when utilizing machine learning algorithms with biological sequence data that involves converting a sequence into a numeric input vector. Literature has documented numerous feature extraction techniques that can capture numerical insights from biological sequences (Bonidia et al., Citation2022; Liu et al., Citation2015; Liu et al., Citation2019; Chen et al., Citation2020; Bonidia et al., Citation2021). Additionally, some of them are freely available as packages such as tools and web servers, for a detailed list, see (Bonidia et al., Citation2022). A simple and common feature extraction methodology is the k-mer representation (overlapping sub-sequences of length k) paired with a vectorisation technique. When applied to protein sequences, instead of treating entire amino acid sequences as single entities, they can be deconstructed into k-mers to serve the purpose of capturing localized patterns and associations within sequences.
Using k-mers beyond machine learning is considered one of the oldest and most popular techniques for various alignment-free sequence analyses (Lander et al., Citation2001; Gribskov et al., Citation1987; Déraspe et al., Citation2022). The list of possible applications of k-mers in DNA, RNA and protein sequences is endless as they have been widely used in many bioinformatics applications such as genome assembly (Antipov et al., Citation2020; Luo et al., Citation2012; Pevzner et al., Citation2001), sequence error correction (Kelley et al., Citation2010), taxonomic classification (Lu et al., Citation2022), genomic and metagenomic analysis and classification (Dubinkina et al., Citation2016; Ondov et al., Citation2016), quality control of sequencing data (Lo & Chain, Citation2014), database searches (Harris & Medvedev, Citation2020), sequence clustering (Steinegger & Söding, Citation2018), genotyping variants (Iqbal et al., Citation2012), chromosome sequence classification (Rangavittal et al., Citation2019), structural variations (Khorsand & Hormozdiari, Citation2021), identification of biomarkers (Wang et al., Citation2018), and comparative genomics (Ghiurcuta & Moret, Citation2014). Vectorization techniques that can be used in conjunction with k-mer representation could include frequency Encoding, TF-IDF (Term Frequency-Inverse Document Frequency), One-Hot Encoding, Word2Vec and Embeddings, k-mer Profiles, and N-grams & Skip-grams. K-mer frequency encoding, or simply k-mer counting (Technically, it is often referred to as ‘Count Vectorization’) has dominated other techniques, despite its simplicity (Marçais & Kingsford, Citation2011). It was initially employed in natural language processing (NLP) and text analysis (also known as ‘bag of words’ or ‘BoW’ for brevity). Its main purpose is to convert text into numerical feature vectors by counting word frequencies, creating a numerical representation. In simpler terms, it transforms text into a matrix of word counts, where rows represent documents, columns are distinct words, and cell values show word frequencies in specific documents. In the context of protein sequences, a similar matrix is created, with rows for different sequences, columns for various k-mers, and values representing k-mer frequencies within each sequence. This resulting matrix is called the feature matrix, summarizing k-mer frequency information across all sequences.
In this article, we present a comprehensive study that employs k-mers along with three main machine learning algorithms to predict a protein domain’s architecture—out of the largest official 40 CATH Architectures. We provide two separate approaches: (1) a model that can predict the architecture from the sequence of amino acids alone, suitable for domains with unknown structures, and (2) a model that employs both the sequence of amino acids and structural features as a sequence of structural alphabets; such a model can be used for domains with known structures. We have conducted a thorough investigation into the impact of the value of k (k-mer) and the role of each sequence, i.e. amino acids and structural alphabets. Support Vector Machines (SVM) stand out as the best algorithm, with an F1 Score reaching as high as 0.94 to predict a protein domain’s architecture from the sequence of amino acids and structural alphabets.
SCOP & CATH: classifications and predictions
Categorizing proteins based on structural features was first introduced by Levitt and Chothia in 1976 (Levitt & Chothia, Citation1976) when they classified 31 globular proteins into one of four structural classes based on the percentage of secondary structure content and their order: (1) all-alpha proteins; (2) all-beta proteins; (3) alpha + beta; and (4) alpha/beta. The distinction between the last two lies in the fact that in alpha + beta proteins, beta strands and alpha helices are typically separated, while in alpha/beta proteins, alpha helices and beta strands are more mixed. Two decades later, Chothia et al. created a manually curated online database known as the Structural Classification Of Proteins (SCOP) (Murzin et al., Citation1995). This database classifies protein domains with known three-dimensional structures not only based on their structural features but also on their evolutionary relationships. The classification is hierarchical and composed of 4 levels, with the original structural classes serving as the top level (Andreeva et al., Citation2014). The hierarchy, from top to bottom, is as follows: Structural Classes, folds, superfamilies, and families (Andreeva et al., Citation2020). In summary, the top two levels (Classes and Folds) categorize protein domains based on structural features, whereas the third and fourth levels (Superfamilies and Families respectively) rely on evolutionary relationships to group them—See . As of 16 June 2022, – the latest release – SCOP encompasses 5 structural classes, 1,562 folds, 2,816 superfamilies, and 5,936 families spanning over a range of 72,544 non-redundant domains corresponding to 115,656 unique protein structures (861,631 chains) from the Protein Data Bank (PDB) (Berman, Citation2000; Burley et al., Citation2021).
Nearly two years after the initial release of SCOP in 1995, an alternative semi-automatic hierarchical classification called CATH—named after the first four levels of its hierarchy: Class, Architecture, Topology and Homology (homologous superfamily)—was established (Orengo et al., Citation1997). The first level – Class—is quite similar to SCOP’s. Architecture, however, classifies protein domains based on the overall shape defined by the secondary structure units. Topology relies on additional structural features, namely, connectivity between secondary structures. In general, the definition of Folds in SCOP is quite similar to CATH’s Topology which makes Architecture a distinct classification that lies between Structural classes and Folds/Topologies. The last level, the homologous superfamily (H), as its name suggests, is based on evolutionary relationships. depicts a comparison between CATH and SCOP.
There have been two levels of CATH: CATH-Plus (4.3 is the latest version) which is considered the ‘stable’ release and CATH-B as a daily snapshot of the latest structures. While CATH-B offers updates at a comparatively faster pace than CATH-Plus and currently encompasses an additional 37K PDB structures, it provides a limited amount of information. CATH-Plus 4.3.0—based on PDB as of July 2019 – covers 500,238 domains spanning over 150,885 unique PDB structures categorised into 5 classes, 43 architecture, 1,472 Topologies and 6,631 superfamilies. Such numbers haven’t been updated since then (Sillitoe et al., Citation2021). CATH team, in the past few years, has gone beyond the PDB repository to assign domains and provide superfamily annotations for protein sequences with unknown structures in databases such as UniProt (Bateman et al., Citation2023) and Ensembl (Martin et al., Citation2023). To this end, CATH team uses mainly Hidden Markov Models (HMM) to identify domains and assign them to superfamilies using a set of ‘representative’ domain structures. They have annotated more than 82 million protein sequences (151 million protein domains) via CATH’s structure-based domain superfamily assignments (Lewis et al., Citation2018). The main tools they rely on for annotations are the 25+ years old in-house SSAP (Orengo & Taylor, Citation1996) and CATHEDRAL (Redfern et al., Citation2007) as structure-based, and HMMER3 (Mistry et al., Citation2013), PRC (Madera & Bateman, Citation2008), HHsearch (Steinegger et al., Citation2019) and MMseqs2 (Steinegger & Söding, Citation2017) as sequence-based. Except for the first level, i.e. Structural class, all levels comprise unbalanced classification, this is true for superfamilies, where the largest 100 superfamilies represent more than 54% of the total number of the ∼150 million annotated protein sequences; amongst those 100 superfamilies, 11 are called the ‘mega’ ones.
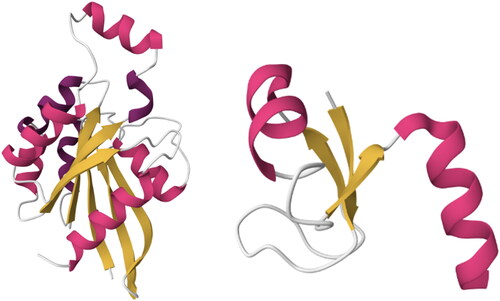
The Architecture level in CATH is crucial, as it was the initial step towards organizing the known folds into groups that unveil a shared shape formed by the overall arrangement of secondary structure units, without considering the connections that link those units. Such a grouping was initially executed manually as a subjective grouping of folds sharing the same shape, however, regardless of the length or even the number of the secondary structure units. For instance, the aba sandwich architecture, consisting of three layers, encompasses numerous topologies (folds) that exhibit diverse sizes and proportions of alpha helices and beta sheets. While this falls into a relatively broad category, domains within this architectural pattern can be succinctly and effectively characterized: they possess a central beta-sheet flanked by layers of alpha helices on both sides (see ).
Figure 2. Two structures belong to the same Architecture (3-Layer (aba) Sandwich) with different Topologies (Left-to-right: (1) Rossmann fold, PDBID: 1A2B and (2) Ribosomal Protein L9, PDBID: 2HBA). Although the number and length of the secondary structures is quite different, they both share the same overall shape: beta-sheets surrounded by alpha helices. Images created using Mol* (Sehnal et al., Citation2021).
Since classifying a protein structure into CATH and/or SCOP requires some manual effort, there have been some efforts to make the process fully ‘automated’ by utilising mainly machine learning algorithms. Predicting the topic level, i.e. the structural class—which will be discussed in the next paragraph, has gained tremendous amount of research due to its relative simplicity over the remaining levels. To the best of our knowledge, there have been no attempts to target the middle levels such as Architecture, Topology and Fold. Definitely, the ultimate goal is to predict the SCOP’s family and/or CATH’s superfamily since based on both hierarchies, once the bottom level has been determined, the remaining levels will be implicit, thus a protein has been fully classified. In the paragraph after the next one, we will discuss the main two remarkable works that targeted SCOP’s family and CATH’s superfamily, called MT-LSTM (Bepler & Berger, Citation2021) and CATHe (Nallapareddy et al., Citation2023) respectively. Whereas the former achieved an excellent accuracy (>90%), the latter didn’t exceed 75%. In this work, for the first time, we target the ‘structural’ part of CATH, that is, Architecture (and consequently, the structural Class) and achieve a reliable F1 Score.
Assigning a protein structure to a specific Structural class either in CATH or SCOP was amongst the very early attempts to predict CATH/SCOP’s top annotation level due to the relative simplicity as the number of main classes at that level is very small (4 and 5 respectively) compared to the remaining levels (Chou & Zhang, Citation1995; Chou, Citation2005; Zhu et al., Citation2021). Providing a thorough review of such algorithms is beyond the scope of this article as it has been a heavily studied topic, however, they all took advantage of (1) machine learning-based techniques such as SVM (Zhu et al., Citation2019; Dehzangi et al., Citation2014), Artificial Neural Networks (ANN) (Jahandideh et al., Citation2007; Wenzheng et al., Citation2014), and Ensembles & Meta-Classifiers (Dehzangi et al., Citation2013; Hayat et al., Citation2012; Cai et al., Citation2006), and/or (2) features that reveal class-related information like physiochemical-based information (Dehzangi et al., Citation2013; Li et al., Citation2008), amino acid sequence reverse encoding (Mizianty & Kurgan, Citation2009), pseudo amino acid composition (Liang & Zhang, Citation2017; Ding et al., Citation2007), Position Specific Scoring Matrix (PPSM) profile (Hayat & Khan, Citation2012) and structural based information including secondary structure prediction (Liu & Jia, Citation2010; Ding et al., Citation2014). Some of the aforementioned methods did achieve an accuracy of up to 90% (Abbass & Nebel, Citation2015); a couple of years ago, using symmetrical recurrence quantification analysis to extract features, reverse encoding and random forest classifier, a team reported 100% accuracy (Abdennaji et al., Citation2021).
Earlier in 2023, the CATH team developed a sequence-based neural network model to predict a protein’s superfamily called CATHe where ‘e’ stands for embeddings; the term used to denote the numerical representations of protein sequences obtained from protein language models (pLMs) (Nallapareddy et al., Citation2023). It was an attempt to cope with the overhead of the manual curation used—along the automated workflow—to classify the large amount of protein sequences being poured into the databases and to be able to detect some ‘hard’ remote homologues missed by the HMM-based approaches. They tried 6 different models, the best one was the artificial neural networks (ANN) coupled with ProtT5 (Elnaggar et al., Citation2022) as a source for embeddings. They reported an F1 Score of ∼0.72% on a dataset that contains the largest 1,773 superfamilies. Another remarkable work that leverages protein language models called MT-LSTM, although targeting SCOP families, is considered close to ours in the sense that researchers used information from both sequence and structure (Bepler & Berger, Citation2021). Through supervised learning and multi-task (MT) language model – masked language modelling task, residue-residue contact prediction, and structural similarity prediction—extracted structural information played a crucial role in producing a more accurate model to predict function. It is worth noting that the structural information that aided the overall learning process was extracted from a very tiny amount of the overall size of the dataset (28,000 vs 76,000,000). They reported an overall accuracy of 96.19%.
Structural alphabets and protein blocks
Although its foundations were laid out much earlier (Unger et al., Citation1989; Camproux et al., Citation1999; De Brevern et al., Citation2000; Schuchhardt et al., Citation1996; Fetrow et al., Citation1997), over the past two decades, the notion of a structural alphabet (SA) has attracted much attention due to its ability to encode protein structures/fragments into a sequence of structural letters (SL) – similar to the amino acid sequences. SA encoding plays a key role in converting the three-dimensional (3D) protein conformations into a one-dimensional (1D) representation, thereby allowing for a simplified protein structure analysis. This approach has dramatically simplified many protein bioinformatics applications such as the comparison of 3D conformations by using well-known sequence comparison algorithms on SA sequences (Tung et al., Citation2007; Guyon et al., Citation2004).
There have been many successful attempts to create structural alphabets such as Units of Structural Alphabet (USA) (Tung & Nacher, Citation2013), HMM-SA (Camproux et al., Citation2004; Camproux & Tufféry, Citation2005), M32K25 (Pandini et al., Citation2010), SAFlex (Allam et al., Citation2018), Protein Blocks (PB) (De Brevern et al., Citation2000) and others (Ku & Hu, Citation2008; Sander et al., Citation2006). Protein Blocks (PBs) are widely recognized as the primary structural alphabet due to their extensive adoption beyond their originators’ laboratories. Since its launch more than two decades ago (De Brevern et al., Citation2000), PBs have been applied to numerous protein bioinformatics applications and topics such as protein superimpositions (Joseph et al., Citation2012; Faure et al., Citation2019; Gelly et al., Citation2011; Léonard et al., Citation2014), protein backbone prediction (Vetrivel et al., Citation2017), molecular dynamics analyses (de Brevern, Citation2005), protein contacts analysis (Faure et al., Citation2008), globular protein structures reconstruction (Dong et al., Citation2007), peptides design (Thomas et al., Citation2006), locating binding sites (Dudev & Lim, Citation2007), reduced amino acid alphabet (Etchebest et al., Citation2007; Zuo and Li, Citation2009), protein flexibility prediction (Narwani et al., Citation2019), local protein conformation predictions (Li et al., Citation2009; Suresh et al., Citation2013; Suresh & Parthasarathy, Citation2014; Zimmermann & Hansmann, Citation2008), Beta turns predictions (Nguyen et al., Citation2014), and protein structure prediction (Ghouzam et al., Citation2015; Ghouzam et al., Citation2016).
PBs comprise 16 distinct local prototypes, these sequence-independent fragments span five residues each and offer a reasonably accurate representation (RMSD < 0.42 Å) of various local 3D protein structures. Consequently, a PB is associated with every pentapeptide within the protein chain. These PBs were created through unsupervised training on a comprehensive, non-redundant protein structure database, using a set of dihedral angles that describe the protein backbone. This characteristic renders PBs as intriguing conformational prototypes for local protein structures with high precision. The prototypes are denoted from 'a‘ to 'p'. PBs 'm‘ and 'd‘ can be broadly categorized as prototypes for the alpha helix and central beta strand, respectively. On the other hand, 'a‘ to 'c‘ predominantly represent N-caps of beta strands, while 'e‘ and 'f‘ signify C-caps of beta strands. Specific to coil regions are PBs 'g‘ to 'j', whereas 'k‘ and 'l‘ correspond to N-caps of alpha helices, and 'n‘ to 'p‘ match with C-caps of alpha helices (de Brevern, Citation2005).
To assign a protein structure to a sequence of PBs, the local structure of each amino acid is compared to the 16 PB definitions. The most similar protein block is then assigned to the relevant residue, ultimately, this assignment results in the PB sequence. The tool responsible for this conversion, i.e. transforming a PDB file into an overlapped sequence of PBs, is known as PBxplore (Barnoud et al., Citation2017). In brief, PBxplore operates as follows: To assign a Protein Block (PB) to residue 'n', it requires information from five neighbouring residues (specifically, residues 'n − 2', 'n − 1', 'n', 'n + 1', and 'n + 2′). From the backbone conformation of these five residues, it calculates eight dihedral angles (ψ and ϕ), spanning from the ψ angle of residue 'n − 2′ to the ϕ angle of residue 'n + 2'. This set of eight dihedral angles is then compared to the reference angle sets for the 16 different PBs using the Root Mean Square Deviation Angle (RMSDA) measure, which essentially calculates the Euclidean distance between the angles. The PB with the smallest RMSDA is assigned to residue 'n'. If it’s not possible to compute all eight angles for a residue, a placeholder PB 'Z' is assigned. Consequently, the first two N-terminal and the last two C-terminal residues are consistently assigned to PB 'Z'.
Methodology and experiments
To the best of our knowledge, ‘CATHe’ is the only work that is considered part of the state of the art compared to ours (Nallapareddy et al., Citation2023). However, we couldn’t use the CATHe dataset or its results for comparison. While the testing and validation sets of CATHe’s dataset consist only of sequences from the PDB, the training set (which represents ∼98% of the overall dataset) contains sequences from CATH-Gene3D (Lewis et al., Citation2018). The training set includes all the UniProt sequences assignable to CATH superfamilies via HMM algorithm (Sillitoe et al., Citation2021) representing domains/proteins of unknown structures. Since the primary objective of this study is to incorporate both the sequence of amino acids and structural alphabets, predicting the domain’s architecture that includes domains of known structures, this dataset cannot be used. Regarding the results, CATHe predicts superfamilies—the first level of the CATH hierarchy—whilst our implemented model predicts the architecture, i.e. the third level.
Utilizing the most recent stable CATH version, namely CATH-Plus 4.3, we retrieved the domains classified under any of the 43 total Architectures. Since the majority of protein structures encompass identical chains, and to avoid redundancy in our dataset and consequently sequences with high similarity rates, only Chain A within each protein was taken into consideration. However, 3 architectures consist of a very limited number of domains (<10), namely, ‘1.40 Alpha Solenoid’, ‘2.105 3 Propeller’, and ‘2.180 Shell’. Since such low numbers of entries for those three classes would make the learning process not possible given the fact that the dataset will be divided into training, evaluation and testing subsets, we excluded these cases, resulting in a final count of 40 Architectures, encompassing a combined total of 182,695 domains. A further filtration has been applied by considering only domains that are gapless, i.e. they do not contain any missing amino acids, and consequently, missing atomic coordinates and protein blocks; keeping such ‘incomplete’ domains would affect the accuracy of any model. The total number of domains in the final dataset is 169,843 as depicted in . Given that certain chains encompass more than one domain, this number of domains corresponds to a smaller quantity of proteins ().
Figure 3. Distribution of 40 CATH Architectures amongst the 169,843 domains – Dataset #1.
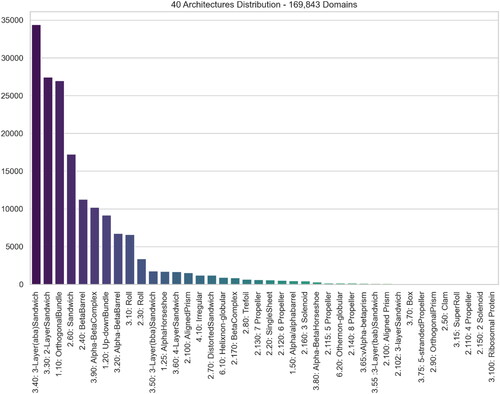
Figure 4. Distribution of 12 CATH Architectures amongst the 157,044 domains – Dataset #2.
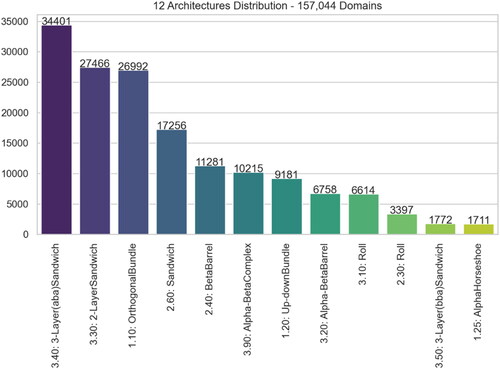
Figure 5. Distribution of 28 excluded CATH Architectures amongst the 12,799 domains – This represents Dataset #1 subtracted by Dataset #2.
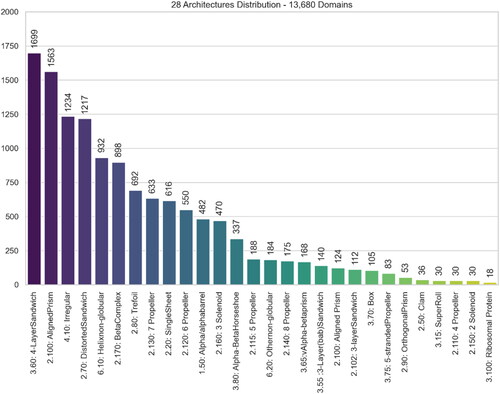
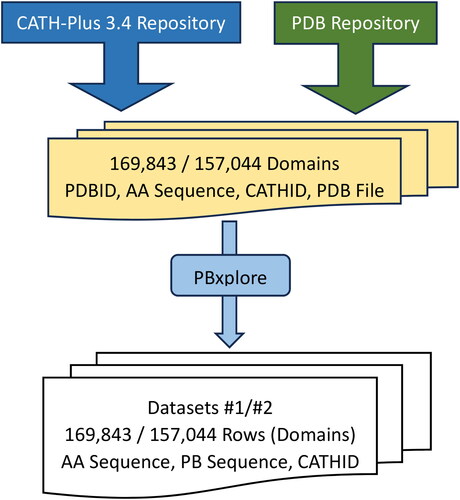
Figure 6. Flowchart of the Process to create both Datasets: 1 & 2 that contain in each row (domain), the Amino Acid Sequence, Protein Block Sequence and the Architecture ID.
To predict a protein/domain’s architecture, we have conducted three experiments; experiment #1—using the sequence of amino acids of a domain, experiment #2 – using the sequence of protein blocks of a domain, and experiment #3—using both a domain’s sequence of amino acids and sequence of protein blocks. The boundaries of domains are the ones determined by CATH. For each experiment, the main three classification machine algorithms have been employed, namely, Support Vector Machines (SVM), Logistic Regression and Random Forests. We have kept a stratified 20% as a holdout set to serve as an unseen testing dataset for final testing purposes. The results shown in this section correspond to a stratified 5-fold cross-validation methodology on the remaining 80% dataset. K-mers representation along with the Count Vectorisation technique has been adopted to convert each domain’s sequence of amino acids (domain’s length) and sequence of protein blocks (domain’s length-4). Additionally, we have considered different values of k—for k-mer—for each algorithm and each experiment—details on the range of values of k are explained in the next section. The Scikit-Learn library was used along with the default parameters of each algorithm; the source code, as well as the datasets, are all available freely online at https://zenodo.org/records/10203431
Results and discussion
and , along with , present the F1 scores of three experiments (AA-based, PB-based, and Both) for Datasets #1 and #2, respectively. The choice of the value K to conclude an experiment was based on observed patterns. In Experiment #1, utilizing three algorithms, we noted a peak/plateau around k = 5, followed by a decline in F1 scores, so we concluded the experiment at k = 16. However, for Experiments #2 and #3, across all three algorithms, we extended the experiments to k = 32 to make the peak/plateau and subsequent decline more evident. The highest values are highlighted in bold and grey in and . Nevertheless, the consistent pattern observed for all algorithms is that the value of the peak K in AA-based experiments is consistently smaller than that in PB-based experiments. These results may align with the rationale behind selecting K values; since protein block sequences represent structural information, higher values of K are likely expected to effectively capture structural motifs, whereas, for amino acid sequences, shorter values of K are more likely to capture sequence motifs.
Figure 7. F1 Score of three algorithms at three experiments for both datasets. The first column is for Dataset #2 (12 classes) and the second column is for Dataset #1 (40 classes).
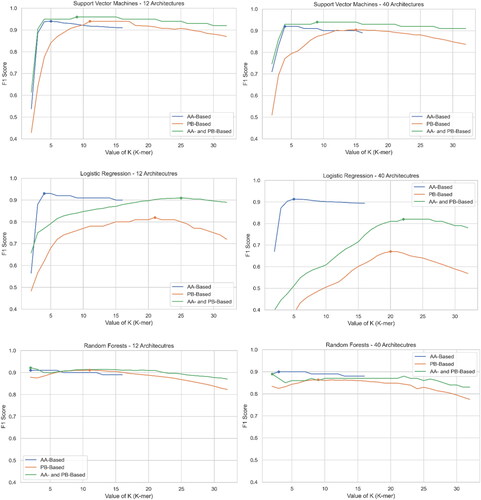
Table 1. Results (F1 Score) of Experiments 1 (using Sequence of Amino Acids), Experiments 2 (using Sequence of Protein Blocks) and Experiments 3 (Using Both Features) for the main Classes (Dataset 2 – 12 Architectures).
Table 2. Results (F1 Score) of Experiments 1 (using Sequence of Amino Acids), Experiments 2 (using Sequence of Protein Blocks) and Experiments 3 (Using Both Features) for All Classes (Dataset 1–40 Architectures).
SVM stands out as the top performer with F1 scores of 0.96 and 0.94 for datasets 2 and 1, respectively, when considering sequences of amino acids and protein blocks as features. Conversely, Logistic Regression performs the worst, particularly for the large dataset with 40 classes, showing a significant decline compared to the results of Dataset #1 as expected due to the algorithm’s sensitivity to imbalanced datasets. The asymptotic behaviour of SVM and logistic regression is almost the same across both datasets, while Random Forest appears to be independent of the value K. Additionally, except for Logistic Regression, the scores in experiment 3 are unsurprisingly always better than those in experiments 1 and 2. This is because combining insights from both sequences and structures, in theory, would improve accuracy compared to relying solely on one resource (sequence or structure). As mentioned earlier, these results align with the remarkable work by Bepler and Berger (Bepler & Berger, Citation2021), where a small amount of structural information contributed to enhancing the learning process for detecting the SCOP family.
As mentioned earlier, exhibits a similar 'behaviour’ for dataset #1 (40 classes), but unsurprisingly shows a decrease in F1 Score, as seen in . Considering that dataset #1 contains 28 additional classes of varying sizes, including some very small ones, the results show only a relatively slight loss. For instance, in experiment #1 across all algorithms, there is a minimal decrease in F1 score. Once again, SVM outperforms other algorithms, with minimal differences in scores between the two datasets.
Table 3. Comparison between averages of with .
Additional experiments #3
Further to the aforementioned set of experiments 3 where both the sequence of amino acids and protein blocks were used as features, we have added a few additional ones that took advantage of and to combine ‘successful’ k values for each experiment. To this end, we have conducted 6 additional experiments shown in . Different from the ones shown in and where the same value of k is used for each feature, we have chosen—for each algorithm—the best value of k for AA-based and the best value of k for PB-based (using the third digit after the decimal point). Again, SVM shows results that one can consider in line with the rationale behind these additional experiments. We have now two new records, for, the highest F1 scores are now 0.97 and 0.95 for Dataset #2 and Dataset #1 respectively, compared to 0.96 and 0.94 attained by ‘standard’ experiment #3.
Table 4. Results (F1 Score) of Extended Experiments 3 (using both features, Sequence of Amino Acids and Sequence of Protein Blocks) for both the main and 40 Classes (Datasets 1 & 2).
Detailed F1 scores for each class for both SVM 'final’ experiments, i.e. 12 classes – k = 5 (AA) K = 13 (PB) – and 40 classes – k = 5 (AA) K = 13 (PB), are shown in and , respectively. While in , one can notice that overall, the F1 score of all classes is almost the same, some classes in show relatively low scores, namely, 6.10—Helix non-globular, 3.15—Super Roll, and 6.20 Other non-globular (we have highlighted in red all F1 scores that are less than 0.90). For 6.10 and 6.20, one can understand why such low scores may occur; as their architectural code reveals, they belong to the structural Class 6 dedicated to non-globular proteins—called 'Special’ (the main structural classes are 1- Mainly Alpha, 2- Mainly Beta, 3- Alpha Beta, 4- Few Secondary Structures). Thus, Structural Class 6 is considered an irregular group as it contains structures that do not have any regular patterns of secondary structures, as seen in . As for 3.15—Super Roll, while it belongs to a 'standard’ Structural Class and Architecture, the size of the class (32) might have played a role in preventing the ML algorithm from accurately computing its complex architecture.
Figure 8. From Left to Right, structures of three proteins that belong to architectures 6.10 and 6.20: 2LH0 (6.10), 4GIP (6.10), 2CON (6.20). Images created using Mol* (Sehnal et al., Citation2021).
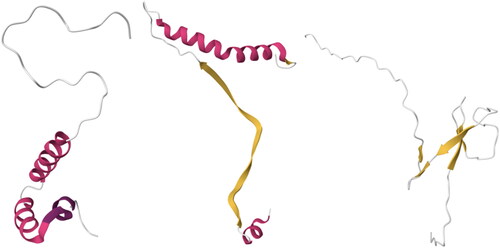
Table 5. Detailed F1 Score for SVM – 12 Classes – k = 5 (AA) K = 13 (PB).
Table 6. Detailed F1 Score for SVM – 12 Classes – k = 5 (AA) K = 13 (PB).
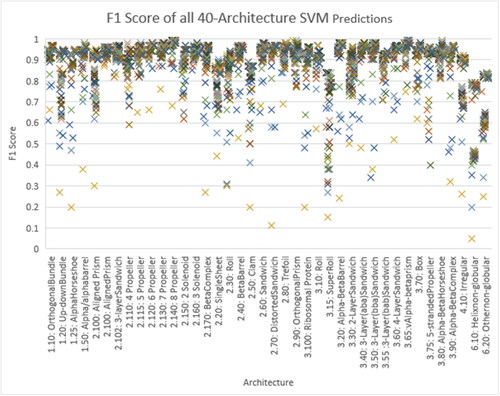
For the sake of further investigation regarding the performance of the experiments on the 40 classes, we have chosen the SVM experiments – —to plot the F1 Scores of the 80 experiments (16(AA) +32(PB) +32(AAPB)) since SVM algorithms performed the best, see . The results are in line with the ones shown in .
Figure 9. F1 Scores of 40-Classes SVM 80 experiments for each Architecture.
Final experiments – Holdout set results
Although the preceding results are derived from stratified 5-fold cross-validation, 20% of the dataset has been reserved as a holdout set, also referred to as an unseen dataset, for conclusive testing. To save time and for brevity, we selected the experiment within each set that achieved the highest F1 Score for final testing. Adhering to standard practice, the model underwent training on the entire 80% training dataset and was subsequently tested on the remaining 20%. below presents the outcomes of these experiments, corresponding to and a subset of and . The numbers in black (11 out of 24) mirror the cross-validation results. The numbers in green (11 out of 24) and red (2 out of 24) are marginally higher (+0.01) and slightly lower (–0.01), respectively, with only two results exhibiting a greater deviation of 0.02 (highlighted in green and underlined). Given the negligible nature of these differences, one can infer that the results obtained through cross-validation align closely with those of the holdout set. The slightly higher F1 Scores may be attributed to the larger training dataset, providing a reasonable explanation for the observed variations.
Table 7. Holdout dataset’s results.
As a result of this extensive study, we suggest the following 4 algorithms to predict a protein/domain’s architecture out of the largest 12 and 40 CATH architectures; all of them are based on Support Vector Machines, as shown in . These four algorithms’ complete source codes and datasets are all freely available online at https://zenodo.org/records/10203431.
Table 8. Final conclusion that includes the best 4 algorithms out of the study.
Given the reliable F1 Scores of the 4 algorithms shown above, one can claim that half of the CATH annotation (Architecture and Class levels out of 4) which represents the ‘structural’ part of the CATH hierarchy can now be accurately annotated mainly for proteins with known structures. This includes not only the experimentally determined structures that still lack CATH annotation but also the PDB’s ∼1 M CSM predicted by AlphaFold.
Conclusion
In conclusion, our study addresses the critical challenge of annotating a rapidly expanding database of protein structures, especially with the inclusion of AlphaFold predictions in the PDB repository. While CATH has traditionally been a valuable resource for classifying proteins based on structural and evolutionary relationships, the manual intervention required for annotation struggles to keep pace with the growing number of structures.
To overcome these challenges, we proposed a novel machine-learning model capable of classifying protein domains into the 40 main CATH Architectures. Through a comprehensive investigation, we achieved promising results with an F1 Score of 0.92 using only amino acid sequences and a score of 0.94 when incorporating both amino acid sequences and structural alphabets. The utilization of k-mers and three main machine-learning algorithms, with Support Vector Machines (SVM) standing out as the best performer, showcased the effectiveness of our approach.
Our findings contribute to the field by providing a fully automated method for annotating protein domains, offering an efficient solution to the challenges posed by the increasing volume of experimental and predicted structures. The developed machine-learning models, particularly the SVM-based algorithms, present a reliable means to predict the architecture of protein domains, bridging the gap between sequence and structure information.
Moreover, our study extends the applicability of machine learning beyond traditional sequence-based methods, demonstrating the efficacy of combining insights from both sequences and structures. This approach aligns with recent advancements in the field, emphasizing the importance of integrating multiple resources for improved accuracy.
The availability of our code and datasets facilitates further exploration and utilization of our models within the scientific community. We believe that our work marks a significant step toward the automation of protein domain annotation and classification, addressing the evolving landscape of structural biology and protein research.
| Abbreviations | ||
| AA | = | amino acid |
| CATH | = | Class, Architecture, Topology, Homology |
| CSM | = | Computed Structure Models |
| DL | = | deep learning |
| HMM | = | Hidden Markov Models |
| ML | = | machine learning |
| PB | = | protein block |
| PDB | = | Protein Data Bank |
| pLDDT | = | predicted local distance difference test |
| pLMs | = | protein language models |
| SA | = | structural alphabet |
| SCOP | = | Structural Classification of Proteins |
| SVM | = | Support Vector Machines |
Disclosure statement
No potential competing interest was reported by the author(s)
Data availability statement
The code and datasets developed in this study can be accessed at https://zenodo.org/records/10203431.
Additional information
Funding
References
- Abbass, J., & Nebel, J.-C. (2015). Customised fragments libraries for protein structure prediction based on structural class annotations. BMC Bioinformatics, 16(1), 136. https://doi.org/10.1186/s12859-015-0576-2
- Abdennaji, I., Zaied, M., & Girault, J. M. (2021). Prediction of protein structural class based on symmetrical recurrence quantification analysis. Computational Biology and Chemistry, 92, 107450. https://doi.org/10.1016/J.COMPBIOLCHEM.2021.107450
- Allam, I., Flatters, D., Caumes, G., Regad, L., Delos, V., Nuel, G., & Camproux, A.-C. (2018). SAFlex: A structural alphabet extension to integrate protein structural flexibility and missing data information. PLoS One, 13(7), e0198854. https://doi.org/10.1371/journal.pone.0198854
- Andreeva, A. (2016). Lessons from making the Structural Classification of Proteins (SCOP) and their implications for protein structure modelling. Biochemical Society Transactions, 44(3), 937–943. https://doi.org/10.1042/BST20160053
- Andreeva, A., & Murzin, A. G. (2010). Structural classification of proteins and structural genomics: New insights into protein folding and evolution. Acta Crystallographica. Section F, Structural Biology and Crystallization Communications, 66(Pt 10), 1190–1197. doi: 10.1107/S1744309110007177/https://journals.iucr.org/services/termsofuse.html.
- Andreeva, A., Howorth, D., Chothia, C., Kulesha, E., & Murzin, A. G. (2014). SCOP2 prototype: A new approach to protein structure mining. Nucleic Acids Research., 42(D1), D310–D314.
- Andreeva, A., Kulesha, E., Gough, J., & Murzin, A. G. (2020). The SCOP database in 2020: Expanded classification of representative family and superfamily domains of known protein structures. Nucleic Acids Research, 48(D1), D376–D382. https://doi.org/10.1093/NAR/GKZ1064
- Antipov, D., Raiko, M., Lapidus, A., & Pevzner, P. A. (2020). MetaviralSPAdes: Assembly of viruses from metagenomic data. Bioinformatics, 36(14), 4126–4129. https://doi.org/10.1093/BIOINFORMATICS/BTAA490
- Barnoud, J., Santuz, H., Craveur, P., Joseph, A. P., Jallu, V., de Brevern, A. G., & Poulain, P. (2017). PBxplore: A tool to analyze local protein structure and deformability with Protein Blocks. PeerJ., 5(11), e4013. https://doi.org/10.7717/peerj.4013
- Bateman, A., Martin, M.-J., Orchard, S., Magrane, M., Ahmad, S., Alpi, E., Bowler-Barnett, E. H., Britto, R., Bye-A-Jee, H., Cukura, A., Denny, P., Dogan, T., Ebenezer, TGod., Fan, J., Garmiri, P., da Costa Gonzales, L. J., Hatton-Ellis, E., Hussein, A., Ignatchenko, A., Insana, G., Ishtiaq, R., & Zhang, J. (2023). UniProt: The universal protein knowledgebase in 2023. Nucleic Acids Research, 51(D1), D523–D531. https://doi.org/10.1093/nar/gkac1052
- Bepler, T., & Berger, B. (2021). Learning the protein language: Evolution, structure, and function. Cell Systems, 12(6), 654–669.e3. https://doi.org/10.1016/J.CELS.2021.05.017
- Berman, H. M. (2000). The Protein Data Bank. Nucleic Acids Research, 28(1), 235–242. http://www.pubmedcentral.nih.gov/articlerender.fcgi?artid=102472&tool=pmcentrez&rendertype=abstract https://doi.org/10.1093/nar/28.1.235
- Bileschi, M. L., Belanger, D., Bryant, D. H., Sanderson, T., Carter, B., Sculley, D., Bateman, A., DePristo, M. A., & Colwell, L. J. (2022). Using deep learning to annotate the protein universe. Nature Biotechnology, 40(6), 932–937. https://doi.org/10.1038/s41587-021-01179-w
- Bonidia, R. P., Domingues, D. S., Sanches, D. S., & De Carvalho, A. C. P. L. F. (2022). MathFeature: Feature extraction package for DNA, RNA and protein sequences based on mathematical descriptors. Briefings in Bioinformatics, 23(1), 1–10. https://doi.org/10.1093/BIB/BBAB434
- Bonidia, R. P., Sampaio, L. D. H., Domingues, D. S., Paschoal, A. R., Lopes, F. M., de Carvalho, A. C. P. L. F., & Sanches, D. S. (2021). Feature extraction approaches for biological sequences: A comparative study of mathematical features. Briefings in Bioinformatics, 22(5), 1–20. https://doi.org/10.1093/BIB/BBAB011
- Burley, S. K., Bhikadiya, C., Bi, C., Bittrich, S., Chen, L., Crichlow, G. V., Christie, C. H., Dalenberg, K., Di Costanzo, L., Duarte, J. M., Dutta, S., Feng, Z., Ganesan, S., Goodsell, D. S., Ghosh, S., Green, R. K., Guranović, V., Guzenko, D., Hudson, B. P., … Zhuravleva, M. (2021). RCSB Protein Data Bank: Powerful new tools for exploring 3D structures of biological macromolecules for basic and applied research and education in fundamental biology, biomedicine, biotechnology, bioengineering and energy sciences. Nucleic Acids Research, 49(D1), D437–D451. https://doi.org/10.1093/NAR/GKAA1038
- Cai, Y. D., Feng, K. Y., Lu, W. C., & Chou, K.-C. (2006). Using LogitBoost classifier to predict protein structural classes. Journal of Theoretical Biology, 238(1), 172–176. https://doi.org/10.1016/j.jtbi.2005.05.034
- Camproux, A. C., & Tufféry, P. (2005). Hidden Markov Model-derived structural alphabet for proteins: The learning of protein local shapes captures sequence specificity. Biochimica et Biophysica Acta, 1724(3), 394–403. https://doi.org/10.1016/J.BBAGEN.2005.05.019
- Camproux, A. C., Gautier, R., & Tufféry, P. (2004). A hidden Markov model derived structural alphabet for proteins. Journal of Molecular Biology, 339(3), 591–605. https://doi.org/10.1016/j.jmb.2004.04.005
- Camproux, A. C., Tuffery, P., Chevrolat, J. P., Boisvieux, J. F., & Hazout, S. (1999). Hidden Markov model approach for identifying the modular framework of the protein backbone. Protein Engineering, 12(12), 1063–1073. https://doi.org/10.1093/protein/12.12.1063
- Chen, Z., Zhao, P., Li, F., Marquez-Lago, T. T., Leier, A., Revote, J., Zhu, Y., Powell, D. R., Akutsu, T., Webb, G. I., Chou, K.-C., Smith, A. I., Daly, R. J., Li, J., & Song, J. (2020). iLearn: An integrated platform and meta-learner for feature engineering, machine-learning analysis and modeling of DNA, RNA and protein sequence data. Briefings in Bioinformatics, 21(3), 1047–1057. https://doi.org/10.1093/BIB/BBZ041
- Chothia, C., Gough, J., Vogel, C., & Teichmann, S. A. (2003). Evolution of the protein repertoire. Science, 300(5626), 1701–1703. https://doi.org/10.1126/SCIENCE.1085371
- Chou, K.-C. (2005). Progress in protein structural class prediction and its impact to bioinformatics and proteomics. Current Protein & Peptide Science, 6(5), 423–436. https://doi.org/10.2174/138920305774329368
- Chou, K.-C., & Zhang, C. T. (1995). Prediction of protein structural classes. Critical Reviews in Biochemistry and Molecular Biology, 30(4), 275–349. https://doi.org/10.3109/10409239509083488
- Dawson, N. L., Lewis, T. E., Das, S., Lees, J. G., Lee, D., Ashford, P., Orengo, C. A., & Sillitoe, I. (2016). CATH: An expanded resource to predict protein function through structure and sequence. Nucleic Acids Research, 45(D1), D289–D295. https://doi.org/10.1093/nar/gkw1098
- de Brevern, A. G. (2005). New assessment of a structural alphabet. In Silico Biology., 5(3), 283–289.
- De Brevern, A. G., Etchebest, C., & Hazout, S. (2000). Bayesian probabilistic approach for predicting backbone structures in terms of protein blocks. Proteins: Structure, Function, and Genetics, 41(3), 271–287. https://doi.org/10.1002/1097-0134(20001115)41:3<271::AID-PROT10>3.0.CO;2-Z
- Dehzangi, A., Paliwal, K., Lyons, J., Sharma, A., & Sattar, A. (2014). Proposing a highly accurate protein structural class predictor using segmentation-based features. BMC Genomics, 15(Suppl 1), S2. https://doi.org/10.1186/1471-2164-15-S1-S2
- Dehzangi, A., Paliwal, K., Sharma, A., Dehzangi, O., & Sattar, A. (2013). A combination of feature extraction methods with an ensemble of different classifiers for protein structural class prediction problem. IEEE/ACM Transactions on Computational Biology and Bioinformatics, 10(3), 564–575. https://doi.org/10.1109/TCBB.2013.65
- Déraspe, M., Boisvert, S., Laviolette, F., Roy, P. H., & Corbeil, J. (2022). Flexible protein database based on amino acid k-mers. Scientific Reports, 12(1), 9101. https://doi.org/10.1038/s41598-022-12843-9
- Ding, S., Li, Y., Shi, Z., & Yan, S. (2014). A protein structural classes prediction method based on predicted secondary structure and PSI-BLAST profile. Biochimie, 97(1), 60–65. https://doi.org/10.1016/j.biochi.2013.09.013
- Ding, Y.-S., Zhang, T.-L., & Chou, K.-C. (2007). Prediction of protein structure classes with pseudo amino acid composition and fuzzy support vector machine network. Protein and Peptide Letters, 14(8), 811–815. https://doi.org/10.2174/092986607781483778
- Dong, Q. W., Wang, X. L., & Lin, L. (2007). Methods for optimizing the structure alphabet sequences of proteins. Computers in Biology and Medicine, 37(11), 1610–1616. https://doi.org/10.1016/j.compbiomed.2007.03.002
- Dubinkina, V. B., Ischenko, D. S., Ulyantsev, V. I., Tyakht, A. V., & Alexeev, D. G. (2016). Assessment of k-mer spectrum applicability for metagenomic dissimilarity analysis. BMC Bioinformatics, 17(1), 38. doi: 10.1186/S12859-015-0875-7/FIGURES/3.
- Dudev, M., & Lim, C. (2007). Discovering structural motifs using a structural alphabet: Application to magnesium-binding sites. BMC Bioinformatics, 8(1), 1–12. https://doi.org/10.1186/1471-2105-8-106/FIGURES/6
- Elnaggar, A., Heinzinger, M., Dallago, C., Rehawi, G., Wang, Y., Jones, L., Gibbs, T., Feher, T., Angerer, C., Steinegger, M., Bhowmik, D., & Rost, B. (2022). ProtTrans: Toward Understanding the Language of Life Through Self-Supervised Learning. IEEE Transactions on Pattern Analysis and Machine Intelligence, 44(10), 7112–7127. https://doi.org/10.1109/TPAMI.2021.3095381
- Etchebest, C., Benros, C., Bornot, A., Camproux, A. C., & De Brevern, A. G. (2007). A reduced amino acid alphabet for understanding and designing protein adaptation to mutation. European Biophysics Journal, 36(8), 1059–1069. doi: 10.1007/S00249-007-0188-5/TABLES/4.
- Faure, G., Bornot, A., & de Brevern, A. G. (2008). Protein contacts, inter-residue interactions and side-chain modelling. Biochimie, 90(4), 626–639. https://doi.org/10.1016/j.biochi.2007.11.007
- Faure, G., Joseph, A. P., Craveur, P., Narwani, T. J., Srinivasan, N., Gelly, J.-C., Rebehmed, J., & de Brevern, A. G. (2019). IPBAvizu: A PyMOL plugin for an efficient 3D protein structure superimposition approach. Source Code for Biology and Medicine, 14(1), 5. https://doi.org/10.1186/s13029-019-0075-3
- Fetrow, J. S., Palumbo, M. J., & Berg, G. (1997). Patterns, structures, and amino acid frequencies in structural building blocks, a protein secondary structure classification scheme. Proteins, 27(2), 249–271. https://doi.org/10.1002/(SICI)1097-0134(199702)27:2<249::AID-PROT11>3.0.CO;2-M
- Fox, N. K., Brenner, S. E., & Chandonia, J. M. (2015). The value of protein structure classification information – Surveying the scientific literature. Proteins, 83(11), 2025–2038. https://doi.org/10.1002/PROT.24915
- Gelly, J. C., Joseph, A. P., Srinivasan, N., & De Brevern, A. G. (2011). IPBA: A tool for protein structure comparison using sequence alignment strategies. Nucleic Acids Research, 39(Web Server issue), W18–W23. https://doi.org/10.1093/nar/gkr333
- Ghiurcuta, C. G., & Moret, B. M. E. (2014). Evaluating synteny for improved comparative studies. Bioinformatics, 30(12), i9–18. https://doi.org/10.1093/BIOINFORMATICS/BTU259
- Ghouzam, Y., Postic, G., De Brevern, A. G., & Gelly, J. C. (2015). Improving protein fold recognition with hybrid profiles combining sequence and structure evolution. Bioinformatics, 31(23), 3782–3789. https://doi.org/10.1093/BIOINFORMATICS/BTV462
- Ghouzam, Y., Postic, G., Guerin, P. E., De Brevern, A. G., & Gelly, J. C. (2016). ORION: A web server for protein fold recognition and structure prediction using evolutionary hybrid profiles. Scientific Reports, 6(1), 28268. https://doi.org/10.1038/srep28268
- Gribskov, M., McLachlan, A. D., & Eisenberg, D. (1987). Profile analysis: Detection of distantly related proteins. Proceedings of the National Academy of Sciences of the United States of America, 84(13), 4355–4358. https://doi.org/10.1073/pnas.84.13.4355
- Guyon, F., Camproux, A. C., Hochez, J., & Tufféry, P. (2004). SA-Search: A web tool for protein structure mining based on a Structural Alphabet. Nucleic Acids Research, 32(Web Server issue), W545–W548. https://doi.org/10.1093/NAR/GKH467
- Harris, R. S., & Medvedev, P. (2020). Improved representation of sequence bloom trees. Bioinformatics, 36(3), 721–727. https://doi.org/10.1093/BIOINFORMATICS/BTZ662
- Hayat, M., & Khan, A. (2012). MemHyb: Predicting membrane protein types by hybridizing SAAC and PSSM. Journal of Theoretical Biology, 292, 93–102. https://doi.org/10.1016/j.jtbi.2011.09.026
- Hayat, M., Khan, A., & Yeasin, M. (2012). Prediction of membrane proteins using split amino acid and ensemble classification. Amino Acids, 42(6), 2447–2460. https://doi.org/10.1007/s00726-011-1053-5
- Iqbal, Z., Caccamo, M., Turner, I., Flicek, P., & McVean, G. (2012). De novo assembly and genotyping of variants using colored de Bruijn graphs. Nature Genetics, 44(2), 226–232. https://doi.org/10.1038/ng.1028
- Jahandideh, S., Abdolmaleki, P., Jahandideh, M., & Asadabadi, E. B. (2007). Novel two-stage hybrid neural discriminant model for predicting proteins structural classes. Biophysical Chemistry, 128(1), 87–93. https://doi.org/10.1016/j.bpc.2007.03.006
- Joseph, A. P., Srinivasan, N., & De Brevern, A. G. (2012). Progressive structure-based alignment of homologous proteins: Adopting sequence comparison strategies. Biochimie, 94(9), 2025–2034. https://doi.org/10.1016/J.BIOCHI.2012.05.028
- Kelley, D. R., Schatz, M. C., & Salzberg, S. L. (2010). Quake: Quality-aware detection and correction of sequencing errors. Genome Biology, 11(11), R116. https://doi.org/10.1186/GB-2010-11-11-R116/FIGURES/6
- Khorsand, P., & Hormozdiari, F. (2021). Nebula: Ultra-efficient mapping-free structural variant genotyper. Nucleic Acids Research, 49(8), e47–e47. https://doi.org/10.1093/NAR/GKAB025
- Ku, S. Y., & Hu, Y. J. (2008). Protein structure search and local structure characterization. BMC Bioinformatics, 9(1), 349. doi: 10.1186/1471-2105-9-349/FIGURES/7.
- Lander, E. S., Linton, L. M., Birren, B., Nusbaum, C., Zody, M. C., Baldwin, J., Devon, K., Dewar, K., Doyle, M., FitzHugh, W., Funke, R., Gage, D., Harris, K., Heaford, A., Howland, J., Kann, L., Lehoczky, J., LeVine, R., McEwan, P., . . . Szustakowki, J. (2001). Initial sequencing and analysis of the human genome. Nature, 409, 860–921.
- Léonard, S., Joseph, A. P., Srinivasan, N., Gelly, J. C., & De Brevern, A. G. (2014). MulPBA: An efficient multiple protein structure alignment method based on a structural alphabet. Journal of Biomolecular Structure & Dynamics, 32(4), 661–668. https://doi.org/10.1080/07391102.2013.787026
- Levitt, M., & Chothia, C. (1976). Structural patterns in globular proteins. Nature, 261(5561), 552–558. https://doi.org/10.1038/261552a0
- Lewis, T. E., Sillitoe, I., Andreeva, A., Blundell, T. L., Buchan, D. W. A., Chothia, C., Cuff, A., Dana, J. M., Filippis, I., Gough, J., Hunter, S., Jones, D. T., Kelley, L. A., Kleywegt, G. J., Minneci, F., Mitchell, A., Murzin, A. G., Ochoa-Montaño, B., Rackham, O. J. L., … Orengo, C. (2013). Genome3D: A UK collaborative project to annotate genomic sequences with predicted 3D structures based on SCOP and CATH domains. Nucleic Acids Research, 41(Database issue), D499–D507. https://doi.org/10.1093/NAR/GKS1266
- Lewis, T. E., Sillitoe, I., Dawson, N., Lam, S. D., Clarke, T., Lee, D., Orengo, C., & Lees, J. (2018). Gene3D: Extensive prediction of globular domains in proteins. Nucleic Acids Research, 46(D1), D435–D439. https://doi.org/10.1093/NAR/GKX1069
- Li, Q., Zhou, C., & Liu, H. (2009). Fragment-based local statistical potentials derived by combining an alphabet of protein local structures with secondary structures and solvent accessibilities. Proteins, 74(4), 820–836. https://doi.org/10.1002/PROT.22191
- Li, Z.-C., Zhou, X.-B., Lin, Y.-R., & Zou, X.-Y. (2008). Prediction of protein structure class by coupling improved genetic algorithm and support vector machine. Amino Acids, 35(3), 581–590. https://doi.org/10.1007/s00726-008-0084-z
- Liang, Y., & Zhang, S. (2017). Predict protein structural class by incorporating two different modes of evolutionary information into Chou’s general pseudo amino acid composition. Journal of Molecular Graphics & Modelling, 78, 110–117. https://doi.org/10.1016/J.JMGM.2017.10.003
- Liu, B., Gao, X., & Zhang, H. (2019). BioSeq-Analysis2.0: An updated platform for analyzing DNA, RNA and protein sequences at sequence level and residue level based on machine learning approaches. Nucleic Acids Research, 47(20), e127–e127. https://doi.org/10.1093/NAR/GKZ740
- Liu, B., Liu, F., Wang, X., Chen, J., Fang, L., & Chou, K. C. (2015). Pse-in-One: A web server for generating various modes of pseudo components of DNA, RNA, and protein sequences. Nucleic Acids Research, 43(W1), W65–W71. https://doi.org/10.1093/NAR/GKV458
- Liu, T., & Jia, C. (2010). A high-accuracy protein structural class prediction algorithm using predicted secondary structural information. Journal of Theoretical Biology, 267(3), 272–275. https://doi.org/10.1016/j.jtbi.2010.09.007
- Lo, C. C., & Chain, P. S. G. (2014). Rapid evaluation and quality control of next generation sequencing data with FaQCs. BMC Bioinformatics, 15(1), 366. doi: 10.1186/S12859-014-0366-2/TABLES/3.
- Lu, J., Rincon, N., Wood, D. E., Breitwieser, F. P., Pockrandt, C., Langmead, B., Salzberg, S. L., & Steinegger, M. (2022). Metagenome analysis using the Kraken software suite. Nature Protocols, 17(12), 2815–2839. https://doi.org/10.1038/s41596-022-00738-y
- Luo, R., Liu, B., Xie, Y., Li, Z., Huang, W., Yuan, J., He, G., Chen, Y., Pan, Q., Liu, Y., Tang, J., Wu, G., Zhang, H., Shi, Y., Liu, Y., Yu, C., Wang, B., Lu, Y., Han, C., . . . Wang, J. (2012). SOAPdenovo2: An empirically improved memory-efficient short-read de novo assembler. Gigascience, 1(1), 18.
- Madera, M., & Bateman, A. (2008). Profile Comparer: A program for scoring and aligning profile hidden Markov models. Bioinformatics, 24(22), 2630–2631. https://doi.org/10.1093/BIOINFORMATICS/BTN504
- Marçais, G., & Kingsford, C. (2011). A fast, lock-free approach for efficient parallel counting of occurrences of k-mers. Bioinformatics, 27(6), 764–770. https://doi.org/10.1093/BIOINFORMATICS/BTR011
- Martin, F. J., Amode, M. R., Aneja, A., Austine-Orimoloye, O., Azov, A. G., Barnes, I., Becker, A., Bennett, R., Berry, A., Bhai, J., Bhurji, S. K., Bignell, A., Boddu, S., Branco Lins, P. R., Brooks, L., Ramaraju, S. B., Charkhchi, M., Cockburn, A., Da Rin Fiorretto, L., … Flicek, P. (2023). Ensembl 2023. Nucleic Acids Research, 51(D1), D933–D941. https://doi.org/10.1093/NAR/GKAC958
- Mistry, J., Finn, R. D., Eddy, S. R., Bateman, A., & Punta, M. (2013). Challenges in homology search: HMMER3 and convergent evolution of coiled-coil regions. Nucleic Acids Research, 41(12), e121–e121. https://doi.org/10.1093/NAR/GKT263
- Mizianty, M. J., & Kurgan, L. A. (2009). Modular prediction of protein structural classes from sequences of twilight-zone identity with predicting sequences. BMC Bioinformatics, 10(1), 414. https://doi.org/10.1186/1471-2105-10-414
- Murzin, A G., Brenner, S. E., Hubbard, T., & Chothia, C. (1995). SCOP: A structural classification of proteins database for the investigation of sequences and structures. Journal of Molecular Biology, 247(4), 536–540. https://doi.org/10.1006/jmbi.1995.0159
- Nallapareddy, V., Bordin, N., Sillitoe, I., Heinzinger, M., Littmann, M., Waman, V. P., Sen, N., Rost, B., & Orengo, C. (2023). CATHe: Detection of remote homologues for CATH superfamilies using embeddings from protein language models. Bioinformatics, 39(1), 29. https://doi.org/10.1093/BIOINFORMATICS/BTAD029
- Narwani, T. J., Etchebest, C., Craveur, P., Léonard, S., Rebehmed, J., Srinivasan, N., Bornot, A., Gelly, J.-C., & de Brevern, A. G. (2019). In silico prediction of protein flexibility with local structure approach. Biochimie, 165, 150–155. https://doi.org/10.1016/J.BIOCHI.2019.07.025
- Nguyen, L. A. T., Dang, X. T., Le, T. K. T., Saethang, T., Tran, V. A., Ngo, D. L., Gavrilov, S., Nguyen, N. G., Kubo, M., Yamada, Y., & Satou, K. (2014). Predicting βeta-turns and βeta-turn types using a novel over-sampling approach. Journal of Biomedical Science and Engineering, 07(11), 927–940. https://doi.org/10.4236/jbise.2014.711090
- Oates, M. E., Stahlhacke, J., Vavoulis, D. V., Smithers, B., Rackham, O. J. L., Sardar, A. J., Zaucha, J., Thurlby, N., Fang, H., & Gough, J. (2015). The SUPERFAMILY 1.75 database in 2014: A doubling of data. Nucleic Acids Research, 43(Database issue), D227–D233. https://doi.org/10.1093/NAR/GKU1041
- Ondov, B. D., Treangen, T. J., Melsted, P., Mallonee, A. B., Bergman, N. H., Koren, S., & Phillippy, A. M. (2016). Mash: Fast genome and metagenome distance estimation using MinHash. Genome Biology, 17(1), 132. doi: 10.1186/S13059-016-0997-X/FIGURES/5.
- Orengo, C. A., & Taylor, W. R. (1996). SSAP: Sequential structure alignment program for protein structure comparison. Methods in Enzymology, 266, 617–635. doi: 10.1016/S0076-6879(96)66038-8.
- Orengo, C. A., Michie, A. D., Jones, S., Jones, D. T., Swindells, M. B., & Thornton, J. M. (1997). CATH–a hierarchic classification of protein domain structures. Structure, 5(8), 1093–1108. doi: 10.1016/S0969-2126(97)00260-8.
- Pandini, A., Fornili, A., & Kleinjung, J. (2010). Structural alphabets derived from attractors in conformational space. BMC Bioinformatics, 11(1), 97. https://doi.org/10.1186/1471-2105-11-97
- Pevzner, P. A., Tang, H., & Waterman, M. S. (2001). An Eulerian path approach to DNA fragment assembly. Proceedings of the National Academy of Sciences of the United States of America, 98(17), 9748–9753. doi: 10.1073/PNAS.171285098/ASSET/8F490F1C-A68A-45AD-A4A9-6166D702BD74/ASSETS/GRAPHIC/PQ1712850005.JPEG.
- Rangavittal, S., Stopa, N., Tomaszkiewicz, M., Sahlin, K., Makova, K. D., & Medvedev, P. (2019). DiscoverY: A classifier for identifying y chromosome sequences in male assemblies. BMC Genomics, 20(1), 641. doi: 10.1186/S12864-019-5996-3/FIGURES/5.
- Redfern, O. C., Harrison, A., Dallman, T., Pearl, F. M. G., & Orengo, C. A. (2007). CATHEDRAL: A fast and effective algorithm to predict folds and domain boundaries from multidomain protein structures. PLoS Computational Biology, 3(11), e232. https://doi.org/10.1371/JOURNAL.PCBI.0030232
- Sander, O., Sommer, I., & Lengauer, T. (2006). Local protein structure prediction using discriminative models. BMC Bioinformatics, 7(1), 14. https://doi.org/10.1186/1471-2105-7-14/FIGURES/13.
- Schuchhardt, J., Schneider, G., Reichelt, J., Schomburg, D., & Wrede, P. (1996). Local structural motifs of protein backbones are classified by self-organizing neural networks. Protein Engineering, 9(10), 833–842. https://doi.org/10.1093/protein/9.10.833
- Sehnal, D., Bittrich, S., Deshpande, M., Svobodová, R., Berka, K., Bazgier, V., Velankar, S., Burley, S. K., Koča, J., & Rose, A. S. (2021). Mol* Viewer: modern web app for 3D visualization and analysis of large biomolecular structures. Nucleic Acids Research, 49(W1), W431–W437. https://doi.org/10.1093/nar/gkab314
- Sillitoe, I., Bordin, N., Dawson, N., Waman, V. P., Ashford, P., Scholes, H. M., Pang, C. S. M., Woodridge, L., Rauer, C., Sen, N., Abbasian, M., Le Cornu, S., Lam, S. D., Berka, K., Varekova, I. H., Svobodova, R., Lees, J., & Orengo, C. A. (2021). CATH: Increased structural coverage of functional space. Nucleic Acids Research, 49(D1), D266–D273. https://doi.org/10.1093/NAR/GKAA1079
- Steinegger, M., & Söding, J. (2017). MMseqs2 enables sensitive protein sequence searching for the analysis of massive data sets. Nature Biotechnology, 35(11), 1026–1028. https://doi.org/10.1038/nbt.3988
- Steinegger, M., & Söding, J. (2018). Clustering huge protein sequence sets in linear time. Nature Communications, 9(1), 2542. https://doi.org/10.1038/s41467-018-04964-5
- Steinegger, M., Meier, M., Mirdita, M., Vöhringer, H., Haunsberger, S. J., & Söding, J. (2019). HH-suite3 for fast remote homology detection and deep protein annotation. BMC Bioinformatics, 20(1), 473. doi: 10.1186/S12859-019-3019-7/FIGURES/7.
- Suresh, V., & Parthasarathy, S. (2014). SVM-PB-Pred: SVM based protein block prediction method using sequence profiles and secondary structures. Protein and Peptide Letters, 21(8), 736–742. https://doi.org/10.2174/09298665113209990064
- Suresh, V., Ganesan, K., & Parthasarathy, S. (2013). A protein block based fold recognition method for the annotation of twilight zone sequences. Protein and Peptide Letters, 20(3), 249–254. https://doi.org/10.2174/0929866511320030003
- Thomas, A., Deshayes, S., Decaffmeyer, M., Van Eyck, M. H., Charloteaux, B., & Brasseur, R. (2006). Prediction of peptide structure: How far are we? Proteins, 65(4), 889–897. https://doi.org/10.1002/PROT.21151
- Tung, C. H., Huang, J. W., & Yang, J. M. (2007). Kappa-alpha plot derived structural alphabet and BLOSUM-like substitution matrix for rapid search of protein structure database. Genome Biology, 8(3), R31. doi: 10.1186/GB-2007-8-3-R31/FIGURES/9.
- Tung, C.-H., & Nacher, J. C. (2013). A complex network approach for the analysis of protein units similarity using structural alphabet. International Journal of Bioscience, Biochemistry and Bioinformatics, 3, 433–437. https://doi.org/10.7763/IJBBB.2013.V3.250
- Tunyasuvunakool, K., Adler, J., Wu, Z., Green, T., Zielinski, M., Žídek, A., Bridgland, A., Cowie, A., Meyer, C., Laydon, A., Velankar, S., Kleywegt, G. J., Bateman, A., Evans, R., Pritzel, A., Figurnov, M., Ronneberger, O., Bates, R., Kohl, S. A. A., … Hassabis, D. (2021). Highly accurate protein structure prediction with AlphaFold. Nature, 596(7873), 590–596. https://doi.org/10.1038/s41586-021-03819-2
- Unger, R., Harel, D., Wherland, S., & Sussman, J. L. (1989). A 3D building blocks approach to analyzing and predicting structure of proteins. Proteins, 5(4), 355–373. https://doi.org/10.1002/PROT.340050410
- van Kempen, M., Kim, S. S., Tumescheit, C., Mirdita, M., Lee, J., Gilchrist, C. L. M., Söding, J., & Steinegger, M. (2023). Fast and accurate protein structure search with Foldseek. Nature Biotechnology, 42(2), 243–246. https://doi.org/10.1038/s41587-023-01773-0
- Varadi, M., Anyango, S., Deshpande, M., Nair, S., Natassia, C., Yordanova, G., Yuan, D., Stroe, O., Wood, G., Laydon, A., Žídek, A., Green, T., Tunyasuvunakool, K., Petersen, S., Jumper, J., Clancy, E., Green, R., Vora, A., Lutfi, M., … Velankar, S. (2022). AlphaFold Protein Structure Database: Massively expanding the structural coverage of protein-sequence space with high-accuracy models. Nucleic Acids Research, 50(D1), D439–D444. https://doi.org/10.1093/NAR/GKAB1061
- Vetrivel, I., Mahajan, S., Tyagi, M., Hoffmann, L., Sanejouand, Y.-H., Srinivasan, N., de Brevern, A. G., Cadet, F., & Offmann, B. (2017). Knowledge-based prediction of protein backbone conformation using a structural alphabet. PLoS One, 12(11), e0186215. https://doi.org/10.1371/journal.pone.0186215
- Wang, Y., Fu, L., Ren, J., Yu, Z., Chen, T., & Sun, F. (2018). Identifying Group-Specific sequences for microbial communities using Long k-mer sequence signatures. Front Microbiol, 9(MAY), 329350. doi: 10.3389/FMICB.2018.00872/BIBTEX.
- Wenzheng, B., Yuehui, C., & Dong, W. (2014). Prediction of protein structure classes with flexible neural tree. Biomed Mater Eng, 24(6), 3797–3806. https://doi.org/10.3233/BME-141209
- Zhu, L., Davari, M. D., & Li, W. (2021). Recent advances in the prediction of protein structural classes: Feature descriptors and machine learning algorithms. Crystals, 11(4), 324. 2021, Vol. 11, Page 324, Mar. https://doi.org/10.3390/cryst11040324
- Zhu, X. J., Feng, C. Q., Lai, H. Y., Chen, W., & Hao, L. (2019). Predicting protein structural classes for low-similarity sequences by evaluating different features. Knowledge-Based Systems, 163, 787–793. https://doi.org/10.1016/j.knosys.2018.10.007
- Zimmermann, O., & Hansmann, U. H. E. (2008). LOCUSTRA: Accurate prediction of local protein structure using a two-layer support vector machine approach. Journal of Chemical Information and Modeling, 48(9), 1903–1908. doi: 10.1021/CI800178A/SUPPL_FILE/CI800178A_SI_001.PDF.
- Zuo, Y. C., & Li, Q. Z. (2009). Using reduced amino acid composition to predict defensin family and subfamily: Integrating similarity measure and structural alphabet. Peptides, 30(10), 1788–1793. https://doi.org/10.1016/J.PEPTIDES.2009.06.032