
 ?Mathematical formulae have been encoded as MathML and are displayed in this HTML version using MathJax in order to improve their display. Uncheck the box to turn MathJax off. This feature requires Javascript. Click on a formula to zoom.
Abstract
Research has spotlighted glutathione transferase (GST) as a promising target for antimalarial drug development due to its pivotal role in cellular processes, including metabolizing toxins and managing oxidative stress. This interest arises from GST’s potential to combat multidrug resistance in existing antimalarial drugs. Plasmodium falciparum GST (PfGST) and Plasmodium vivax GST (PvGST) are key targets; inhibiting them not only disrupt detoxification but also reduce their antioxidant capacity, a critical feature for potent antimalarials. Bromosulfophthalein (BSP), a clinical liver function dye, emerged as a potent cytosolic GST inhibitor. This study explored BSP’s inhibitory properties on PfGST and PvGST, showcasing its binding capabilities through empirical and computational analyses. The study revealed BSP’s ability to significantly inhibit GST activity, altering the proteins’ structures and stability. Specifically, BSP binding induced spectral changes and impacted the proteins’ thermal stability, reducing their melting temperatures. Computational simulations highlighted BSP's strong binding to PfGST and PvGST at their dimer interface, stabilized by various interactions, including hydrogen bonds and van der Waals forces. Notably, BSP’s binding altered the proteins’ compactness and conformational dynamics, suggesting a potential non-competitive, allosteric inhibition mechanism. This study provided novel insights into BSP’s candidacy as an antimalarial drug by targeting PfGST and PvGST. Its ability to disrupt crucial functions of these enzymes’ positions BSP as a promising candidate for further drug development in combating malaria
Communicated by Ramaswamy H. Sarma
1. Introduction
The parasitic protozoan’s glutathione S-transferase (GST) enzyme has gained researchers’ attention as a potential drug target. It has continued to be studied, especially in Plasmodium falciparum and Plasmodium vivax, which are the two main malaria-causing agents in Africa and Asia, respectively (McQueen et al., Citation2021; Naing et al., Citation2019; Van Dorp et al., Citation2020). This is as the GST’s primary functions are seen in the nucleophilic addition of glutathione (GSH) to toxic compounds, reduction of hydroperoxides, and ultimately acts as a carrier protein (ligandin) of specific organic molecules. This process results in the inactivation and immobilization of these molecules (Colón-Lorenzo et al., Citation2020). The protective role in the form of detoxification of xenobiotics being exerted by Plasmodium falciparum glutathione S-transferase (PfGST) and Plasmodium vivax glutathione S-Transferase (PvGST) is thus one main reason they are both considered a unique drug targets towards the development of novel and hard-hitting antimalarials (Dasari, Ganjayi, et al., Citation2018; Dasari, Swamy, et al., 2018; Mangoyi et al., Citation2010; Quesada-Soriano et al., Citation2013, Citation2014). Glutathione S-transferase’s importance, as seen in Plasmodium species, is being an intra-erythrocytic relieving enzyme when it comes to oxidative stress stages in the parasite. This, coupled with the fact that it’s ubiquitously implicated in increased chloroquine resistance cells, makes their target an unexplored antimalaria drug therapy imperative. This is because these GSTs (PfGST and PvGST) intracellularly detoxify many hydrophobic and electrophilic substances as chemotherapeutic agents implicated in drug resistance evolution (Ahmed et al., Citation2021; Bhagat et al., Citation2019; Mohring et al., Citation2017, Citation2019).
Since the discovery of resistant and multidrug-resistant malaria-causing Plasmodium, first to the traditional quinolone, antifolate antibiotics, and later to the gold standard artemisinin combination therapy (ACTs) approved by the WHO, the search for a new and effective antimalaria and new drug target in Plasmodium has never been more compelling to researchers (Chigorimbo-Murefu et al., Citation2012; Zhan et al., Citation2015). This is because understanding the drug target mechanism has become pivotal to every scientific effort to develop target-based, novel, and potent antimalarials. This becomes imperative as insight into this mechanism will help to elucidate possible structural modifications of late-stage preclinical development of antimalarials or even postulate possible structural modifications to existing antimalarials that have hitherto been confronted with resistance and rendered ineffective (Calic et al., Citation2020; Shibeshi et al., Citation2020). Given the importance of malaria parasites’ GST in the detoxification of endogenous and xenobiotic compounds, among other functionalities which has been shown to enhance drug resistance ability to anti-parasitic and insecticides, the inhibition of this detoxification ability is thus worth targeting as a novel and effective antimalarial (Pawłowska et al., Citation2023). Also, studies have shown that aside from being identified as the major cause of DDT resistance to a human malaria parasite, GSTs have proven to be the most significant enzyme in chloroquine resistance (Lumjuan et al., Citation2005; Pawłowska et al., Citation2023; Sujitha et al., Citation2017).
Over time, traditional drug discovery and development processes have been bogged down in effectiveness due to exorbitancy and delayment. Computer-aided drug discovery (CADD) using computational modelling approaches to simulate drug receptor/ligand interactions has now been increasingly embraced and deployed for research and pharmacology (Chandel et al., Citation2018; Leelananda & Lindert, Citation2016). This drug receptor/ligand interaction is intended to be evaluated for the target’s binding and affinity. In addition, this study approach leverages the understanding that ligands can varyingly bind to the receptor or protein targets, with the binding either being hydrophobic, electrostatic, or hydrogen bonding (Bhunia et al., Citation2021; Choudhuri et al., Citation2023; Fu et al., Citation2018). This multidisciplinary technique is based on structure prediction, target identification, binding site prediction, and protein–ligand interaction. Understanding ligandin properties and binding abilities to drug targets have been employed in computational-aided drug design to change drug discovery processes and circumvent associated bottlenecks to traditional drug design approaches (Sabe et al., Citation2021; Sadybekov & Katritch, Citation2023).
There has been a paradigm shift in focus towards finding and utilizing cost-effective, safe, and hard-hitting small molecules for malaria treatment. To this end, this research novel employed bromosulfophthalein as an effective compound for malaria treatment in the face of resistance being confronted by the artemisinin-based combination therapy (ACT) imperative. Bromosulfophthalein (BSP) is an anionic phthalein, triphenylmethane dye having two sulfonic acid groups often greatly used in diagnosing liver injury through a liver function test. It has also been utilized to study transporters’ membranes which are responsible for the movement of reduced glutathione (GSH) as well as organicanions across cell membranes (Cui et al., Citation2020; Kolobe et al., Citation2004; Plaa, Citation2010; Valli & Achilonu, Citation2022, Citation2023). BSP’s disadvantage is first in its’ solubility, as it is insoluble in water, slightly soluble in ethanol, and some polar solvents. This solubility challenge is however solvable as BSP is found to be highly soluble in dimethyl sulfoxide (DMSO), a polar, aprotic solvent. DMSO’s miscibility with water and ability to dissolve an enormous catalogue of polar and nonpolar small molecules has made it a choice of solvent for many applications. Hence, its use in dissolving BSP. BSP with a molecular weight of 838 Da, which is well above the threshold weight for biliary excretion could also be another drawback. However, the many diverse applications of BSP as a drug have continued to gain attention (Cui et al., Citation2020; Soto et al., Citation2002; Szabo et al., Citation2013). While bromosulfophthalein’s (a purple phthalein dye) use transcends liver function clinically diagnostic, it has however not been explored as a potent inhibitor in malaria parasites. To this end and here in this study, BSP is empirically and computationally investigated as an essential ligandin for PfGST and PvGST. The findings in this study will ultimately position BSP as a novel drug candidate for malaria treatment. To the best of our knowledge, no study has either empirically or computationally investigated BSP in this regard.
2. Materials and methods
2.1. Materials
The BL21(DE3) vectors used were from New England BioLabs while both PfGST_pET11a and PvGST_pET11a vectors were synthesized by and purchased from GenScript Biotech, USA. The following materials like glutathione reduced (GSH), bromosulfophthalein (BSP), 1-chloro-2,4-dinitrobenzene (CDNB), and 8-anilino-1-naphthalenesulfonic acid (ANS) were all purchased from Sigma-Aldrich (St. Louis, Missouri, USA). Similarly, the other materials which were equally purchased from Sigma–Aldrich include isopropyl β-D-1-thiogalactopyranoside (IPTG), dimethyl sulfoxide (DMSO), ampicillin, and GSH-agarose. On the other hand, SYPRO Orange dye was purchased from Thermo Fisher Scientific, USA. High-performance gaming computers with Maestro algorithm configurations were used for the computational studies.
2.2. Methods
2.2.1. Recombinant overexpression of PfGST, PvGST in E.coli and purification
High transformation efficient chemically competent E.coli BL21(DE3) cells were respectively used to transform PfGST_pET11a and PvGST_pET11a vectors (GenScript), using a heat shock treatment procedure. The transformation process was concluded by spreading 100 µL of the resuspended recombinant solution on a Luria-Bertani (LB) agar plate supplemented appropriately with 100 µL of ampicillin. A singularly distinct colony from the respective overnight (16 h) incubated plates were separately inoculated into a 2× yeast tryptone (2YT) media [1% (v/v) yeast, 1.6% (w/v) tryptone, 0.5% (w/v) NaCl] which has been appropriately supplemented with 100 µL ampicillin and then incubated overnight (37 °C, 250 rpm). An optical density (OD600) of 0.6 was allowed before adding 0.5 mM IPTG, 6 hr to induce protein overexpression. An immobilized metal affinity chromatography (IMAC) purification procedure was employed for the purification of the two proteins using a separate 5 mL (1.6 × 2.5 cm) cobalt [Co(II)] charged HisTrap® column, GE Healthcare, Sweden connected to the ÄKTA Start Purifier, Cytiva life sciences, USA. A one-step elution method using 50 mM sodium phosphate, 500 mM imidazole, 0.01% (w/v) NaN3, and pH 7.2 was employed to obtain purified PfGST and PvGST used for the various empirical studies.
2.2.2. Enzymatic and inhibitory assay of PfGST and PvGST
Employing GSTs’ conjugation ability exhibitable by reduced glutathione toward l-chloro-2,4-dinitrobenzene (CDNB), PfGST and PvGST’s enzymatic specific activity was spectrophotometrically determined (Habig & Jakoby, Citation1981). This is by measuring the conjugation product formed, which is 1-(S-glutathionyl)-2,4 dinitrobenzene. This dinitrophenyl thioether chromophore product formed was measured using a Jasco V-730 BIO spectrophotometer with a 3 mL glass quartz cuvette. The ɛ340 of 9600 M−1.cm−1 and 340 nm absorbance were parameters observed when this activity was monitored spectrophotometrically. The activity assay was carried out at 20 °C for 60 s. It was equally carried out in triplicate using a reaction buffer containing 100 mM sodium phosphate, 5 mM GSH, 1 mM CDNB (3% (v/v) ethanol), 1 mM EDTA, 5 mM DTT, 0.02% NaN3, pH 6.5.
This assay was carried out using different concentrations of PfGST and PvGST in the presence and absence of 0.5 mM BSP. The results were subsequently corrected for linear progress curves and background non-enzymatic reaction rates.
2.2.3. Extrinsic ANS fluorescence spectroscopic analysis of PfGST, PvGST, and BSP complex
The apo proteins and their respective complexes’ tertiary structure conformation were evaluated using a JASCO FP-6300 spectrofluorometer machine with installed Spectra Manager software v1.5.00 (Jasco Inc., Tokyo, Japan). Utilizing 8-anilino-1-naphthalenesulfonic acid (ANS)’s ability as an extrinsic probe to fluorescently bind to protein’s hydrophobic pockets, the structural conformation and interaction of PfGST and PvGST in the presence and absence of BSP as a ligand was carried out. The apo PfGST and PvGST samples 5 µM each, in 10 mM sodium phosphate, 200 µM ANS, 1 mM EDTA, 2 mM DTT, 0.02% (w/v) NaN3, pH 7, were spectroscopically analyzed using a 10 mm pathlength quartz cuvette at 20 °C. Their fluorescence emission spectra were at an excitation of 395 nm and between 400 and 650 nm wavelength. A 1 cm path length, excitation bandwidth of 5 nm, 2.5 nm emission with data pitch of 1 nm, and scanning speed of 200 nm/min were recorded in triplicate. The buffer was corrected before being averaged. This procedure was repeated in the presence of reduced glutathione (GSH), a GST substrate.
Bromosulfophthalein’s ligandin and binding effect on both PfGST and PvGST’s hydrophobic cleft was also carried out. Before spectra measurement, 1 mM BSP was separately incubated with 5 µM PfGST and PvGST in the presence and absence of GSH for 30 min. In this monitored spectroscopic analysis, spectra signals at three accumulations were averaged and recorded. Recorded spectra were buffer-corrected before the fluorescence intensities in the presence of BSP were also corrected for the inner filter effect to account for any absorption of excitation (primary) and emission (secondary) light.
2.2.4. Stability elucidation of PfGST, PvGST, and BSP complex by thermal shift assay
The apo PfGST and PvGST’s protein stability in the presence of glutathione (substrate) and their interaction with bromosulfophthalein (ligand) was tested through a thermal shift assay (TSA). Employing the use of a CFX96 Touch-Real-Time qPCR detection system (Bio-Rad Laboratories, Inc., Hercules, CA, USA), the thermal denaturation of PfGST, PvGST, PfGST:GSH, PvGST:GSH, PfGST:BSP, PvGST:BSP, PfGST:GSH:BSP, and PvGST:GSH:BSP were elucidatorily studied. They were studied with respect to their stability using a naturally quenched fluorescent dye (SYPRO Orange dye) as a probe on an environment-sensitive 96-well PCR plate. The 96-well plate was prepared with each well containing a sample mix of 1.5 mg/mL PfGST or PvGST in 100 mM NaH2P04, 1 mM DTT, 1 mM EDTA, ± 5 mM GSH, ± 1 mM BSP. Equally, 5 µL diluted SYPRO Orange dye was added before it was briefly spun down on a microplate centrifuge to ensure mixing. This was done before placing it in the qPCR machine. At a set temperature range of 20 °C − 90 °C, with 0.5 °C increments for 10 s each, the dye interacts with the sample’s hydrophobic core. This interaction becomes visible upon denaturation leading to the dye’s fluorescence quantum yield increasing when bound to exposed hydrophobic patches on a thermally denatured protein. Each sample’s melting curve and melt peak were resolved using the CFX Maestro software and plotted as relative fluorescence unit (RFU) vs temperature (°C). Replicates were averaged and corrected with buffer blanks. The sample’s melting temperature (Tm) which represents the lowest point of the melting curve was then derived from the plot (−d(RFU)/dT).
2.2.5. PfGST and PvGST’s steady-state kinetics determination
PfGST and PvGST’s steady-state kinetics parameters in the presence of GSH and BSP were spectrophotometrically determined. Utilizing the CDNB-GSH conjugation activity assay procedure, the following steady-state kinetic parameters Vmax, KM, kcat and kcat/KM were determined. The assays were performed with the addition of 100 µL of varying GSH concentration to 2900 µL of reaction buffer separately containing 1.5 mg/mL of PfGST or PvGST, 100 mM NaH2P04, 1 mM DTT, 1 mM EDTA, and 1 mM CDNB. Vmax and Km were determined from a non-linear regression Michaelis-Menten plot. The slope of a Lineweaver-Burke linear plot of substrate concentration versus activity was used to determine the catalytic efficiency (kcat/KM)
2.3. Computational modelling studies
2.3.1. Computational software and hardware
Two high-performance computing units were used for this study. These computing units were equipped with specialized configurations. They are a 16 CPU Intel core i7 5960x extreme edition (3.3 GHz, 20 M cache 16× cores), Nvidia GTX 750Ti graphics card, 32 GB DDR4-2133 MHz memory on an MSI X99 motherboard and a 264 GB RAM. Also, an implementable Schrödinger Maestro v13.0 Windows OS desktop was used for a part of the computational study. The study components that use the Windows OS desktop include protein–ligand preparation and induced fit ligand docking. While a similar computing unit was used for the molecular dynamics simulations studies, on the other hand, the post-dynamic analyses were carried out on an equipped Linux computing unit.
2.3.2. Apo PfGST, PvGST, and ligand preparation
Protein structure processing is essential before molecular docking. This is to put the protein into a dockable conformation. In achieving this, the PfGST crystal structure with PDB ID 2AAW was retrieved from a Research Collaboration for Structural Bioinformatics Protein Data Bank (RCSB PDB) repository. For PvGST, the computed alpha fold structure with UniProtKB ID Q0ZS46 was similarly retrieved in the absence of a solved crystallographic structure. Both structures were submitted to the Maestro v13.0 molecular modelling algorithms’ protein preparation wizard module. They were subsequently pre-processed by allotting them bond orders, adding hydrogen atoms, making zero bond orders to metals, and disulphide bonds before water molecules (having 5 Ǻ) and solvent molecules were removed from hydrogen atoms as well as deleting Na+ from the coordinates. They were further processed by optimizing the hydrogen bonding network with water orientation sampling with the use of the PROKA algorithm, pH 7.0, after which non-water molecules in comparison with water molecules which are less than 3 hydrogen bonds, were deleted. In concluding the protein preparation for docking studies, the respective structures were subsequently refined, and refrains were placed on the heavy atoms with the use of the OPLS_2005 force field. The converging of heavy atoms to an RMSD value of 0.3 Ǻ was set as the cut-off to terminate the minimization process with the stoichiometry of the side chain checked for no induced perturbations which may happened in the course of structure preparation. The minimized structures were then saved as Maestro (.mae) files for subsequent prediction analysis.
The ligand (BSP) was also prepared by first extracting its structure data files (SDF) from a database, public repository for information on chemical substances and their biological activities (PubChem) with a corresponding ID of CID:6282. This file was then submitted to the Maestro v13.0 module known as LigPrep for ligand preparation involving energy minimization with the use of the OPLS_2005 force field. An Epik module algorithm was used to both generate possible states at pH 7.0 ± 2 and predict the pKa. The ligand was then desalted before generating its possible tautomeric states at pH 7.0 ± 2. In addition to this, molecules with multiple chiral centres were either retained or varied so as to return chemically useful structures having low energy states and then saved in Maestro (.mae) files in readiness for the induced fit docking procedure.
2.3.3. Computational-based drug-likeness and ADMET predictions
The evaluation of BSP’s drug-likeness via a computational-based pharmacological and pharmacokinetic analysis was carried out using a web server known as SwissADME (http://swissadme.ch). This analysis employs the Canonical transformation of BSP’s simplified molecular-input entry system (SMILES)’ structure according to methods previously discussed (Cheng et al., Citation2012; Daina et al., Citation2017). BSP’s molecular weight, lipophilicity (MlogP), hydrogen bond acceptors and hydrogen bond donor number were assessed for drug-likeness (according to Lipinski’s rule of five) using SwissADME. Also, the toxicity evaluation of BSP (based on parameters such as hepatotoxicity, carcinogenicity, mutagenicity, cytotoxicity, LD50 (mg/kg) and toxicity class) was predicted using an online server known as ProTox-II (https://tox-new.charite.de/protox_II/) (Banerjee et al., Citation2018; Lipinski et al., Citation1997). Similarly, and given the criticality of assessing the absorption, distribution, metabolism, and excretion (ADME) properties in drug discovery, these properties are equally evaluated for BSP’s pharmacokinetic profile.
2.3.4. Induced fit ligand docking
A Schrödinger Maestro v13.0 algorithm is implementable induced fit ligand docking was employed in evaluating BSP’s binding to PfGST and PvGST. This is through the protein’s ligand-binding site geometry, which is vitally dependable upon the protein’s structure-ligand inducible conformational changes at binding. For the binding evaluation and because of the enzymes’ two possible binding sites, which include the GSH binding site (G-site) and the xenobiotic binding site (H-site) (Fritz-Wolf et al., Citation2003), both chains A and B (whole dimer) were selected as the binding site. For this process, an OPLS_2005 force field implicit solvent model was used. For the induced fit ligand docking protocol, both ring conformational sampling with a 2.5 kcal/mol energy barrier and a non-planar conformation penalty on amide bonds were applied.
2.3.5. Molecular dynamic simulation
To both increase the reliability of the docking results and gain deeper insight into how BSP affects the functionalities of PfGST and PvGST, further computational studies, and molecular dynamic simulations (MDS) at 500 ns simulations were carried out. This was with the use of a Maestro v13.0 implemented GPU-enabled Desmond molecular dynamics simulation engine. The BSP:PfGST and BSP:PvGST complexes’ top-scoring poses were first saved as a PDB file before submission for Desmond MD simulations studies on a Linux (Ubuntu) desktop. A System Builder module implemented in the Desmond algorithm was previously used to build four systems (PfGST, PvGST, BSP:PfGST, and BSP:PvGST) in readiness for the simulation. A transferable intermolecular potential with a three-point (TIP3P) explicit solvent model using the OPLS_2005 force field was then used to solvate the systems. In the same breath, the apo PfGST and PvGST were placed in a periodic orthorhombic box (distance from the box face to the outermost protein/ligand atom was set at 10 Å, the box angle was α = β = γ = 90°). This is done to initialize the systems. On the other hand, both apo and liganded PfGST and PvGST were first minimized before counter ions were added to neutralize the systems. The addition of 0.15 M NaCl into the solvent box was done to condition the system physiologically. The systems were then submitted for the molecular dynamics production phase subsequent to these explicit solvent model solvation and ionization procedures. The short simulation steps comprise eight distinct steps. These steps are made up of 2 identifiable phases, namely the equilibrium phase (steps 1-7) and the long, final simulation stage, which is step 8. A 500 ns total production stage was performed. While parameters of the solvated system type were detected in step 1, on the other hand in step 2, an NVT-conditioned Brownian Dynamics was performed at 10K and 100 ps simulation, with restraints placed on solute-heavy atoms. Similarly, while restraints were still put on heavy atoms at step 3, a 12 ps simulation was performed under NVT conditions at 10K. Also, while short simulation steps of 12, 12, and 24 ps were performed for steps 4, 6, and 7, respectively, the pocket solvation was omitted for step 5. While that was carried out under NPT conditions at 10K, restraints were only placed on heavy atoms at steps 4 and 6 alone but not on step 7. The long and final stage (Step 8) in concluding the MDS was performed at a constant temperature (300 K) for 500 ns.
2.3.6. Post dynamic analyses
The derived trajectories from the MDS studies were further subjected to post-dynamic analyses using a Schrodinger Maestro v13.0 to compare the protein structures. This includes the Simulation Quality Analysis (implemented in Maestro v13.0) of the simulation qualities in terms of average energy, pressure, temperature, and volume of the individual simulated systems. Similarly, the implemented Maestro v13.0 Simulation Interaction Diagram algorithm was used to analyze the alpha carbon atoms (Cα)’s root-mean-square-deviation (RMSD), ligand’s RMSD vis-a-vis the receptors. Also, the residues’ root-mean-square fluctuations (RMSF), secondary structure element analysis and protein-ligand interaction were equally analyzed. In the same vein, Maestro v13.0 implemented Simulation Events Analysis algorithm was used to analyze the radius of gyration (Rg) and atomic distance calculations. At the same time, the average representative cluster’s determination was determined using a Desmond implemented Cα RMSD trajectory clustering algorithm.
2.3.7. Post-simulation MM/GBSA binding free energy calculations
In providing valuable insights into the energetics of BSP interactions with PfGST and PvGST and to complement the structural information obtained from the simulations, molecular mechanics/generalized born solvent area (MM/GBSA) calculations were performed. This was done using an MM/GBSA algorithm implementable in Schrodinger Maestro v13.0 and according to previously reported methods (Kollman et al., Citation2000; Massova & Kollman, Citation2000; Tsui & Case, Citation2000; Wang et al., Citation2019). For each of the PfGST:BSP and PvGST:BSP complexes, 2000 independent snapshots (of the 500 ns molecular dynamics simulations) of binding energies were generated, averaged, and calculated with BSP’s binding-free energy (ΔGbind) active site calculated following the given equation:
(1)
(1)
where ΔGbind in the equation denotes the free energy binding, ΔGRL represents the free energy of the protein–ligand complex; ΔGR denotes the free energy of the receptor, and ΔGL the free energy of the ligand. The binding-free energy is important to be calculated, as it establishes a given protein–ligand binding affinity. Given that, a more negative ΔG is an indication of better binding of the ligand to the protein (Gilson et al., Citation1997). In the light above, each state’s free energy was calculated with the use of the FF14SB force field, given by the equations:
(2)
(2)
(3)
(3)
(4)
(4)
(5)
(5)
The gas phase energy (Egas) which is the sum of the internal energy (Eint), Coulomb energy (Eele) and the van der Waals energies (EvdW) were estimated by the terms of the FF14SB force field. For the solvation free energy (ΔGsol) estimation, the contributions of energy from the polar states (GGB) and non-polar states (GSA) were accordingly used. While the non-polar solvation energy (GSA) was derived using the solvent accessible surface area (SASA in Å2), the contribution from polar solvation (GGB) was determined by solving the Generalized Born equation. In the equation above, the solute’s total entropy and temperature were represented by S and T respectively. The total binding free energy profile contributions between BSP:PfGST and BSP:PvGST as per-residue free energy decomposition were estimated at the atomic level residues with the use of MM/GBSA implemented in Maestro v13.0.
2.3.8. Principal component analysis
Further to the knowledge that conformational differences adopted by proteins impact their functions and because protein’s total conformational changes are influenced by their collective atom movements, hence a Principal Component Analysis (PCA) was performed (Elseginy, Citation2023; Ernst et al., Citation2015; Pérez-Peña et al., Citation2023). This multivariate statistical technique known as PCA was additionally employed to study BSP’s binding effect on PfGST and PvGST’s dynamics by deconvoluting their Cα-RMSD, RMSF and Rg simulation trajectories. This analysis was carried out with the imputing of Cα-RMSD and RMSF MD simulation structural datasets into an RStudio statistical program to generate a principal component (PC) phase
3. Results and discussion
3.1. Recombinantly heterologous overexpression of PfGST, PvGST and purification
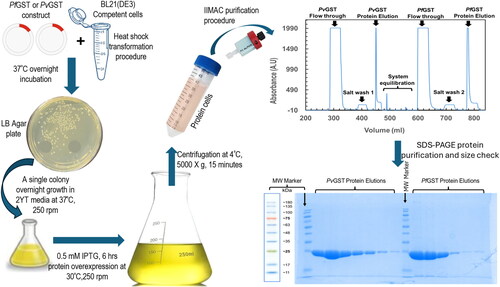
In this study, both the PfGST and PvGST constructs, which were purchased from GenScript (New Jersey, USA), were transformed in E. coli BL 21(DE3) cells. This was followed by recombinantly and heterologously overexpressing their separate transformed mix using 0.50 mM IPTG for a period of 6 h at 30 °C. The overexpressed PfGST and PvGST cells were chromatographically purified using a one-step immobilized metal affinity chromatography (IMAC) method on an ÄKTA Start Purifier, Cytiva Life Sciences, USA. The purification results in 15 mg and 10 mg per litre of uncontaminated, soluble, and active PfGST and PvGST proteins respectively, when spectrophotometrically determined (UV–Vis spectrophotometer V-730, JASCO Europe). The purity of the recombinant PfGST and PvGST were confirmed by sodium dodecyl-sulfate polyacrylamide gel electrophoresis (SDS-PAGE). This is as well as confirming their sizes to be approximately 25 kDa and 24.50 kDa, respectively () which corresponds to their sub-unit’s theoretical molecular weights. These results revealed a high-yield soluble and pure protein free from DNA and other contaminants that can be used for further downstream characterization
Figure 1. Schematic description of the recombinant overexpression and purification processes of PfGST and PvGST. The construct’s transformation in BL21(DE3) competent cells were successful as evident from the yield of single and distinct colonies on the LB plates. The 0.50 mM overexpressed was successfully purified using a one-step IMAC procedure. The PfGST and PvGST proteins were found to be pure, and their sizes correspond to the approximately 25 kDa theoretical sizes.
3.2. Enzymatic and inhibitory assay of PfGST and PvGST
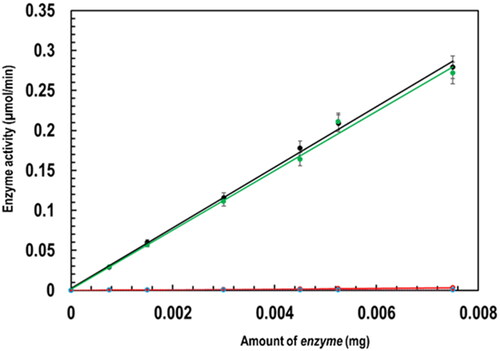
Both PfGST and PvGST were spectrophotometrically assayed for their enzymatic activity according to the method described in Section 2.2.2 above. They were found to be catalytically and enzymatically active with their specific activity evaluated to be 38.00 and 37.03 µmol/min/mg respectively in the absence of BSP.
Their enzymatic activities were, however, found to be completely inhibited in the presence of BSP as an inhibitor, with their respective specific activity evaluated to be 0.30 µmol/min/mg, which is a 99% inhibition. This significant inhibition of the enzymatic activities of both PfGST and PvGST is graphically seen in the flattening of the straight line as shown in . GST’s catalytic/enzymatic activities as a bi-substrate detoxification enzyme, which primarily catalyzes xenobiotics to its hydrophobic site (H-site) (Al-Qattan et al., Citation2016; Makumbe et al., Citation2024) were disrupted by the interaction of BSP at the H-site and the dimer interphase. This inhibition of GST in Plasmodium falciparum and Plasmodium vivax will no doubt make them (PfGST and PvGST) a critical target for the development of potent antimalarials. This BSP’s inhibition propensity on these enzymes agrees with other published results obtained from our research group (Padi et al., Citation2021; Pooe et al., Citation2021).
Figure 2. Characterization of PfGST and PvGST in terms of their enzymatic specific activity in the presence and absence of BSP through a GSH-CDNB conjugation assay (100 mM NaH2PO4 pH 7.2, 1 mM EDTA, 1 mM DTT, 5 mM GSH pH 6.5, 30 mM CDNB, and 1 mM BSP) monitored spectroscopically showing PfGST’s specific activity (black), PvGST’s specific activity (green), PfGST:BSP’s specific activity (red), and PvGST:BSP’s specific activity (blue).
3.3. Extrinsic ANS fluorescence spectroscopic analysis of PfGST, PvGST, and BSP complex
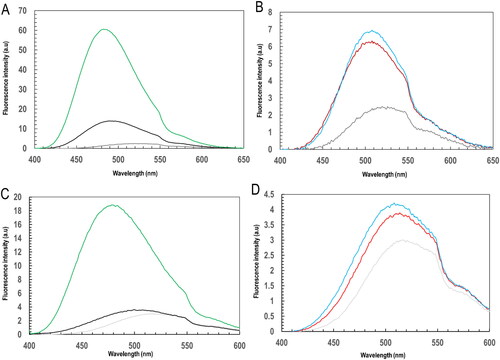
The extrinsic anionic dye, 1-anilinonaphthalene-8-sulfonic acid (ANS) was used to probe the ligandin binding of BSP to PfGST and PvGST as shown in . An observed emission spectra shifts and changes show protein tertiary structural features with respect to ANS-accessible hydrophobic pockets (Pooe et al., Citation2022; Sayed et al., Citation2000). Hence at 395 nm excitation, a fluorescence emission maxima of free ANS from 525 nm to 490 nm and 480 nm for ANS bound PfGST and PvGST respectively can be observed as shown in . ANS bound PvGST however had a higher fluorescence intensity, an indication that PvGST’s hydrophobic pockets were more accessible for the ANS than that of PfGST. A slight emission shift with lowered fluorescence intensity to 495 nm and 485 nm for PfGST:GSH:ANS and PvGST:GSH:ANS respectively were equally observed (). This is an indication that GSH does not either bind or displace ANS at the hydrophobic pocket (H-site), but it nonetheless alters the protein’s surface hydrophobicity. This result is supported by the established theory of GSH’s binding specificity to GST’s G-site rather than the H-site (Akumadu et al., Citation2020). However, BSP-complexed PfGST and PvGST are blue-shifted to 510 nm and 515 nm respectively (). This is an indication of BSP bounding to the H-site hydrophobic clefts of the protein and causing alteration in the conformational integrity of both PfGST and PvGST’s tertiary structure. A decrease in the fluorescence intensity (quenching) however indicates the displacement of ANS upon binding of BSP. On the other hand, BSP complexed PfGST and PvGST in the presence of reduced GSH showed a fluorescence emission maxima at 513 nm for both PfGST:GSH:BSP and PvGST:GSH:BSP and further quenching (). This then shows that while GSH binding to the G-site does not alter the binding of BSP to PfGST and PvGST, it, however, helped to stabilize the surface hydrophobicity of the two proteins for the binding of BSP to the H-site. This result is consistent with other published work which showed BSP bind at GST’s H-site (Akumadu et al., Citation2020; Padi et al., Citation2021).
Figure 3. Ligandin activity of PfGST and PvGST through ANS fluorescence spectroscopy towards BSP and its effect on their tertiary structural conformation. A spectrofluorometric monitored ANS fluorescence emission at 395 nm excitation showing (A) emission spectrum of free ANS (grey), ANS bound PfGST (black) and ANS bound PvGST (green), (B) BSP complexed proteins’ emission spectrum of PfGST:BSP (red) and PvGST:BSP (blue), (C) reduced GSH incubated protein’s emission spectrum of PfGST-GSH (black) and PvGST-GSH (green), and (D) BSP complexed and GSH incubated proteins’ emission spectrum for PfGST:GSH:BSP (red) and PvGST:GSH:BSP (blue).
3.4. Stability elucidation of PfGST and PvGST in the presence of BSP and/or GSH by thermal shift assay
The protein’s thermal stability measurement and the detection of protein–ligand interaction were carried out using the fluorescence thermal shift assay technique with CFX96 Touch Real-Time PCR Detection System (BIO-RAD). The stability of native PfGST and PvGST, PfGST:GSH, and PvGST:GSH PfGST:BSP, PvGST:BSP, PfGST:GSH:BSP, and PvGST:GSH:BSP’s were all evaluated. This was through denaturation with increasing temperature from 25 °C to 65 °C which was in conjunction with the binding of SYPRO Orange dye as shown in .
Figure 4. Profiles for the thermal stability using melting peak temperature of PfGST and PvGST in the presence and absence of GSH and BSP at temperature between 25 °C and 65 °C using a qPCR differential scanning fluorimetry evaluation. The fluorescence thermal shift assay was carried out in 100 mM NaH2P04, 1 mM DTT, and 1 mM EDTA, pH ± 1 mM GSH, ± BSP, with sample monitored in triplicate. The derived -d(RFU)/dT against temperature (C) plots showing melting peak temperature Tm in °C of (A) PfGST (black) and PvGST (green), (B) PfGST:GSH (black) and PvGST:GSH (green), (C) PfGST:BSP (red) and PvGST:BSP (blue), and (D) PfGST:GSH:BSP (red) and PvGST:GSH:BSP (blue).
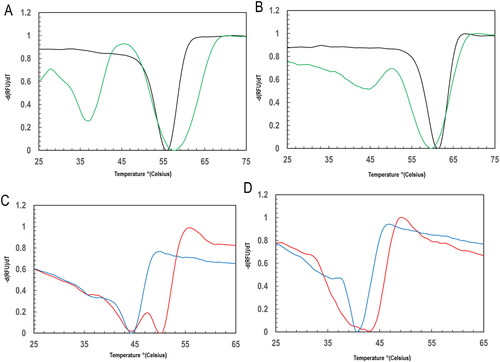
Utilizing the dye’s propensity for hydrophobic patches, which is seen in increased quantum yield, the apo PfGST’s Tm of 56 ± 0.5 °C and PvGST’s Tm of 58 ± 0.5 °C was observed (). This is so as the room temperature stable apo protein begins to unfold, thereby making the hydrophobic regions more accessible to the dye. On the one hand, the substrate GSH’s specificity and binding to the proteins’ G-site do not displace the SYPRO Orange dye (which binds to the H-site) enhancing the stability of the two proteins. BSP significantly and expectedly makes PfGST and PvGST less stable.
Table 1. Summary of the melt peaks showing the stability of PfGST and PvGST in the Presence of GSH and BSP.
3.5. PfGST and PvGST’s steady-state kinetics studies
Following the similarly performed CDNB-GSH conjugation activity assay, steady-state kinetic parameters of PfGST and PvGST in the presence and absence of BSP were determined and graphically represented in . The parameters summarized in were deduced from the steady-state kinetics of PfGST and PvGST towards GSH using the Michaelis-Menten sigmoidal curve and the Lineweaver-Burk straight line plots.
Figure 5. Plots towards the determination of the steady-state kinetic parameters of PfGST and PvGST towards GSH in the presence and absence of BSP using Michaelis-Menten and Lineweaver-Burke models at varying GSH concentrations. (A). A Michaelis-Menten plot of 300 nM PfGST (black) and PvGST (green), (B). A Lineweaver-Burke straight line steady-state kinetics plot of PfGST (black) and PvGST (green), (C). Michaelis-Menten plot of 300 nM PfGST in the presence of 0.5 mM BSP (red) and PvGST in the presence of 0.5 mM BSP (blue), and (D). A Lineweaver-Burke straight line steady-state kinetics plot of PfGST in the presence of 0.5 mM BSP (red) and PvGST in the presence of 0.5 mM BSP (blue).
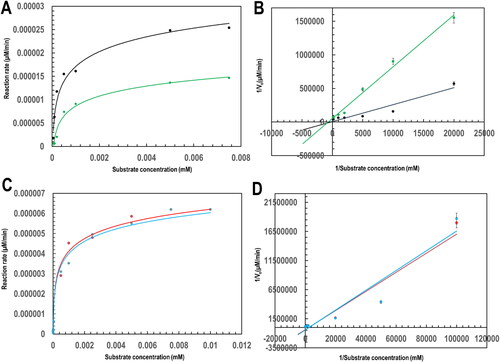
Table 2. Steady-state kinetic evaluation of PfGST and PvGST in the presence and absence of BSP.
The steady-state kinetic parameters revealed the PfGST and PvGST’s reaction maximum rate (Vmax) at the point when the enzymes’ active sites are GSH-saturated. It also shows the substrate concentration (KM) at 50% reaction rate (Vmax) and the enzymes’ catalytic efficiency. This catalytic efficiency is otherwise known as the reactions’ second-order rate constant rate (kcat/KM) towards GSH. These parameters were 97.56%, 84.67%, and 85.10%, respectively, decreased for PfGST in the presence of 0.5 mM BSP. Similarly, there are 87.10%, 69.66%, and 52.91% respective reductions in the steady-state kinetic parameters of the same 0.5 mM BSP complexed PvGST (). These reductions of PfGST and PvGST’s steady-state kinetics Vmax, KM, and kcat/KM indicate BSP’s uncompetitive inhibition activity in both PfGST and PvGST. The non-linear regression (Michaelis-Menten hyperbolic) plots are shown in , and the linear reciprocal plots (Lineweaver-Burke plots) are shown in , respectively. The plots have robustly and precisely aided the determination of the kinetic parameters (Vmax, KM, kcat, and kcat/KM) and the visualization of the mode of inhibition of BSP.
3.6. Computational studies result and discussion
In light of Lipinski’s rule of five which allows for examining the drug-likeness of a drug candidate by delineating the relationship between the compound’s pharmacokinetic and physicochemical parameters, a SwissADME and ProTox-II servers were used to predict BSP’s drug-likeness and toxicity respectively. gives the summary of BSP’s ADME and toxicity parameters and shows that BSP only violates one of Lipinski’s rule of five (MW > 500) and falls within acceptability regions for most toxicity parameters. Other ADME parameters such as a MlogP which is less than 4.15; hydrogen bond acceptors, which is equal to 10; and hydrogen bond donors of less than 5, all validated the drug-likeness of BSP. From the toxicity parameters, BSP was predicted to belong to toxicity class 4 and was inactive for hepatoxicity, carcinogenicity, and mutagenicity, and only active for immunotoxicity. The drug-likeness and crucial information on the pharmacokinetic and toxicological aspects of BSP as predicted shows that BSP can be positioned as a potential drug to be therapeutically employed for the treatment of antimalaria.
Table 3. BSP’s predicted physicochemical descriptors, ADMET parameters, pharmacokinetic properties, and its’ drug-like nature.
Also, given the richness of information MDS can provide at the atomistic level, especially in terms of ligand–receptor interactions, mobility, and stability, we, therefore, employed this computational tool to computationally evaluate and validate the ligandin properties of PfGST and PvGST towards BSP. From the induced fit docking results, BSP strongly binds exergonically with PfGST and PvGST () in an interaction process that is accompanied with protein-ligand complex negative Emodel energy and Glide gscores.
Figure 6. Protein–ligand complex ribbon representation of the induced fit docking best pose for (A) PfGST:BSP complex, (B) PvGST:BSP, showing BSP binding at the dimer interphase of PfGST and PvGST. The image is a snapshot from the induced fit ligand docking algorithm implemented in Schrodinger Maestro v13.0.
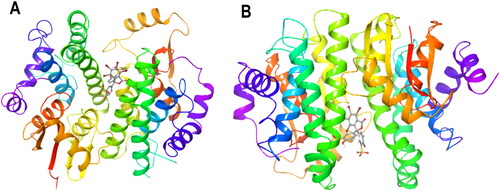
Although the docking poses, docking score, Glide gscore and IFD score of PfGST:BSP are 17, −8.771, −126.314, and −827.860, respectively, and for PvGST:BSP are 35, −8.330, −9.657, and −915.770 respectively, however, the docking with best Emodel energy, which are −126.314 and −130.735 for PfGST:BSP and PvGST:BSP, respectively, were submitted for the molecular dynamic simulations.
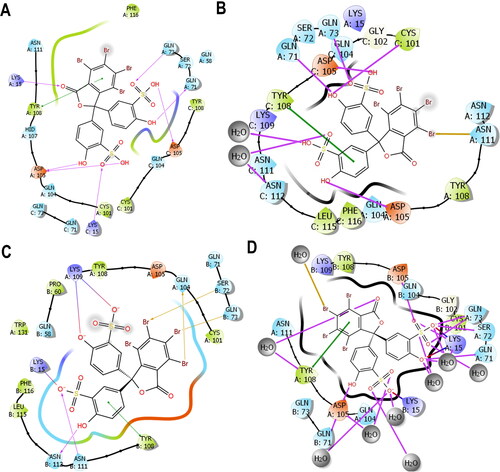
Predictably, and preferentially too, the IFD shows that BSP binds at the dimer interphase of both PfGST and PvGST as shown in , with amino acids side chains from the protein subunits contributing to the binding. Polar side chains (namely Gln73, Gln 71, Gln 104, Ser72, Asn 111) were mostly involved in the binding interaction in both PfGST and PvGST (). Additionally, side chains with charged functional groups such as Asp105 and Lys15 in PfGST and Lys109, Lys15 in PvGST were also involved. However, Tyr108 is seen to be involved in π–π* interaction with BSP’s phenyl moiety in both PfGST and PvGST (), and this agrees with other published results from our research group (Padi et al., Citation2021; Valli & Achilonu, Citation2023).
Figure 7. 2D ligand interaction plot highlighting the side chains involved in the binding between the interaction of (A) IFD docking pose of BSP with PfGST and (B) amino acid residue’s position of BSP with PfGST over 500 ns simulation. (C) IFD docking of BSP with PvGST and (D) amino acid residue’s position of BSP with PvGST over 500 ns simulation. Tyr108 is seen as the only non-polar amino side chains (green) involved in π–π* interaction with BSP’s phenyl moiety in both PfGST and PvGST, while similar amino residues’ involvement were seen during docking and the average simulation time. These Images were snapshots from the Maestro 2D interaction diagram implemented in Schrödinger Maestro 13.0.
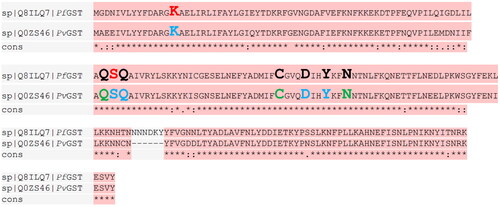
Also, while utilizing an online multiple sequence alignment algorithm package known as T-Coffee Expresso (Expresso™), having its server hosted by the Centre for Genomic Regulation (Barcelona), the PfGST (Q8ILQ7) sequence and that of PvGST (Q0ZS46) were structurally aligned for similarly specific consensus amino acids residues involved in the binding interaction of BSP with PfGST and PvGST (). Lys15,105, Gln71,73, Cys101, Asp 105, and Tyr108 were all involved in this binding interaction, an indication of similar atomistic binding interaction in both proteins.
Figure 8. PfGST and PvGST’s structural alignment and sequence analysis reveal the similarity in positions of the amino acid residues taking part in the bonding and simulation interactions using Expresso™. Lys15, Gln 71, Gln 73, Ser72, Cys101, Asp105, Tyr108, and Asn111 were all conserved in both proteins.
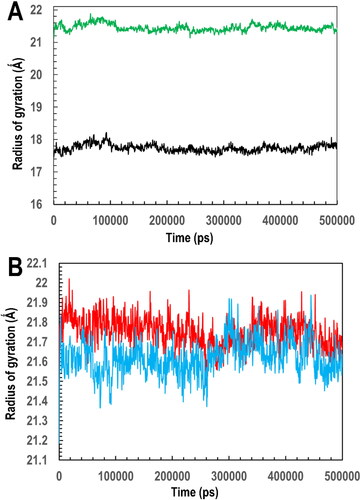
Following that, the interactions’ stability between PfGST:BSP and PvGST:BSP was evaluated using MDS. Data obtained using the Simulation Quality Analysis algorithm reveal the simulated systems’ overall quality. From the results (), the four systems were adequately equilibrated. This is because there is no significant variation with respect to the simulated systems’ (PfGST vs PfGST:BSP and PvGST vs PvGST:BSP) energy, volume, pressure, and temperature throughout the 500 ns simulation. Since the radius of gyration (Rg) measures the degree of structural compactness during the MD simulation, hence with the use of the Simulation Event Analysis algorithm, the average Rg (±SD) of the Cα atoms during the 500 ns MD simulations time of the four systems were evaluated. They are 17.80 ± 0.35 and 21.40 ± 0.35 for the apo PfGST and PvGST respectively and 21.75 ± 0.25 and 21.65 ± 0.25 for the PfGST:BSP and PvGST:BSP, respectively. Given that previous studies have established that lower Rg values indicate a structurally compact system, which translates to system stability, while higher Rg values suggest less compactness and potential instability, hence the results become deductible.
Table 4. Simulation quality analysis parameters and data of the four systems the 500 ns MD.
Meanwhile, the Rg profile across PvGST and PvGST:BSP systems shows comparability, as there were no significant deviations in the average Rg throughout the 500 ns simulation time. This shows that there were moderate conformation changes throughout the simulation time, compared. However, there is a significant deviation (of 3.95 Å) between PfGST and PfGST:BSP systems, an indication that BSP impacts the compactness of PfGST upon binding. This might be unconnected to the bulky molecule-like size of BSP which is capable of altering the overall confirmation of the very dynamic PfGST. However, the apo’s (PfGST and PvGST) Rg profiles were not closely alike, an indication of different structural compactness or conformational stability and dynamics of these two systems. On the other hand, the Rg profile of the two BSP complexed systems (PfGST:BSP and PvGST:BSP) are comparable, which is an indication that BSP’s bulky molecule-like size has a similar effect on the structural compactness of both PfGST and PvGST during the simulation time. The highest Rg is observed in PfGST:BSP, followed by PvGST:BSP, PvGST, and PfGST. While the mobility pattern obtained for BSP bound PvGST did not show significant mobility difference, though the PvGST:BSP’s system exhibited a Rg pattern that is higher than that of PvGST. But with respect to BSP bound PfGST, there is a clear show of mobility difference between the PfGST:BSP and the apo PfGST, indicating a higher conferment of inactivity. This is in the face of the established fact that a lower Rg values is indicative of a structurally compact system, which translates to system stability. On the other hand, a higher Rg values is suggestive of a less compactness and potential instability. This will impact inactivity on the protein.
Figure 9. Simulation event analysis generated profile showing (A) the radius of gyration (Rg) of the apo systems of PfGST (black) and PvGST (green). (B) the radius of gyration (Rg) of the protein-ligand complex PfGST:BSP (red) and PvGST:BSP (blue) throughout the 500 ns simulation time plotted in picoseconds (ps).
After that, the trajectory frames of the four systems’ Cα RMSD were calculated. This measurement gives the average distance of the atom’s Cα for a specific frame per reference frame. The four systems’ Cα RMSD plotted against the 500 ns simulation time is seen in . The four system’s global average trajectories are 2.25 ± 0.75 (apo-PfGST), 2.65 ± 0.35 (apo-PvGST), 2.23 ± 0.75 (PfGST:BSP), and 2.77 ± 0.25 (PvGST:BSP). These trajectories reveal not more than 3 Å fluctuations in the simulated systems, an indication of well-equilibrated systems and that the data generated are reliably usable for downstream analysis. Relatedly, the plot also reveals the ligand’s RMSD with respect to the two proteins (PfGST and PvGST), which expressed the ligand’s degree of motion within the dimer interphase. It also helps to extrapolate the ligand’s stability with respect to the proteins and their binding sites. Although BSP was stably bound to PfGST and PvGST throughout the 500 ns simulation, it showed a higher degree of motion in PfGST than in PvGST.
Figure 10. Analysis of the simulation trajectory showing (A) the RMSD of the Cα atoms and (B) the RMSF of the side chains as a function of the 500 ns simulation time for apo-PfGST (black), apo-PvGST (green), PfGST:BSP complex (red), PfGST:BSP complex (blue).
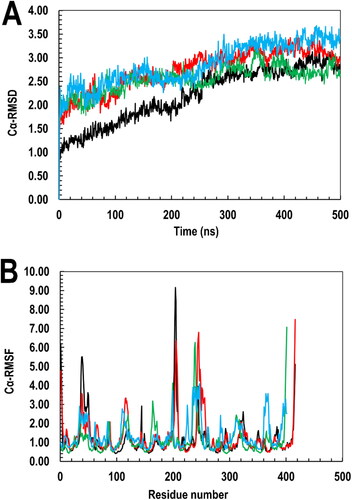
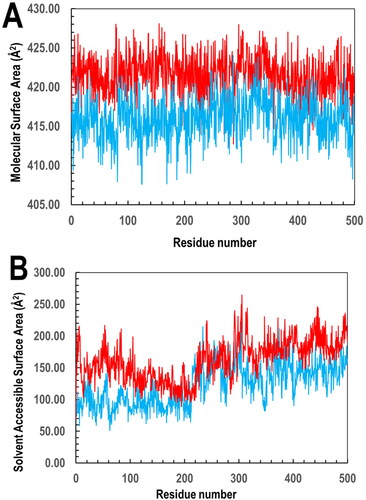
Similarly, plots of the four systems’ side chain root-mean-square-fluctuation (RMSF) values against the residue numbers based on the 500 ns simulation trajectory data was made. In , the RMSF plot shows residues 1–211 and 212–424 correspond to both protein subunits A and B, respectively. Also, the side chain fluctuations’ general profiles across the four systems and their subunits were seen to be comparable with little or no deviation in the protein–ligand complexes vis-à-vis their apo structures all through the simulation period with the ligand remaining bound at both PfGST and PvGST’s dimer interphase. Furthermore, the degree of compactness of each protein–ligand complexes (PfGST:BSP) and PvGST:BSP) were accessed using the global solvent accessible surface area (SASA) and molecular surface area (MolSA). While MolSA as a technique quantitatively reveals BSP’s interaction at both protein’s molecular environment, the technique however shows that PfGST:BSP’s system (with higher MolSA) is more stable compared to that of PvGST:BSP. This is because, in the 500 ns simulations trajectory, PfGST:BSP shows a greater MolSA which is noted at an average of 422.50 Å2 than PvGST:BSP which is observed at an average of 416.50 Å2 as can be seen in . Although the stable interaction during the 500 ns simulations time reveals that BSP established interaction in both PfGST and PvGST, but the higher MolSA as seen in PfGST’s system shows that BSP cause more functional inactivity in PfGST compared to PvGST. This result is in tandem with the protein’s enzymatic specific activities carried out during the empirical study. In quantitatively describing the binding dynamics of BSP to PfGST and PvGST’s hydrophobic core, the global SASA trajectories of the protein complexes as shown in in shows a similar binding dynamics of BSP in PfGST and PvGST. Similarly, while PfGST:BSP’s SASA is greater than that of PvGST:BSP with PfGST:BSP’s average SASA at 150 Å2 while that of PvGST:BSP at 125 Å2, the binding dynamics of the two systems however shows similarities. The increase in PfGST:BSP’s average SASA implied that PfGST assumed a more exposed conformation upon binding and during the 500 ns simulations than PvGST, a confirmation that PfGST is more dynamic in comparison to PvGST. These findings are in tandem with the kinetic and stability studies profile earlier reported just as the MolSA results correlates with the SASA of the two protein–ligand complexes.
Figure 11. The interaction of BSP with PfGST and PvGST in respect of their (A) MolSA quantitatively revealing BSP’s interaction at both protein’s molecular environment, with PfGST:BSP’s trajectory (red) showing a higher MolSA than PvGST:BSP (blue) and (B) global SASA showing similar binding dynamics of BSP in the two proteins. The PfGST:BSP’s SASA (red) is however higher than that of PvGST:BSP (blue).
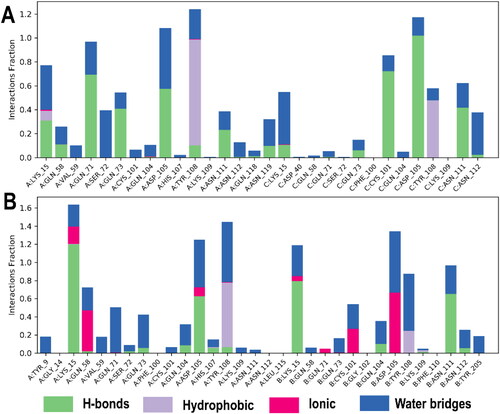
Furthermore, from which summarizes the 500 ns simulations monitored protein–ligand interactions, it reveals that a combination of interactions namely hydrophobic, hydrogen, ionic, and salt bridges held and stabilized the ligand (BSP) within the proteins’ dimer interphase.
Figure 12. Amino acid side chains interactions and types of interactions stacked bar charts between (A) PfGST:BSP and (B) PvGST:BSP, throughout the 500 ns simulation. The interaction diagram showed H-bonds are categorized into backbone acceptor; backbone donor; side-chain acceptor; side-chain donor. Hydrophobic interactions are categorized into π–cation; π–π*; and other, non-specific interactions. The stacked bar charts are normalized throughout the 500 ns trajectory. The images were obtained with the use of the Ligand Interaction Algorithm implemented in Maestro v13.0.
There is the understanding that the binding energy of molecule’s interaction (vis-à-vis the ligand-protein interaction) that takes place in a biological system gives the descriptive estimate of the thermodynamics/energetics in the biological system. In this regard, the MM/GBSA-free energy binding of BSP and the receptors (PfGST and PvGST) were then determined using the MM/GBSA algorithm implementable in Schrodinger Maestro v13.0. The MM/GBSA calculated energy components of the interactions are succinctly tabularized (). The calculated ΔGbind of BSP towards PfGST and PvGST are similar, being −13.59 and −16.39 kcal/mol. This negative ΔGbind is indicative of the possibility of spontaneity in the binding reaction in both PfGST and PvGST. With that in mind, this result also shows that the interaction of BSP with PfGST and PvGST is thermodynamically favorable. The results also indicated that, although the gas phase energy acted opposite to the solvation free energy, it, however, contributed chiefly to the overall ΔGbind. In addition, the result also presents that the binding of BSP with PfGST and PvGST is primarily brought about by van der Waals interactions.
Table 5. MM/GBSA calculated binding energy of BSP interaction with PfGST and PvGST.
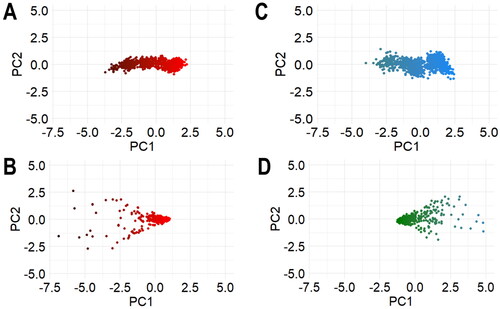
Furthermore, in deconvoluting the Cα atoms’ dynamics as a function of ligand binding, PCA was used to expand the conformational changes of the RMSD and RMSF metrics. This is as all singular mode of PfGST and PvGST in relation to their complexes are related to an eigenvalue. This eigenvalue corresponds to their fluctuations’ degree along a mode containing different Cα atoms contributions. With PC1 and PC2, sufficient atomistic description of the conformation’s fluctuation was revealed. These two PCs (PC1 and PC2) were used to analyze the transitions in conformations of the RMSD and RMSF simulated systems by deconvoluting their trajectories onto a two-dimensional subspace (). The unnoticeable color changes from black to red and green to blue scale () is an indication of spontaneous conformational transition of PfGST and PvGST respectively, upon the binding of BSP. Also, the scattered dots of PCA of the RMSF of the apo PfGST and PvGST with BSP’s system () shows it is a liganded system.
Figure 13. The subspace trajectories projections of the first two principal components (PC1 and PC2) in respect of their (A) Cα RMSD of PfGST and PfGST:BSP and (B) Cα PvGST and PvGST:BSP, (C) Cα RMSF of PfGST and PfGST:BSP and (D) Cα PvGST and PvGST:BSP.
4. Conclusion
The combinatory empirical and molecular dynamics simulation studies employed in this article insightfully describe the ligandin properties of PfGST and PvGST toward BSP. The various empirical characterizations and computational modelling studies showed that BSP (as a ligand) binds tightly to PfGST and PvGST and showed good inhibitory abilities to their functionalities in a similar way. Specifically, the potency of BSP to alter the conformational stability and inhibit the enzymatic activities of these enzymes was fully described empirically and validated through the computational modelling approaches employed. The MDS correctly simulated PfGST and PvGST for drug-receptor/ligand interactions towards BSP, and consequently validating the druggability of PfGST and PvGST as a critical drug target. The different empirical studies and computational modelling approaches strongly positioned BSP as a druggable candidate to be further studied and developed as a potent antimalarial.
Disclosure statement
The authors declare no potential conflict of interest.
Additional information
Funding
References
- Ahmed, A., Khogali, R., Elnour, M.-A B., Nakao, R., & Salim, B. (2021). Emergence of the invasive malaria vector Anopheles stephensi in Khartoum State, Central Sudan. Parasites & Vectors, 14(1), 511. https://doi.org/10.1186/s13071-021-05026-4
- Akumadu, B. O., Pandian, R., Olfsen, J., Worth, R., Thulo, M., Mentor, T., Fanucchi, S., Sayed, Y., Dirr, H. W., & Achilonu, I. (2020). Molecular basis of inhibition of Schistosoma japonicum glutathione transferase by ellagic acid: Insights into biophysical and structural studies. Molecular and Biochemical Parasitology, 240(August), 111319. https://doi.org/10.1016/j.molbiopara.2020.111319
- Al-Qattan, M. N., Mordi, M. N., & Mansor, S. M. (2016). Assembly of ligands interaction models for glutathione-S-transferases from Plasmodium falciparum, human and mouse using enzyme kinetics and molecular docking. Computational Biology and Chemistry, 64, 237–249. https://doi.org/10.1016/j.compbiolchem.2016.07.007
- Banerjee, P., Eckert, A. O., Schrey, A. K., & Preissner, R. (2018). ProTox-II: A webserver for the prediction of toxicity of chemicals. Nucleic Acids Research, 46(W1), W257–W263. https://doi.org/10.1093/nar/gky318
- Bhagat, S., Gahlawat, A., & Bharatam, P. V. (2019). Structure-based drug design of Pf DHODH inhibitors as antimalarial agents. Structural Bioinformatics: Applications in Preclinical Drug Discovery Process, 27, 177–220. https://doi.org/10.1007/978-3-030-05282-9
- Bhunia, S. S., Saxena, M., & Saxena, A. K. (2021). Ligand-and structure-based virtual screening in drug discovery. In Biophysical and Computational Tools in Drug Discovery (pp. 281–339). Springer. https://doi.org/10.1007/7355_2021_130
- Calic, P. P. S., Mansouri, M., Scammells, P. J., & McGowan, S. (2020). Driving antimalarial design through understanding of target mechanism. Biochemical Society Transactions, 48(5), 2067–2078. https://doi.org/10.1042/BST20200224
- Chandel, T. I., Zaman, M., Khan, M. V., Ali, M., Rabbani, G., Ishtikhar, M., & Khan, R. H. (2018). A mechanistic insight into protein-ligand interaction, folding, misfolding, aggregation and inhibition of protein aggregates: An overview. International Journal of Biological Macromolecules, 106, 1115–1129. https://doi.org/10.1016/j.ijbiomac.2017.07.185
- Cheng, F., Li, W., Zhou, Y., Shen, J., Wu, Z., Liu, G., Lee, P. W., & Tang, Y. (2012). admetSAR: A comprehensive source and free tool for assessment of chemical ADMET properties. ACS Publications. https://doi.org/10.1021/ci300367a
- Chigorimbo-Murefu, N. T. L., Njoroge, M., Nzila, A., Louw, S., Masimirembwa, C., & Chibale, K. (2012). Biotransformation and biocatalysis: Roles and applications in the discovery of antimalarials. Future Medicinal Chemistry, 4(18), 2325–2336. https://doi.org/10.4155/fmc.12.173
- Choudhuri, S., Yendluri, M., Poddar, S., Li, A., Mallick, K., Mallik, S., & Ghosh, B. (2023). Recent advancements in computational drug design algorithms through machine learning and optimization. Kinases and Phosphatases, 1(2), 117–140. https://doi.org/10.3390/kinasesphosphatases1020008
- Colón-Lorenzo, E. E., Colón-López, D. D., Vega-Rodríguez, J., Dupin, A., Fidock, D. A., Baerga-Ortiz, A., Ortiz, J. G., Bosch, J., & Serrano, A. E. (2020). Structure-based screening of Plasmodium berghei glutathione S-transferase identifies CB-27 as a novel antiplasmodial compound. Frontiers in Pharmacology, 11(March), 246. https://doi.org/10.3389/fphar.2020.00246
- Cui, F., Sequeira, S. B., Huang, Z., Shang, G., Cui, Q., & Yang, X. (2020). Bromosulfophthalein suppresses inflammatory effects in lipopolysaccharide-stimulated RAW264. 7 macrophages. Immunopharmacology and Immunotoxicology, 42(5), 456–463. https://doi.org/10.1080/08923973.2020.1808985
- Daina, A., Michielin, O., & Zoete, V. (2017). SwissADME: A free web tool to evaluate pharmacokinetics, drug-likeness and medicinal chemistry friendliness of small molecules. Scientific Reports, 7(1), 42717. https://doi.org/10.1038/srep42717
- Dasari, S., Ganjayi, M. S., Yellanurkonda, P., Basha, S., & Meriga, B. (2018). Role of glutathione S-transferases in detoxification of a polycyclic aromatic hydrocarbon, methylcholanthrene. Chemico-Biological Interactions, 294(January), 81–90. https://doi.org/10.1016/j.cbi.2018.08.023
- Elseginy, S. A. (2023). Exploring binding mechanisms of omicron spike protein with dolutegravir and etravirine by molecular dynamics simulation, principal component analysis, and free binding energy calculations. Journal of Biomolecular Structure & Dynamics, 12(December), 1–14. https://doi.org/10.1080/07391102.2023.2293278
- Ernst, M., Sittel, F., & Stock, G. (2015). Contact-and distance-based principal component analysis of protein dynamics. The Journal of Chemical Physics, 143(24), 244114. https://doi.org/10.1063/1.4938249
- Fritz-Wolf, K., Becker, A., Rahlfs, S., Harwaldt, P., Schirmer, R. H., Kabsch, W., & Becker, K. (2003). X-ray structure of glutathione S-transferase from the malarial parasite Plasmodium falciparum. Proceedings of the National Academy of Sciences of the United States of America, 100(24), 13821–13826. https://doi.org/10.1073/pnas.2333763100
- Fu, Y., Zhao, J., & Chen, Z. (2018). Insights into the molecular mechanisms of protein-ligand interactions by molecular docking and molecular dynamics simulation: A case of oligopeptide binding protein. Computational and Mathematical Methods in Medicine, 2018, 3502514–3502512. https://doi.org/10.1155/2018/3502514
- Gilson, M. K., Given, J. A., Bush, B. L., & McCammon, J. A. (1997). The statistical-thermodynamic basis for computation of binding affinities: A critical review. Biophysical Journal, 72(3), 1047–1069. https://doi.org/10.1016/S0006-3495(97)78756-3
- Habig, W. H., & Jakoby, W. B. (1981). Assays for differentiation of glutathione S-Transferases. In Methods in enzymology (Vol. 77, pp. 398–405). Elsevier. https://doi.org/10.1016/S0076-6879(81)77053-8
- Kollman, P. A., Massova, I., Reyes, C., Kuhn, B., Huo, S., Chong, L., Lee, M., Lee, T., Duan, Y., Wang, W., Donini, O., Cieplak, P., Srinivasan, J., Case, D. A., & Cheatham, T. E. (2000). Calculating structures and free energies of complex molecules: Combining molecular mechanics and continuum models. Accounts of Chemical Research, 33(12), 889–897. https://doi.org/10.1021/ar000033j
- Kolobe, D., Sayed, Y., & Dirr, H. W. (2004). Characterization of bromosulphophthalein binding to human glutathione S-transferase A1-1: Thermodynamics and inhibition kinetics. The Biochemical Journal, 382(Pt 2), 703–709. https://doi.org/10.1042/BJ20040056
- Leelananda, S. P., & Lindert, S. (2016). Computational methods in drug discovery. Beilstein Journal of Organic Chemistry, 12(1), 2694–2718. https://doi.org/10.3762/bjoc.12.267
- Lipinski, C. A., Lombardo, F., Dominy, B. W., & Feeney, P. J. (1997). Experimental and computational approaches to estimate solubility and permeability in drug discovery and development settings. Advanced Drug Delivery Reviews, 46(1-3), 3–26. https://doi.org/10.1016/S0169-409X(96)00423-1
- Lumjuan, N., McCarroll, L., Prapanthadara, L., Hemingway, J., & Ranson, H. (2005). Elevated activity of an Epsilon class glutathione transferase confers DDT resistance in the dengue vector, Aedes aegypti. Insect Biochemistry and Molecular Biology, 35(8), 861–871. https://doi.org/10.1016/j.ibmb.2005.03.008
- Makumbe, H. H., Pandian, R., Valli, A., Sayed, Y., & Achilonu, I. (2024). Biophysical characterization, crystallization, and solution of the first crystal structure of the 28 kDa-Schistosoma bovis glutathione transferase. Journal of Molecular Structure, 1298, 136979. https://doi.org/10.1016/j.molstruc.2023.136979
- Mangoyi, R., Hayeshi, R., Ngadjui, B., Ngandeu, F., Bezabih, M., Abegaz, B., Razafimahefa, S., Rasoanaivo, P., & Mukanganyama, S. (2010). Glutathione transferase from Plasmodium falciparum - Interaction with malagashanine and selected plant natural products. Journal of Enzyme Inhibition and Medicinal Chemistry, 25(6), 854–862. https://doi.org/10.3109/14756366.2010.486793
- Massova, I., & Kollman, P. A. (2000). Combined molecular mechanical and continuum solvent approach (MM-PBSA/GBSA) to predict ligand binding. Perspectives in Drug Discovery and Design, 18(1), 113–135. https://doi.org/10.1023/A:1008763014207
- McQueen, N., Gomes, K. V., McCormick, C., Blumanthal, K., Pisciotta, M., & Wilcox, J. (2021). A review of direct air capture (DAC): Scaling up commercial technologies and innovating for the future. Progress in Energy, 3(3), 032001. https://doi.org/10.1088/2516-1083/abf1ce
- Mohring, F., Hart, M. N., Rawlinson, T. A., Henrici, R., Charleston, J. A., Clark, C. J., Baker, D. A., Draper, S. J., & Moon, R. W. (2019). Rapid and iterative genome editing in the zoonotic malaria parasite Plasmodium 2 knowlesi: New tools for P. vivax research 3. BioRxiv. https://doi.org/10.1101/590976
- Mohring, F., Rahbari, M., Zechmann, B., Rahlfs, S., Przyborski, J. M., Meyer, A. J., & Becker, K. (2017). Determination of glutathione redox potential and pH value in subcellular compartments of malaria parasites. Free Radical Biology & Medicine, 104, 104–117. https://doi.org/10.1016/j.freeradbiomed.2017.01.001
- Naing, C., Whittaker, M. A., Htet, N. H., Aye, S. N., & Mak, J. W. (2019). Efficacy of antimalarial drugs for treatment of uncomplicated falciparum malaria in Asian region: A network meta-analysis. PloS One, 14(12), e0225882. https://doi.org/10.1371/journal.pone.0225882
- Padi, N., Akumadu, B. O., Faerch, O., Aloke, C., Meyer, V., & Achilonu, I. (2021). Engineering a pseudo-26-kda schistosoma glutathione transferase from bovis/haematobium for structure, kinetics, and ligandin studies. Biomolecules, 11(12), 1844. https://doi.org/10.3390/biom11121844
- Pawłowska, M., Mila-Kierzenkowska, C., Szczegielniak, J., & Woźniak, A. (2023). Oxidative stress in parasitic diseases—Reactive oxygen species as mediators of interactions between the host and the parasites. Antioxidants, 13(1), 38. https://doi.org/10.3390/antiox13010038
- Pérez-Peña, H., Abel, A.-C., Shevelev, M., Prota, A. E., Pieraccini, S., & Horvath, D. (2023). Computational approaches to the rational design of tubulin-targeting agents. Biomolecules, 13(2), 285. https://doi.org/10.3390/biom13020285
- Plaa, G. L. (2010). Evaluation of hepatotoxicity: Physiological and biochemical measures of hepatic function in animals. In Comprehensive Toxicolog (pp. 129–140). Elsevier. https://doi.org/10.1016/B978-0-08-046884-6.01006-X
- Pooe, K., Thulo, M., Makumbe, H., Akumadu, B., Otun, O., Aloke, C., & Achilonu, I. (2022). Biophysical description of Bromosulfophthalein interaction with the 28-kDa glutathione transferase from Schistosoma japonicum. Molecular and Biochemical Parasitology, 252, 111524. https://doi.org/10.1016/j.molbiopara.2022.111524
- Pooe, K., Worth, R., Iwuchukwu, E. A., Dirr, H. W., & Achilonu, I. (2021). An empirical and theoretical description of Schistosoma japonicum glutathione transferase inhibition by bromosulfophthalein and indanyloxyacetic acid 94. Journal of Molecular Structure, 1223, 128892. https://doi.org/10.1016/j.molstruc.2020.128892
- Quesada-Soriano, I., Barón, C., García-Maroto, F., Aguilera, A. M., & García-Fuentes, L. (2013). Calorimetric studies of ligands binding to glutathione S-transferase from the malarial parasite Plasmodium falciparum. Biochemistry, 52(11), 1980–1989. https://doi.org/10.1021/bi400007g
- Quesada-Soriano, I., Barón, C., Téllez-Sanz, R., García-Maroto, F., & García-Fuentes, L. (2014). Asn112 in Plasmodium falciparum glutathione S-transferase is essential for induced reversible tetramerization by phosphate or pyrophosphate. Biochimica et Biophysica Acta, 1844(9), 1427–1436. https://doi.org/10.1016/j.bbapap.2014.04.017
- Sabe, V. T., Ntombela, T., Jhamba, L. A., Maguire, G. E. M., Govender, T., Naicker, T., & Kruger, H. G. (2021). Current trends in computer aided drug design and a highlight of drugs discovered via computational techniques: A review. European Journal of Medicinal Chemistry, 224, 113705. https://doi.org/10.1016/j.ejmech.2021.113705
- Sadybekov, A. V., & Katritch, V. (2023). Computational approaches streamlining drug discovery. Nature, 616(7958), 673–685. https://doi.org/10.1038/s41586-023-05905-z
- Sayed, Y., Wallace, L. A., & Dirr, H. W. (2000). The hydrophobic lock-and-key intersubunit motif of glutathione transferase A1-1: Implications for catalysis, ligandin function and stability. FEBS Letters, 465(2-3), 169–172. https://doi.org/10.1016/S0014-5793(99)01747-0
- Shibeshi, M. A., Kifle, Z. D., & Atnafie, S. A. (2020). Antimalarial drug resistance and novel targets for antimalarial drug discovery. Infection and Drug Resistance, 13, 4047–4060. https://doi.org/10.2147/IDR.S279433
- Soto, A., Foy, B. D., & Frazier, J. M. (2002). Effect of cadmium on bromosulfophthalein kinetics in the isolated perfused rat liver system. Toxicological Sciences: An Official Journal of the Society of Toxicology, 69(2), 460–469. https://doi.org/10.1093/toxsci/69.2.460
- Sujitha, V., Murugan, K., Dinesh, D., Pandiyan, A., Aruliah, R., Hwang, J.-S., Kalimuthu, K., Panneerselvam, C., Higuchi, A., Aziz, A. T., Kumar, S., Alarfaj, A. A., Vaseeharan, B., Canale, A., & Benelli, G. (2017). Green-synthesized CdS nano-pesticides: Toxicity on young instars of malaria vectors and impact on enzymatic activities of the non-target mud crab Scylla serrata. Aquatic Toxicology (Amsterdam, Netherlands), 188, 100–108. https://doi.org/10.1016/j.aquatox.2017.04.015
- Szabo, M., Veres, Z., Baranyai, Z., Jakab, F., & Jemnitz, K. (2013). Comparison of human hepatoma HepaRG cells with human and rat hepatocytes in uptake transport assays in order to predict a risk of drug induced hepatotoxicity. PloS One, 8(3), e59432. https://doi.org/10.1371/journal.pone.0059432
- Tsui, V., & Case, D. A. (2000). Theory and applications of the generalized Born solvation model in macromolecular simulations. Biopolymers, 56(4), 275–291. https://doi.org/10.1002/1097-0282(2000)56:4<275::AID-BIP10024>3.0.CO;2-E
- Valli, A., & Achilonu, I. (2022). Comparative structural analysis of the human and Schistosoma glutathione transferase dimer interface using selective binding of bromosulfophthalein. Proteins, 90(8), 1561–1569. https://doi.org/10.1002/prot.26338
- Valli, A., & Achilonu, I. (2023). Molecular dynamics-derived pharmacophores of Schistosoma glutathione transferase in complex with bromosulfophthalein: Screening and analysis of potential inhibitors. Journal of Molecular Graphics & Modelling, 122, 108457. https://doi.org/10.1016/j.jmgm.2023.108457
- van Dorp, L., Gelabert, P., Rieux, A., de Manuel, M., de-Dios, T., Gopalakrishnan, S., Carøe, C., Sandoval-Velasco, M., Fregel, R., Olalde, I., Escosa, R., Aranda, C., Huijben, S., Mueller, I., Marquès-Bonet, T., Balloux, F., Gilbert, M. T. P., & Lalueza-Fox, C. (2020). Plasmodium vivax malaria viewed through the lens of an eradicated European strain. Molecular Biology and Evolution, 37(3), 773–785. https://doi.org/10.1093/molbev/msz264
- Wang, E., Sun, H., Wang, J., Wang, Z., Liu, H., Zhang, J. Z. H., & Hou, T. (2019). End-point binding free energy calculation with MM/PBSA and MM/GBSA: Strategies and applications in drug design. Chemical Reviews, 119(16), 9478–9508. https://doi.org/10.1021/acs.chemrev.9b00055
- Zhan, Y., Liu, H., Wu, Y., Wei, P., Chen, Z., & Williamson, J. S. (2015). Biotransformation of artemisinin by Aspergillus niger. Applied Microbiology and Biotechnology, 99(8), 3443–3446. https://doi.org/10.1007/s00253-015-6464-x