
Abstract
Purpose: The present investigation focuses on Skin Cutaneous Melanoma (SKCM), a melanocytic carcinoma characterized by marked aggression, significant heterogeneity, and a complex etiological background, factors which collectively contribute to the challenge in prognostic determinations. We defined a novel classifier system specifically tailored for SKCM based on multiomics. Methods: We collected 423 SKCM samples with multi omics datasets to perform a consensus cluster analysis using 10 machine learning algorithms and verified in 2 independent cohorts. Clinical features, biological characteristics, immune infiltration pattern, therapeutic response and mutation landscape were compared between subtypes. Results: Based on consensus clustering algorithms, we identified two Multi-Omics-Based-Cancer-Subtypes (MOCS) in SKCM in TCGA project and validated in GSE19234 and GSE65904 cohorts. MOCS2 emerged as a subtype with poor prognosis, characterized by a complex immune microenvironment, dysfunctional anti-tumor immune state, high cancer stemness index, and genomic instability. MOCS2 exhibited resistance to chemotherapy agents like erlotinib and sunitinib while sensitive to rapamycin, NSC87877, MG132, and FH355. Additionally, ELSPBP1 was identified as the target involving in glycolysis and M2 macrophage infiltration in SKCM. Conclusions: MOCS classification could stably predict prognosis of SKCM; patients with a high cancer stemness index combined with genomic instability may be predisposed to an immune exhaustion state.
Communicated by Ramaswamy H. Sarma
1. Introduction
Skin cutaneous melanoma, or SKCM, is one of the most aggressive malignancies, characterized by an insidious onset, easy metastasis, and poor response to treatment. SKCM accounts for 80% of all skin cancer deaths (Siegel et al., Citation2022). Despite a 5-year relative survival rate exceeding 95% following surgical excision in early-stage SKCM, the prognosis for late-stage SKCM remains unfavorable, with a mere 30% 5-year relative survival rate for stage IV SKCM (Long et al., Citation2023; Siegel et al., Citation2024). Conventional treatments, including chemotherapy, offer limited survival advantages for advanced cases (Villani et al., Citation2022). On the other hand, targeted therapy, specifically targeting BRAF and/or MEK, has substantially enhanced the prognosis of patients with advanced SKCM (Meraz-Torres et al., Citation2024). Nevertheless, the targeted therapy of SKCM continues to face significant obstacles in the form of low response rates and high drug resistance. Immunotherapy, specifically immune checkpoint inhibitors (ICIs), has emerged as a highly successful treatment for SKCM (Noviello et al., Citation2023). The notable effectiveness of ICIs in melanoma treatment can be attributed to the elevated tumor mutation burden (TMB) observed in these cases, which likely leads to the generation of numerous neoantigens that stimulate antitumor immune responses (Carlino et al., Citation2021). However, a significant proportion of advanced SKCM patients do not exhibit favorable responses to immunotherapy (Di Raimondo et al., Citation2023). To optimize the effectiveness of immunotherapy, multiple predictive biomarkers, including TMB, PD-L1 expression, and mismatch-repair deficiency, have been suggested (He & Wang, Citation2023). Nevertheless, despite their widespread application in clinical settings, these biomarkers possess limited predictive capacity. Given these concerns, it is imperative to prioritize the implementation of efficient and resilient molecular typing techniques, as well as the exploration of novel therapeutic targets, in order to effectively manage patients diagnosed with SKCM.
The growing utilization of high-throughput sequencing technology in cancer patients has resulted in the availability of numerous prognostic and therapy response-related clinical and molecular data (Roth, Citation2019). These molecular data primarily encompass the somatic mutation and transcriptome profiles of cancer patients (Addala et al., Citation2024). Utilizing this data, several studies have endeavored to identify specific markers whose mutations or expressions exhibit significant correlations with therapy response or clinical outcome (Jiang et al., Citation2022; Meng et al., Citation2023). For instance, empirical evidence has demonstrated a positive correlation between the activities of PPAR, MAPK, VEGF, calcium, and the glycolysis/gluconeogenesis pathway with immunotherapy response in melanoma (He & Wang, Citation2023). Newell et al. identified structural rearrangements and PSMB8 promoter methylation as occurring in SKCM patients who exhibited resistance to ICI treatment, while a potential resistance mechanism in the sensitive group was found to be a JAK3 mutation (Newell et al., Citation2022). Additionally, a separate investigation employed 96 machine learning algorithms to develop a robust prognostic signature based on transcriptome data, enabling the prediction of prognosis and therapy sensitivity in SKCM (Liu et al., Citation2023). However, it should be noted that the development of tumors is not solely dependent on the activation of these mutations or the deregulated expression level of these genes. The occurrence and progression of SKCM involve a complex and dynamic process that is influenced by synergistic interactions among genes, mutations, and other omics factors (Robert & Gautheret, Citation2022). By conducting multi-omics analysis, it is possible to uncover these synergistic interactions and identify a subset of genes that are closely associated with relevant biological functions, as evidenced by previous studies (Radke et al., Citation2022). Consequently, it is crucial to perform comprehensive multi-omics integration analysis to examine epigenetics, mutations, and transcriptomes in order to gain a deeper understanding of SKCM, considering previous works predominantly concentrated on individual omics levels. Furthermore, the identification of the molecular subtypes of SKCM will enhance the application of precision medicine and enhance patient prognosis.
In this study, we combined multi omics datasets, including mRNA, long non-coding RNA (lncRNA), and microRNA (miRNA) expression profiles, epigenomic DNA methylation and genomic mutations data to develop an integrated consensus subtype of SKCM using 10 multiomics integration strategies. 423 SKCM samples form TCGA project were subjected to two distinct phenotypes, termed as Multi-Omics-Based-Cancer-Subtypes (MOCS) 1 and MOCS2. The latter phenotype, MOCS2, exhibited an unfavorable prognosis and an immune exclusion phenotype, possibly attributed to heightened ribosomal activity and estrogen signaling. This remodeling outcome was further confirmed in two independent SKCM cohorts, demonstrating a high level of consistency. Intriguingly, MOCS2 displayed a significantly unstable genomic architecture characterized by both genomic loss and gain. Furthermore, we have implemented a drug sensitivity database and have identified several potential agents, such as X4.5-dianilinophthalimide, exisulind, and butein, for the high-risk subtype MOCS2 in SKCM. In essence, our study signifies the initial endeavor to remodel SKCM using a multi-algorithmic approach, potentially offering novel perspectives on the coordination of SKCM.
2. Method and materials
2.1. Data downloading, collection and processing
The tumor samples from the TCGA-SKCM cohorts (n = 423) were obtained by utilizing the R package TCGAbiolinks, which provided transcriptome data (including mRNA, lncRNA, and miRNA), DNA methylation, and mutation profiles. Additionally, two external SKCM cohorts, GSE19234 (n = 44) and GSE65904 (n = 210), were acquired using the R function getGEO from the R package GEOquery (Bogunovic et al., Citation2009; Cirenajwis et al., Citation2015). GSE19234 consisted of 44 metastatic melanoma samples along with corresponding overall survival (OS) information, while GSE65904 comprised 214 melanoma samples with metastatic events and clinical outcome data.
The multi-omics data procured from TCGA-SKCM served as the training cohort for our consensus cluster. We converted SKCM transcriptomes into TPM and mutated the profile into a binary matrix for subsequent analyses. The Ensembl IDs associated with these transcriptomes were transformed into gene symbols via GENCODE27 mapping. LncRNA data were cataloged under noncoding, 3prime overlapping ncRNA, antisense RNA, lincRNA, sense intronic, sense overlapping, macro lncRNA, and bidirectional promoter lncRNA subtypes, recognized following Vega’s guidelines. For DNA methylation data, we focused exclusively on probes located in the promoter region CpG island; when multiple probes mapped to the same promoter, the median β value was employed. Pertaining to gene mutation, only samples bearing nonsynonymous variations in the gene mutation matrix were carried forward for future analysis, including frameshift deletions/insertions, in‐frame deletions/insertions, missense/nonsense/nonstop mutations, and splice site or translation start site mutations. Concerning CNAs, we consolidated genomic segments as outlined in existing literature. We acquired the expression matrix and clinical information for two external datasets from the GEO website. Thereafter, the fetched data underwent processing with the R package limma for background correction, log2 transformation, and quantile normalization. The boxplot function was used to visualize the uniformity of distribution in sample expression abundance values. Similar approaches have been taken in previous investigations on colorectal and bladder cancers (Liu et al., Citation2022; Lu et al., Citation2021a).
2.2. Classification of SKCM based on 10 cancer-related cluster algorithms and validation in external cohorts
Previous studies on SKCM clustering mainly focused on signatures associated with specific biological processes, often neglecting the diverse heterogeneity across multiple omics layers. In contrast, our current study initially mined five-dimensional omics data (mRNA, lncRNA, miRNA, DNA methylation, and mutation) through the sample barcode (n = 423). Subsequently, we employed the “getElites” function within the multi-omics integration and visualization in Cancer Subtyping (MOVICS) package to identify features with prognostic significance. For continuous measures such as mRNA, lncRNA, miRNA, and methylation, we set the “method” parameter of the “getElites” function to “mad”, focusing on the top 2000 genes exhibiting the highest variance. Later, we adjusted the “method” parameter to “cox,” correlating it with clinical data to pinpoint prognosis-related genes holding a p-value < 0.05 in every data dimension. In the case of binary gene mutation data, we initially used the maftools package’s “oncoPrint” function to isolate the top 3000 genes exhibiting the most frequent mutations. Further screening was conducted based on mutation frequency by setting the “method” parameter to “freq” to identify the top 5% frequently mutating genes. These data from all five dimensions were then integrated for further analysis.
Our next objective was to determine the optimal number of clusters. We calculated CPI and Gap statistics using the built-in R package MOVICS, while comparing these results with previously published TCGA-SKCM molecular subtypes. To create the final classification model for TCGA-SKCM, we utilized ten advanced clustering methodologies (CIMLR, ConsensusClustering, SNF, iClusterBayes, PINSPlus, moCluster, NEMO, IntNMF, COCA, and LRA) (Lu et al., Citation2021b). After obtaining classification results from each method, we merged these diverse algorithm outcomes using the “getConsensusMOIC” function, based on the principle of consensus clustering, to enhance the robustness of the clusters. The “distance” parameter was set to Euclidean, and the linkage parameter to “average”. This integrative approach culminated in our final clustering outcome. The internal consistency of the consensus cluster analysis was visualized through a consensus heatmap and silhouette plot. Moreover, we utilized the nearest template prediction (NTP) to categorize every sample in external cohorts as one of the identified subsystems in the training cohort, TCGA-SKCM. To validate the stability of the subsystems identified in the training cohort, we used the top 100 specifically upregulated genes for each subtype as classifiers.
2.3. Differential expression and enrichment analysis
The count-based expression matrix of SKCM was applied for differential expression gene (DEG) analysis with the Deseq2 package (Love et al., Citation2014). The threshold of DEGs was filtered with adjust p-value <0.05 and abstract fold change >1.5. DEGs were further subjected to GO, KEGG, and GSEA analyses with the R package ClusterProfiler (Yu et al., Citation2012). We also applied single-sample gene set variation, or GSEA analysis to compare the biological differences with the application of the R packages including GSVA and IOBR (Hänzelmann et al., Citation2013; Zeng et al., Citation2021).
2.4. Genomic, immune status and drug sensitivity differences between subtypes
We extracted an immune-related expression matrix from TCGA-SKCM's mRNA profile. Subsequently, we illustrated the differential expression levels of five immune-associated signatures - chemokine, chemokine receptor, major histocompatibility complex class I, immune inhibitor, and stimulator - using a heatmap. Regarding the degree of immunocyte infiltration, we gauged the relative abundance of each sample utilizing seven renowned immune-related algorithms, comprising TIMER, Cibersort, xCell, EPIC, and Quantizeq. We used the TPM matrix with log2 + 1 transformation for immune deconvolution, and more specific parameters have been discussed in prior studies (Aran et al., Citation2017; Chen et al., Citation2018; Finotello et al., Citation2019; Jiang et al., Citation2021; 2022; Citation2022; Citation2023; Li et al., Citation2017; Racle & Gfeller, Citation2020). Additionally, the scores for antitumor immunity processes encompassed 7 classical steps, as thoroughly explained in Xu’s study on the TIP algorithm (Xu et al., Citation2018). To compute the tumor purity, stromal, immune and ESTIMATE score of TCGA-SKCM, we applied the R package estimate. We also compared the distribution of immune checkpoints among these subgroups and used the R package ESTIMATE to calculate the immune/stromal score for each sample. We introduced TIDE web tool to assess the sensitivity of each TCGA-SKCM patient to immune checkpoint or ICI therapy and dysfunction score.
2.5. Statistical analysis
All datasets adopted in this work were first subjected to a normality test. Student’s t test was utilized to compare datasets with normal distributions, while the Wilcoxon test was used for datasets with nonnormal distributions. Multiple testing correction was applied to compare the difference between MOCS1 and MOCS2. For the difference in ICI between MOCS1 and MOCS2, we carried out the chi-square test. The overall survival (OS), progression-free survival (PFI) and disease-specific survival (DFS) of MOCS1 and MOCS2 were introduced to compression with the application of Kaplan–Meier analysis. The Matthews Correlation Coefficient (MCC) is a statistical metric commonly employed in machine learning to assess the effectiveness of binary (two-class) classifications, particularly in the realm of medical research (Anbalagan et al., Citation2023; Elangovan et al., Citation2024; Elangovan & Nath, Citation2022; Roshni Thanka et al., Citation2023). In addition, we employed MCC to assess the clinical outcomes predicted by the classifiers, thereby facilitating an analysis of the disparities between the predicted values and the true values derived from the multi-omics classifiers (Elangovan & Nath, Citation2021). All statistical analyses and plotting in this work were carried out in R software (version 4.2.0) and the R packages ggplot2, complexheatmap, ggpubr, IOBR, EnhancedVolcano and MOVICS (Lu et al., Citation2021b; Mayakonda et al., Citation2018). All thresholds of significant differences in this work were set as p value less than 0.05.
3. Results
3.1. Two distinctive SKCM subtypes were identified across multi-omics based on consensus clustering
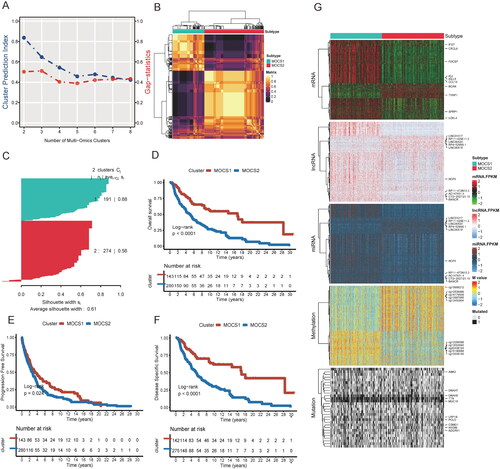
After conducting univariable Cox regression to filter prognosis-related biomarkers, the refined profiles at the transcriptome, methylation, and mutation levels were utilized as input for consensus cluster analysis. The optimal cluster number was determined by considering two key parameters: the cluster prediction index and gap statistics (). Through analysis of the correlation matrix and silhouette plot, cluster number 2 was identified as the most appropriate choice (). By employing ten sophisticated algorithms, we successfully identified distinct molecular subtypes, termed as Multi-Omics-Based-Cancer-Subtypes (MOCS) 1 and MOCS2, for SKCM patients based on multi-omics data. Significantly, our analysis revealed that MOCS2 exhibited a significantly poorer prognosis in terms of overall survival (OS), progression-free interval (PFI), and disease-specific survival (DSS) compared to MOCS1, as depicted in –F and Table S1. Furthermore, we elucidated the top 10 representative biomarkers for MOCS1 and MOCS2 across five profiles, as illustrated in , highlighting the differences at each profile level. The top varied mRNA profile included the genes CYTL1, BCAN, TYRP1, TRPM1, LOXL4, SFRP1, IGJ, IGLL5, CXCL9, and IFI27. The top varied lncRNA profile consisted of HCP5, LINC00518, RP4-529N6.1, RP11-429E11.2, LINC01317, LINC00520, NEAT1, RP11-472N13.3, CTD-2527121.15, and HPN-AS1. The top varied miRNA profile included has-mir-142, has-mir-150, has-mir-155, has-mir-100, has-mir-125b-1, has-mir125-2, has-mir-129-1, has-mir-144, has-mir-17, and has-mir-141. The top varied DNA methylation profile consisted of cg13453904, cg19378330, cg02933362, cg00269245, cg25059751, cg15998961, cg08847335, cg14947634, cg06526020, and cg16190688. The genes DNAH7, ANK3, DNAH5, TTN, MUC16, LRP1B, PCLO, CSMD1, HYDIN and ADGRV1 at the mutation profile were also identified. These unique biomarkers may serve as the foundation for the biological distinctions and subsequent impact on prognosis among the subtypes. Furthermore, subgroup analysis demonstrated that the MOCS1 subtype displayed a more favorable prognosis in both early (stages I and II) and advanced stages (stages III and IV), N1, N2, and N3; M0 and M1 (Figure S1A-C, Table S1). Moreover, both univariable and multivariable Cox analyses indicated that the MOCS classifier maintained its significance as an independent prognostic factor in comparison to other variables (Table S2).
Figure 1. Identification of the optimal cluster number of TCGA-SKCM. (A) Optimal cluster number of SKCM identified by two parameters. Bule represents the cluster prediction index, and red represents the gap statistics. (B) Cluster number was identified as 2 with the application of ten multiomics integrative clustering algorithms. (C) The similarity of each sample was quantified by the silhouette score. (D) Overall survival analysis, progression-free survival analysis (E) and disease-specific survival analysis (F) between MOCS1 and MOCS2. (G) Heatmap illustrating the difference across five omics, and the top 10 different signatures of each profile between MOCS1 and MOCS2 are annotated on the left.
3.2. MOCS2 was characterized as immune trapped or disability subtype
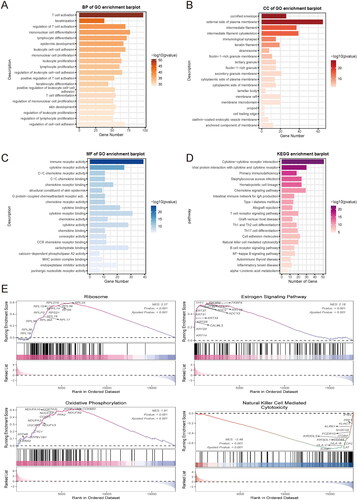
Expanding upon the aforementioned variations in prognostic factors, we conducted a differential gene expression (DEG) analysis comparing MOCS1 and MOCS2. The comprehensive DEGs, including both up- and down-regulated genes, are presented in Figure S2A. These DEGs were classified according to their participation in diverse biological processes (BP), cellular components (CC), and molecular functions (MF). More specifically, within the BP category, they were annotated in T-cell activation, keratinization, regulation of T-cell activation, mononuclear cell differentiation, and lymphocyte deafferentation. In the CC section, the annotations encompassed the cornified envelope, the external side of the plasma membrane, the intermediate filament, the intermediate filament cytoskeleton, and the immunological synapse. Regarding the MF portion, the differentially expressed genes (DEGs) were associated with immune receptor activity, cytokine receptor, C-C chemokine receptor activity, C-C chemokine binding, and chemokine receptor binding (). Additionally, upon annotating these DEGs in the Kyoto Encyclopedia of Genes and Genomes (KEGG), a predominance of immune-related pathways such as cytokine-cytokine receptor interaction and primary immunodeficiency was observed (). Gene Set Enrichment Analysis (GSEA) was conducted to examine the activation status of various pathways in MOCS2. The analysis revealed notable activation of ribosomes, the estrogen signaling pathway, and oxidative phosphorylation, while pathways associated with natural killer cell-mediated cytotoxicity were found to be suppressed (). Furthermore, a comparison of the enrichment scores for metabolism- and immune-related signatures between the subtypes demonstrated that MOCS1 exhibited an activated state in lipid metabolism, ADP ribosylation, pantothenate and CoA biosynthesis, kynurenine and tryptophan metabolism, and thromboxane metabolism. Interestingly, MOCS1 demonstrated an immune-activated state, as evidenced by higher normalized enrichment scores in anti-tumor pathways compared to MOCS2 (Figure S2B, C), which may provide insights into the distinct prognostic outcomes.
Figure 2. Biofunction differences based on DEGs between MOCS1 and MOCS2. (A) Gene ontology analysis including biological process, cellular component (B) and molecular function (C) based on DEGs extracted from MOCS1 and MOCS2. (D) Kyoto Encyclopedia of Genes and Genomes (KEGG) analysis based on GSEA from the Reactome and Msigdb (E) databases.
3.3. MOCS2 led to an immune exclusion or cold phenotype compared with MOCS1
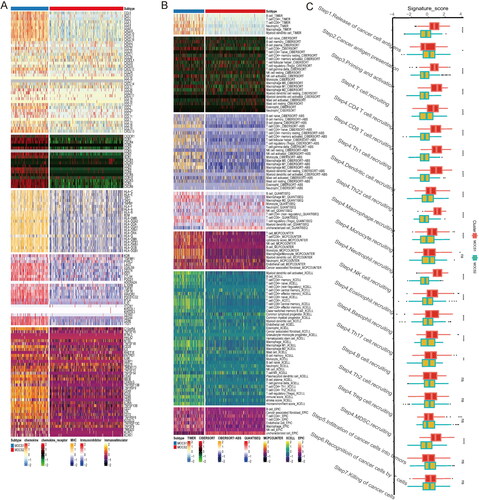
The initial results obtained from the GO, KEGG, and GSVA analyses revealed a significant disparity in immune-related pathways between MOCS1 and MOCS2. In order to gain a more comprehensive understanding, we conducted a thorough investigation specifically targeting immune components and cell infiltration. As illustrated in , MOCS1 exhibited elevated expression levels of chemokine-related family members and MHC-related signatures. Additionally, MOCS1 displayed a greater abundance of immune inhibitors and a majority of immune stimulators, as depicted in . In accordance with the subtype-specific distribution of immune-related regulators, the immune component scores, as determined by multiple algorithms, revealed consistent discrepancies. Specifically, MOCS1 displayed higher scores for the majority of immune cells compared to MOCS2, with particularly pronounced differences observed in the TIMER, Cibersort-abs, Quantizeq, Mcpcounter, Xcell, and Epic algorithms. Notably, the absence of neutrophil-Mcpcounter and NK cell-Xcell was evident in MOCS1 (). In light of the intricate nature of antitumor immunity, encompassing multiple synchronized processes, we conducted a more comprehensive investigation into the distinctions between MOCS1 and MOCS2 within this framework. As depicted in , MOCS1 exhibited higher scores across the majority of measures pertaining to anti-immune processes, except for cancer antigen presentation, where MOCS2 demonstrated greater prominence (Table S3). These cumulative findings suggest that MOCS1 exhibits an immune-hot or immune-activated phenotype, which sharply contrasts with MOCS2.
Figure 3. Differences in immune signatures, components, and tumor immunity steps between MOCS1 and MOCS2. (A) Heatmap illustrating the differences in immune marker expression and cellular components (B) between MOCS1 and MOCS2. (C) Boxplots indicate the difference in seven tumor immunity steps between subtypes.
3.4. MOCS2 was more sensitive to immune check point inhibitor
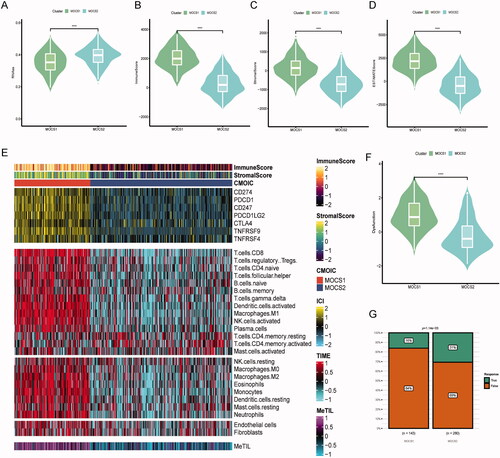
In our analysis, we conducted a comparison of various aspects of the immune score between the subtypes. It is worth noting that the tumor stemness score, RNAss, exhibited higher levels in MOCS1. Conversely, the immune, stromal, and ESTIMATE scores were predominantly elevated in MOCS1 (). Among the seven classic immune suppression biomarkers, MOCS1 demonstrated higher expression levels. Additionally, the majority of immune cell enrichment scores, as determined by the TIME algorithm, were lower in MOCS2, with the exception of CD4 T cells (). Furthermore, the immune score obtained through the analysis of DNA methylation also demonstrated a preference for MOCS1 (). Nevertheless, it is imperative to acknowledge that the immune dysfunction score was more prominent in MOCS1, while MOCS2 displayed a greater susceptibility to ICI therapy (). In line with these observations, we noted a higher prevalence of immune exhaustion signatures, encompassing T cell exhaustion, regulatory T cell activity, and ICI resistance, in MOCS1, which may help explain the lower response rate observed within this cohort (Figure S3A, B). Taken together, the RNAss, dysfunction score, and resistance signature provide evidence that patients categorized as MOCS1 may be more responsive to targeted therapy, which corresponds to the observed poorer prognosis associated with this subtype.
Figure 4. Landscape of immune score and therapy response between subtypes (A–D) Difference across RNAss immune, stromal and ESTIMATE scores, from left to right. (E) Distinctive landscape of immune check inhibitor expression, immune score, and tumor infiltration score based on methylation, from top to bottom. (F) Violin plot indicating differences in immune dysfunction scores. (G) Different response rates to immune checkpoint inhibitors based on the TIDE algorithm.
3.5. MOCS2 was characterized as a genomic instability phenotype
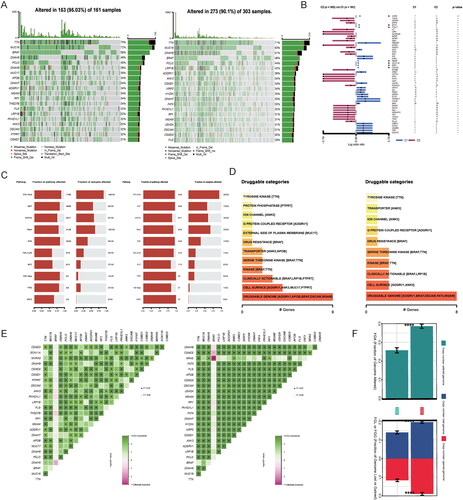
In order to gain a deeper understanding of the disparities between MOCS1 and MOCS2 in SKCM, we integrated mutation datasets from TCGA-SKCM into our investigation. Our analysis, as depicted in , demonstrated that the top 20 genes exhibited a higher frequency of mutations in MOCS1, with overall alteration rates of 95.03% in MOCS1 and 90.1% in MOCS2. Furthermore, the prognostic significance of these highly mutated genes revealed contrasting profiles between MOCS1 and MOCS2 (). Intriguingly, there were no significant variations in terms of sequence or frequency observed in the mutated pathways between the subtypes (). However, the analysis of druggable categories revealed that MOCS1 possesses a greater number of targets, such as MUC17 and PTPRT, both at the cell surface and in clinical settings (). Additionally, a higher incidence of mutation co-occurrence was observed in MOCS2 (). Consistently, copy number alterations, encompassing both loss and gain, were more prevalent in MOCS2 ().
Figure 5. Association between multiomics-based subtypes and genomic variation. (A) OncoPrint was depicted by the most significant mutated genes between MOCS1 and MOCS2. (B) Forest plot indicating the prognostic impact of mutations between MOCS1 and MOCS2. (C) Onco-pathways and drug categories (D) related differences between subtypes. (E) Interaction effect of mutated genes between MOCS1 (left) and MOCS2 (right). (F) Copy number variation difference between MOCS1 and MOCS2, including copy number gain and loss.
3.6. Potential molecular agents for MOCS1 and MOCS2
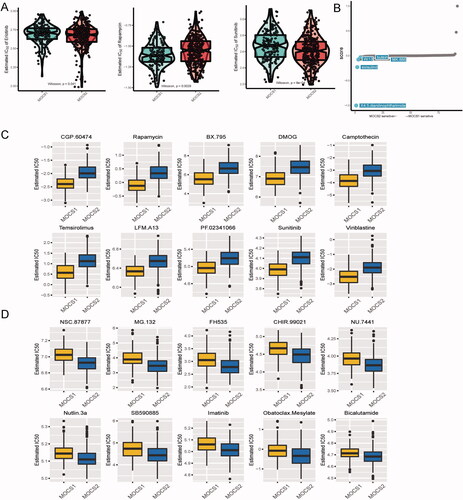
Using the GDSC database, we conducted an analysis to predict the variances in therapeutic sensitivity between MOCS1 and MOCS2. As depicted in , MOCS2 exhibited sensitivity towards erlotinib and sunitinib, while MOCS1 displayed a greater responsiveness to rapamycin. Considering the unfavorable prognosis associated with patients in the MOCS2 subtype, we consulted the CMAplus database to identify potential novel therapeutic agents specifically for this subtype. The top five most effective agents identified for MOCS2 were X4.5-dianilinopthalimide, exisulind, W.13, butein, and MK.886 (). Furthermore, our study identified several potential preclinical agents, such as CGP.60474, rapamycin, BX.795, DMOG, camptothecin, temsirolimus, LFM.A13, PF.02341066, bosutinib, and vinblastine, that could be utilized to differentiate subtypes (). Additionally, our analysis demonstrated that MOCS2 cells displayed sensitivity to a variety of agents, including NSC.87877, MG.132, FH535, CHIR.99021, NU.7441, nutlin.3a, SB590885, imatinib, oatoclax-mesylate, and bicalutamide (, Table S4).
Figure 6. Difference in therapeutic sensitivity between MOCS1 and MOCS2 among different drug-related databases. (A) Box violin plots for the estimated IC50 of erlotinib, rapamycin and sunitinib between MOCS1 and MOCS2. (B) Potential agents efficacious for inferior subtype MOCS2. (C) Different IC50 values of clinical or preclinical agents sensitive to MOCS1 and (D) MOCS2.
3.7. Satisfactory reproductivity of the remodelling system
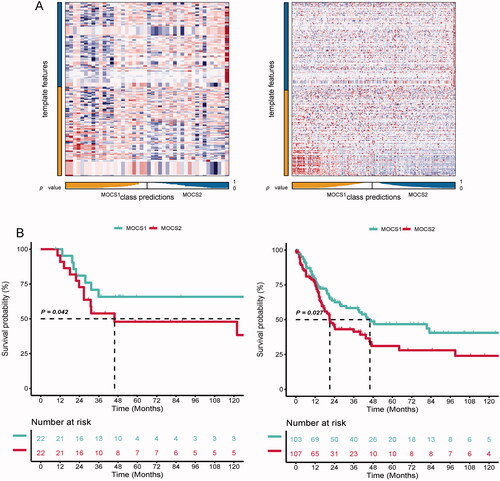
In order to evaluate the reliability and replicability of our remodeling system for SKCM, we utilized the Nearest Template Prediction (NTP) algorithm to investigate whether subtypes identified in other independent SKCM cohorts could successfully classify patients into MOCS1 and MOCS2, while also observing similar clinical outcomes. As depicted in , each biomarker associated with the subtypes exhibited consistent internal consistency in the two validation cohorts. Furthermore, the prognosis for MOCS2 in both the GSE19234 and GSE65904 cohorts mirrored the findings observed in the TCGA-SKCM dataset. The results of the study indicate that MOCS2 had a less favorable clinical outcome in comparison to MOCS1, as evidenced by . The MCC values obtained from the analysis of GSE19234 and GSE65904 datasets were 0.681 and 0.715, respectively, suggesting that the classifier system employed in this study demonstrated a satisfactory ability to predict prognosis.
Figure 7. Testing the robustness of remodelling between MOCS1 and MOCS2. (A) Heatmap of NTP in GSE19234 (left) and GSE65904 (right) with the application of subtype-specific upregulated biomarkers retrieved from MOCS1 and MOCS2 in TCGA-KIRC. (B) Kaplan–Meier survival plot of the predicted OS of GSE19234 (left) and GSE65904 (right).
3.8. ELSPBP1 promote SKCM progression through activating glycolysis and inducing M2 macrophage infiltration
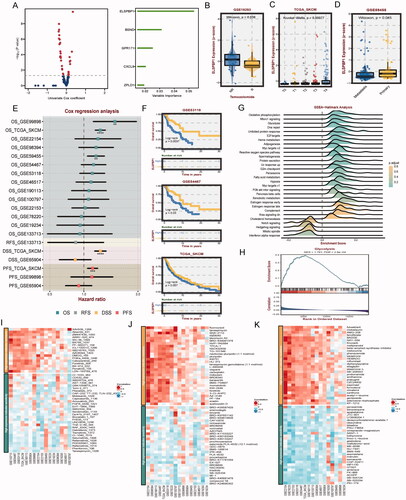
Initially, a selection of prominent genes from MOCS1 and MOCS2 was extracted, followed by the execution of univariable Cox analysis on each gene (Table S5). The resulting Cox coefficients and pvalue were provided, with particular emphasis on ELSPBP1 as a significant indicator influencing SKCM prognosis (). It was observed that ELSPBP1 exhibited high expression in the temozolomide non-response group, with its expression being most pronounced in T4 stage tumors but lower in metastatic tissues compared to primary tissues (). Subsequent analysis unveiled ELSPBP1 as a risk factor in multiple SKCM cohorts, with hazard ratios (HR) exceeding 1 (). Additionally, provides supporting evidence that patients with elevated levels of ELSPBP1 expression experienced a more unfavorable prognosis. Subsequently, we explored the association between ELSPBP1 and various established cancer hallmarks in SKCM, including oxidative phosphorylation, mTORC1 signaling, and unfolded protein response (). Interestingly, the ELSPBP1 high expression group demonstrated a notable activation of glycolysis (). Furthermore, our analysis revealed a significant positive correlation between ELSPBP1 and TNFRSF14 in multiple SKCM datasets, while demonstrating a negative association with various immune signatures (Figure S4A). Further investigation through correlation analysis indicated that ELSPBP1 potentially plays a role in promoting macrophage infiltration, particularly of the M2 phenotype, in SKCM (Figure S4B). Lastly, by examining data from three drug databases, we observed that elevated expression levels of ELSPBP1 may potentially contribute to chemotherapy resistance in SKCM patients ().
Figure 8. Clinical and biological roles of ELSPBP1 in SKCM. (A) Univariable cox value and corresponding pvalue of each example gene from MOCS1 and MOCS2 in volcano plot; prognostic importance of leading genes of SKCM in bar plot. (B) Expression level of ELSPBP1 between patient response and nont-response to temozolomide. (C) Different expression level of ELSPBP1 in different stage tumor tissues in SKCM. (D) Different expression level of ELSPBP1 in metastasis and primary tumor tissues in SKCM. (E) Cox analysis of prognostic value of ELSPBP1 across multi SKMC datasets. (F) KM curves indicate patient with high expression of ELSPBP1 owned poor prognosis in GSE53118, GSE64467 and TCGA-SKCM. (G) Hallmarks related to ELSPBP1 in TCGA-SKCM. (H) ELSPBP1 could stimulate glycolysis in TCGA-SKCM. (I) Correlation of IC50 and ELSPBP1 expression level in GDSC, (J) CTRP and (K) PRISM databases.
4. Discussion
The availability of multi-omics datasets pertaining to cancer, specifically from the TCGA project, has played a crucial role in stimulating the exploration of SKCM through data mining (Bogunovic et al., Citation2009; Guo et al., Citation2021). This has resulted in the development of various prognostic models, molecular subtypes, and machine learning approaches, significantly enhancing our comprehension of the intricate heterogeneity associated with this formidable malignancy. Nevertheless, the integration of multiple subcluster algorithms in SKCM through a multiomics analysis remains unexplored, potentially resulting in the neglect of important perturbations. This oversight poses challenges in fully grasping the complexity inherent in this disease. In spite of numerous risk score and subtype analyses utilizing specific gene sets such as pyroptosis, ferroptosis, autophagy, angiogenesis, and others, it is crucial to recognize that these investigations frequently overlook the comprehensive panorama of SKCM encompassing multiple omics (Knackstedt et al., Citation2018). For instance, Zhang et al. identified three distinct SKCM subtypes by evaluating m7G modification levels, thereby unveiling improved survival outcomes and heightened antitumor immunity in patients exhibiting high m7G scores (Zhang et al., Citation2022). In a similar vein, previous research endeavors have devised risk score systems based on RNA modification writers, as well as utilized RNA expression and oncogenic mutation profiles for the purpose of cluster analysis. Through this approach, diverse subtypes exhibiting distinct characteristics and immune profiles have been identified (Zhang et al., Citation2022). In a study conducted by Harbst and colleagues, RNA expression and oncogenic mutation profiles were gathered to conduct cluster analysis, leading to the identification of four clusters characterized by high immune response, normal-like features, pigmentation, and proliferative phenotypes. Importantly, these clusters were found to persist across various stages of melanoma (Harbst et al., Citation2012). Nsengimana et al. employed a selection of 380 immune-related genes to classify melanoma patients into six distinct subtypes, each exhibiting unique immune infiltration patterns. The findings of this study shed light on the prevalence of β-catenin-mediated immune evasion in a considerable portion of primary melanomas, emphasizing the significance of patient stratification in enhancing outcomes in immunotherapy (Nsengimana et al., Citation2018). A comprehensive comprehension of the immune response to melanoma and its prognostic factors holds paramount importance in enhancing patient survival rates and predicting the efficacy of immunotherapeutic interventions. In their study, Poźniak et al. employed a set of 458 genes, which encompassed 30 distinct immune cell components, to conduct molecular subtyping analysis in a cohort of melanoma patients. This analysis resulted in the classification of these patients into three prognostic immune subgroups. The genetic and environmental predictors identified in this study hold promise as valuable indicators for evaluating the efficacy of immunotherapy in melanoma patients (Poźniak et al., Citation2019). Furthermore, these findings have significantly contributed to our understanding of the heterogeneity of SKCM and have identified several potential targets for precise management of these patients. However, previous studies have predominantly concentrated on individual omics levels, particularly the transcriptome, disregarding the comprehensive scope of multiomics, including DNA methylation and genome mutation. It is important to acknowledge that unraveling the contributions of different biomolecules and their interactions can greatly facilitate the understanding of complex disease mechanisms, particularly in the context of cancer. The utilization of multiomics methodologies allows for the exploration of diverse biological modalities and the concurrent exploration of the roles played by various molecular levels in cancer progression.
In the present study, we have successfully identified two previously unreported subtypes of SKCM. To the best of our knowledge, it is the first consensus work applying 10 advanced machine learning algorithms to decipher tumor heterogeneity at 5 omics level in SKCM. Our findings indicate that MOCS2 can be characterized as a “tumor cold” and malignant subtype, which exhibits a notable sensitivity to immune checkpoint inhibitor therapy. This sensitivity seems to be associated with the lower levels of immune components observed in MOCS2, as well as its comparatively worse prognosis when compared to MOCS1. This observation can potentially be explained by the higher enrichment score for cancer antigen presentation in MOCS2. Conversely, MOCS1 demonstrated higher scores in the cancer stemness index (RNAss) and ribosome-related activity, while also exhibiting a greater immune dysfunction score. Furthermore, we have observed dysregulation in multiple metabolic pathways within MOCS2, encompassing lipid metabolism, ADP ribosylation, pantothenate and CoA biosynthesis, as well as kynurenine and tryptophan metabolism. These aberrations significantly contribute to the distinct immune phenotypes observed between the two subtypes.
Our study has successfully identified several potential biomarkers that are differentially expressed between the SKCM subtypes MOCS1 and MOCS2. These biomarkers have the potential to be utilized as innovative targets for comprehensive diagnosis and therapy. Notably, our research has revealed higher mRNA expressions of IGJ and IGLL5 in MOCS2, which is a novel finding in this particular context. It is worth mentioning that previous studies conducted by Wan et al. have identified IGJ and IGLL5 as hub genes in clear cell renal cell carcinoma (Wan et al., Citation2020), while research by Kim et al. has suggested IGJ as a potential biomarker for sorafenib therapy sensitivity in hepatocellular carcinoma (Kim et al., Citation2017). Moreover, the prognostic significance of IGJ in B-acute lymphoblastic leukemia was emphasized by Cruz et al. (Cruz-Rodriguez et al., Citation2016), while Japanese researchers introduced a risk score system incorporating IGLL5, which potentially affects the PI3K/AKT pathway and could be valuable for categorizing salivary duct carcinoma (Kohsaka et al., Citation2022). Nevertheless, the involvement of IGJ and IGLL5 in the risk stratification of SKCM has not been investigated prior to our study. Furthermore, we have identified specific long noncoding RNAs, including HCP5 and NEAT5, as potential biomarkers for SKCM. For example, Wei et al. have provided evidence that the overexpression of HCP5 can enhance the expression of RARRES3 by interacting with miR-1286, consequently alleviating the malignant characteristics of SKCM (Wei et al., Citation2019). Consequently, the identification of these innovative markers in our investigation holds significant potential for subsequent biological exploration and the formulation of diagnostic frameworks.
Previous studies have recognized the diversity in the immune status of SKCM. In our multiomics-based investigation, we have made a noteworthy discovery: MOCS1 can be classified as an 'immune-hot’ form of cancer, which is conventionally defined by the substantial presence of immune cells and constituents. Intriguingly, this particular subtype also demonstrated heightened levels of nearly all immune suppressor and checkpoint-associated indicators. This novel 'conservational’ phenotype, initially identified in our research, provides a fresh outlook on comprehending the immune dynamics in SKCM. Nevertheless, this paradoxical phenotype is not exclusive to SKCM and has been documented in various malignancies. For instance, Jiang et al. elucidated that renal cancer patients exhibiting heightened immune cell enrichment scores often experienced unfavorable prognoses, despite concurrent elevation of immune-activated markers (Jiang et al., Citation2022). Subsequent examination elucidated that these patients frequently exhibited persistent inflammation scores and activation of the NF-κb pathway, resulting in an immune exhaustion phenotype (Dong et al., Citation2022; Jiang et al., Citation2022; Shi et al., Citation2022). Considering the shared cancer biology characteristics between kidney cancer and melanoma, it is plausible to hypothesize that a comparable immune milieu in MOCS1 could potentially impede the effectiveness of immune checkpoint inhibitor (ICI) therapy. This discovery underscores the intricate nature of immune responses in cancer and emphasizes the necessity for more refined strategies in the field of immunotherapy.
In our investigation of the underlying factors contributing to prognostic variations, we observed that patients with the MOCS2 subtype demonstrated elevated ribosome activity and estrogen signaling, as evidenced by GSEA. These findings align with prior studies that have implicated ribosome-related targets and pathways in tumor progression and immune response (Di Fazio & Gullerova, Citation2023). For instance, Li et al. reported that AE007-mediated inhibition of RSK2, a ribosomal protein S6 kinase, resulted in decreased melanoma progression through induction of apoptosis and cell cycle arrest (Li et al., Citation2022). In a similar vein, Wang et al. have provided evidence showcasing the ability of trichosanthin, a naturally occurring compound, to induce apoptosis in tumor cells and augment the infiltration of immune cells, thereby advancing the prospects of antitumor immunity (Wang et al., Citation2023). Our findings also underscore the significance of sex hormones in SKCM. Prior investigations have consistently revealed a disparity in survival rates based on gender, with women generally exhibiting more favorable outcomes. This phenomenon has been attributed to the influence of estrogen signaling, as elucidated by studies conducted by Pontecorvi et al. and Bechmann, which have demonstrated the antitumor properties of ERβ agonists and modulators on melanoma cells (Pontecorvi et al., Citation2022). Furthermore, Chakraborty et al. have reported that the activation of ERα signaling in tumor-associated macrophages can induce an immunosuppressive state (Chakraborty et al., Citation2023). In our study, we have successfully identified estrogen signaling as a noteworthy pathway in both MOCS1 and MOCS2 subtypes, thereby indicating the possibility of targeting ER signaling as an innovative therapeutic approach for advanced SKCM patients.
In the present study, we have successfully identified a number of agents that exhibit specific efficacy against the high-risk MOCS2 subtype of SKCM. Among these agents are exisulind, butein, and NSC87877. It is worth noting that these agents have demonstrated effectiveness in the treatment of various solid tumors. For instance, exisulind has been observed to effectively impede the proliferation of castration-resistant prostate cancer cells (Liang et al., Citation2020). Furthermore, Aono et al. have provided evidence that sulindac, which shares a structural similarity with exisulind, targets VDAC1 and VDAC2, thereby suppressing the mTORC1 pathway and inducing cell cycle arrest. Butein, a constituent of the chalcone class, has been acknowledged for its remarkable antitumor properties against various cancer types (Aono et al., Citation2018). Zhao et al.'s investigation demonstrated that butein effectively diminishes the expression of PD-L1 in non-small cell lung carcinoma, thereby promoting the infiltration of CD8+ T-cells through its interaction with STAT1 (Zhao et al., Citation2023). Additionally, Di et al. uncovered that butein possesses the ability to induce endoplasmic reticulum stress-dependent accumulation of reactive oxygen species, ultimately triggering apoptotic activation in lung cancer (Di et al., Citation2019). Perez’s study showcased the efficacy of NSC87877 in impeding the growth of acute myeloid leukemia cells and prolonging survival in xenograft models within the domain of hematological malignancies (Pérez-Fernández et al., Citation2019). These cumulative results substantiate the therapeutic potential of exisulind, butein, and NSC87877 for advanced SKCM patients, specifically those afflicted with the high-risk MOCS2 subtype. Nevertheless, additional experimental verification is necessary to ascertain their effectiveness in this particular context.
This study conducted a comprehensive investigation into the molecular signatures associated with prognosis in SKCM at multiple omics levels. The research not only revealed the heterogeneity of SKCM at various omics levels but also identified a novel target, ELSPBP1, which may contribute to the progression of SKCM by activating glycolysis and inducing M2 macrophage infiltration. These findings warrant further investigation. However, it is important to acknowledge several limitations of our study. Firstly, all SKCM samples utilized for discovery and testing were obtained from retrospective studies. Firstly, it should be noted that all samples of SKCM utilized in the discovery and testing phase were obtained from retrospective studies. Consequently, it is imperative to conduct further validation of the MOCS1 and MOCS2 remodeling system in prospective SKCM cohorts in order to ascertain its robustness and generalizability. Secondly, the absence of comprehensive clinical information, including data on response rates to molecular and immune checkpoint therapies, has hindered the exploration of a comprehensive correlation between various clinical traits and our remodeling findings. Furthermore, in order to gain a comprehensive understanding of the complex biological disparities between MOCS1 and MOCS2, further experimentation in both in vivo and in vitro settings is imperative. This entails the examination of potential therapeutic agents that have been identified in databases such as GDSC. Moreover, the amalgamation of our clustering findings with pertinent clinical parameters, including TNM staging, conventional mutation sites, and previous clustering outcomes, has the potential to facilitate the creation of a more refined and all-encompassing risk assessment system for SKCM. The integration of these elements represents a crucial direction for future research endeavors.
5. Conclusions
In summary, this study presents a novel clustering framework for SKCM that utilizes multiomics datasets to effectively uncover the heterogeneity within and between SKCM subtypes. Two previously unidentified subtypes of SKCM were successfully identified and subsequently validated in two separate SKCM cohorts using different sequencing platforms, thus demonstrating the reproducibility of our findings. Importantly, MOCS2 was identified as a 'cold’ or 'immune desert’ cancer type, indicating its heightened susceptibility to immune checkpoint inhibitor (ICI) therapy. Furthermore, the discovery of potential therapeutic compounds, namely dianilinophthalimide, exisulind, and butein, for the treatment of MOCS2 subtype SKCM represents a notable progression. To ascertain the effectiveness of these innovative agents, comprehensive investigations utilizing xenografts and patient-derived organoids are imperative, with the ultimate goal of developing targeted and efficacious treatments tailored specifically for MOCS2 subtype SKCM patients.
Author contributions
Jianru Xiao, Jian Jiao, Peng Luo Zhenxi Li conceptualized and designed this study. Aimin Jiang, Tianying Xie, Hao Jiang and Peng Luo wrote the first draft of the manuscript. Juelan Ye, Fuchun Liu, Luosheng Zhang, Chunbiao Wu and Aimin Jiang contributed equally to this work. All authors contributed to the article and approved the submitted version.
Supplemental Material
Download Zip (7.2 MB)Acknowledgments
We thank Sangerbox for generously sharing their bioinformatic experience and codes.
Disclosure statement
The authors declare no conflict of interest.
Data availability statement
The original contributions presented in the study are summarized in the Methods and Materials section, and further questions can be addressed to the corresponding authors.
Additional information
Funding
References
- Addala, V., Newell, F., Pearson, J. V., Redwood, A., Robinson, B. W., Creaney, J., & Waddell, N. (2024). Computational immunogenomic approaches to predict response to cancer immunotherapies. Nature Reviews. Clinical Oncology, 21(1), 28–46. https://doi.org/10.1038/s41571-023-00830-6
- Anbalagan, T., Nath, M. K., Vijayalakshmi, D., & Anbalagan, A. (2023). Analysis of various techniques for ECG signal in healthcare, past, present, and future. Biomedical Engineering Advances, 6, 100089. https://doi.org/10.1016/j.bea.2023.100089
- Aono, Y., Horinaka, M., Iizumi, Y., Watanabe, M., Taniguchi, T., Yasuda, S., & Sakai, T. (2018). Sulindac sulfone inhibits the mTORC1 pathway in colon cancer cells by directly targeting voltage-dependent anion channel 1 and 2. Biochemical and Biophysical Research Communications, 505(4), 1203–1210.
- Aran, D., Hu, Z., & Butte, A. J. (2017). xCell: Digitally portraying the tissue cellular heterogeneity landscape. Genome Biology, 18(1), 220. https://doi.org/10.1186/s13059-017-1349-1
- Bogunovic, D., O'Neill, D. W., Belitskaya-Levy, I., Vacic, V., Yu, Y.-L., Adams, S., Darvishian, F., Berman, R., Shapiro, R., Pavlick, A. C., Lonardi, S., Zavadil, J., Osman, I., & Bhardwaj, N. (2009). Immune profile and mitotic index of metastatic melanoma lesions enhance clinical staging in predicting patient survival. Proceedings of the National Academy of Sciences of the United States of America, 106(48), 20429–20434. https://doi.org/10.1073/pnas.0905139106
- Carlino, M. S., Larkin, J., & Long, G. V. (2021). Immune checkpoint inhibitors in melanoma. Lancet (London, England), 398(10304), 1002–1014. https://doi.org/10.1016/S0140-6736(21)01206-X
- Chakraborty, B., Byemerwa, J., Krebs, T., Lim, F., Chang, C.-Y., & McDonnell, D. P. (2023). Estrogen receptor signaling in the immune system. Endocrine Reviews, 44(1), 117–141. https://doi.org/10.1210/endrev/bnac017
- Chen, B., Khodadoust, M. S., Liu, C. L., Newman, A. M., & Alizadeh, A. A. (2018). Profiling tumor infiltrating immune cells with CIBERSORT. Methods in Molecular Biology (Clifton, N.J.), 1711, 243–259. https://doi.org/10.1007/978-1-4939-7493-1_12
- Cirenajwis, H., Ekedahl, H., Lauss, M., Harbst, K., Carneiro, A., Enoksson, J., Rosengren, F., Werner-Hartman, L., Törngren, T., Kvist, A., Fredlund, E., Bendahl, P.-O., Jirström, K., Lundgren, L., Howlin, J., Borg, Å., Gruvberger-Saal, S. K., Saal, L. H., Nielsen, K., … Jönsson, G. (2015). Molecular stratification of metastatic melanoma using gene expression profiling: Prediction of survival outcome and benefit from molecular targeted therapy. Oncotarget, 6(14), 12297–12309. https://doi.org/10.18632/oncotarget.3655
- Cruz-Rodriguez, N., Combita, A. L., Enciso, L. J., Quijano, S. M., Pinzon, P. L., Lozano, O. C., Castillo, J. S., Li, L., Bareño, J., Cardozo, C., Solano, J., Herrera, M. V., Cudris, J., & Zabaleta, J. (2016). High expression of ID family and IGJ genes signature as predictor of low induction treatment response and worst survival in adult Hispanic patients with B-acute lymphoblastic leukemia. Journal of Experimental & Clinical Cancer Research: CR, 35(1), 64. https://doi.org/10.1186/s13046-016-0333-z
- Di Fazio, A., & Gullerova, M. (2023). An old friend with a new face: TRNA-derived small RNAs with big regulatory potential in cancer biology. British Journal of Cancer, 128(9), 1625–1635. https://doi.org/10.1038/s41416-023-02191-4
- Di Raimondo, C., Lozzi, F., Di Domenico, P. P., Campione, E., & Bianchi, L. (2023). The Diagnosis and Management of Cutaneous Metastases from Melanoma. International Journal of Molecular Sciences, 24(19), 14535. https://doi.org/10.3390/ijms241914535
- Di, S., Fan, C., Ma, Z., Li, M., Guo, K., Han, D., Li, X., Mu, D., & Yan, X. (2019). PERK/eIF-2α/CHOP pathway dependent ROS generation mediates butein-induced non-small-cell lung cancer apoptosis and G2/M phase arrest. International Journal of Biological Sciences, 15(8), 1637–1653. https://doi.org/10.7150/ijbs.33790
- Dong, K., Gu, D., Shi, J., Bao, Y., Fu, Z., Fang, Y., Qu, L., Zhu, W., Jiang, A., & Wang, L. (2022). Identification and verification of m7G modification patterns and characterization of tumor microenvironment infiltration via multi-omics analysis in clear cell renal cell carcinoma. Frontiers in Immunology, 13, 874792. https://doi.org/10.3389/fimmu.2022.874792
- Elangovan, P., & Nath, M. K. (2021). A novel shallow ConvNet-18 for malaria parasite detection in thin blood smear images: CNN based malaria parasite detection. SN Computer Science, 2(5), 380. https://doi.org/10.1007/s42979-021-00763-w
- Elangovan, P., & Nath, M. K. (2022). En‐ConvNet: A novel approach for glaucoma detection from color fundus images using ensemble of deep convolutional neural networks. International Journal of Imaging Systems and Technology, 32(6), 2034–2048. https://doi.org/10.1002/ima.22761
- Elangovan, P., Vijayalakshmi, D., & Nath, M. K. (2024). COVID-19Net: An effective and robust approach for COVID-19 detection using ensemble of ConvNet-24 and customized pre-trained models. Circuits, Systems, and Signal Processing, 43(4), 2385–2408. https://doi.org/10.1007/s00034-023-02564-3
- Finotello, F., Mayer, C., Plattner, C., Laschober, G., Rieder, D., Hackl, H., Krogsdam, A., Loncova, Z., Posch, W., Wilflingseder, D., Sopper, S., Ijsselsteijn, M., Brouwer, T. P., Johnson, D., Xu, Y., Wang, Y., Sanders, M. E., Estrada, M. V., Ericsson-Gonzalez, P., . . . Trajanoski, Z. (2019). Molecular and pharmacological modulators of the tumor immune contexture revealed by deconvolution of RNA-seq data. Genome Medicine, 11(1), 34. https://doi.org/10.1186/s13073-019-0638-6
- Guo, W., Wang, H., & Li, C. (2021). Signal pathways of melanoma and targeted therapy. Signal Transduction and Targeted Therapy, 6(1), 424. https://doi.org/10.1038/s41392-021-00827-6
- Hänzelmann, S., Castelo, R., & Guinney, J. (2013). GSVA: Gene set variation analysis for microarray and RNA-seq data. BMC Bioinformatics, 14(1), 7. https://doi.org/10.1186/1471-2105-14-7
- Harbst, K., Staaf, J., Lauss, M., Karlsson, A., Måsbäck, A., Johansson, I., Bendahl, P.-O., Vallon-Christersson, J., Törngren, T., Ekedahl, H., Geisler, J., Höglund, M., Ringnér, M., Lundgren, L., Jirström, K., Olsson, H., Ingvar, C., Borg, Å., Tsao, H., & Jönsson, G. (2012). Molecular profiling reveals low- and high-grade forms of primary melanoma. Clinical Cancer Research: An Official Journal of the American Association for Cancer Research, 18(15), 4026–4036. https://doi.org/10.1158/1078-0432.CCR-12-0343
- He, Y., & Wang, X. (2023). Identifying biomarkers associated with immunotherapy response in melanoma by multi-omics analysis. Computers in Biology and Medicine, 167, 107591. https://doi.org/10.1016/j.compbiomed.2023.107591
- Jiang, A., Bao, Y., Wang, A., Gong, W., Gan, X., Wang, J., Bao, Y., Wu, Z., Liu, B., Lu, J., & Wang, L. (2022). Establishment of a prognostic prediction and drug selection model for patients with clear cell renal cell carcinoma by multiomics data analysis. Oxidative Medicine and Cellular Longevity, 2022, e3617775–30. https://doi.org/10.1155/2022/3617775
- Jiang, A., Luo, P., Chen, M., Fang, Y., Liu, B., Wu, Z., Qu, L., Wang, A., Wang, L., & Cai, C. (2022). A new thinking: Deciphering the aberrance and clinical implication of copper-death signatures in clear cell renal cell carcinoma. Cell & Bioscience, 12(1), 209. https://doi.org/10.1186/s13578-022-00948-7
- Jiang, A., Meng, J., Bao, Y., Wang, A., Gong, W., Gan, X., Wang, J., Bao, Y., Wu, Z., Lu, J., Liu, B., & Wang, L. (2021). Establishment of a prognosis prediction model based on pyroptosis-related signatures associated with the immune microenvironment and molecular heterogeneity in clear cell renal cell carcinoma. Frontiers in Oncology, 11, 755212. https://doi.org/10.3389/fonc.2021.755212
- Jiang, A., Meng, J., Gong, W., Zhang, Z., Gan, X., Wang, J., Wu, Z., Liu, B., Qu, L., & Wang, L. (2022). Elevated SNRPA1, as a promising predictor reflecting severe clinical outcome via effecting tumor immunity for ccRCC, is related to cell invasion, metastasis, and sunitinib sensitivity. Frontiers in Immunology, 13, 842069. https://doi.org/10.3389/fimmu.2022.842069
- Jiang, A., Wu, X., Wang, D., Wang, A., Dong, K., Liu, B., Qu, L., Luo, P., Wang, J., Tong, Q., & Wang, L. (2022). A new thinking: Deciphering the aberrance and clinical implication of IGF axis regulation pattern in clear cell renal cell carcinoma. Frontiers in Immunology, 13, 935595. https://doi.org/10.3389/fimmu.2022.935595
- Jiang, A., Xu, Z., Fang, X., Gu, D., Dong, K., Wu, Z., Gan, X., Liu, B., Ge, S., Qu, L., Luo, P., Wang, A., & Wang, L. (2023). RNA modification pattern-based subtypes reveal heterogenous clinical outcomes and tumor immunity of clear cell renal cell carcinoma. MedComm – Future Medicine, 2(1), e30. https://doi.org/10.1002/mef2.30
- Kim, H., Yu, S. J., Yeo, I., Cho, Y. Y., Lee, D. H., Cho, Y., Cho, E. J., Lee, J.-H., Kim, Y. J., Lee, S., Jun, J., Park, T., Yoon, J.-H., & Kim, Y. (2017). Prediction of response to sorafenib in hepatocellular carcinoma: A putative marker panel by multiple reaction monitoring-mass spectrometry (MRM-MS). Molecular & Cellular Proteomics: MCP, 16(7), 1312–1323. https://doi.org/10.1074/mcp.M116.066704
- Knackstedt, T., Knackstedt, R. W., Couto, R., & Gastman, B. (2018). Malignant melanoma: Diagnostic and management update. Plastic and Reconstructive Surgery, 142(2), 202e–216e. https://doi.org/10.1097/PRS.0000000000004571
- Kohsaka, S., Tada, Y., Ando, M., Nakaguro, M., Shirai, Y., Ueno, T., Kojima, S., Hirai, H., Saigusa, N., Kano, S., Tsukahara, K., Togashi, T., Ozawa, H., Kondo, T., Okami, K., Takahashi, H., Kawakita, D., Fushimi, C., Suzuki, T., … Mano, H. (2022). Identification of novel prognostic and predictive biomarkers in salivary duct carcinoma via comprehensive molecular profiling. NPJ Precision Oncology, 6(1), 82. https://doi.org/10.1038/s41698-022-00324-1
- Li, T., Fan, J., Wang, B., Traugh, N., Chen, Q., Liu, J. S., Li, B., & Liu, X. S. (2017). TIMER: A web server for comprehensive analysis of tumor-infiltrating immune cells. Cancer Research, 77(21), e108–e110. https://doi.org/10.1158/0008-5472.CAN-17-0307
- Li, Y., Yu, P., Long, J., Tang, L., Zhang, X., Zhou, Z., Cao, D., Su, J., Chen, X., & Peng, C. (2022). A novel ribosomal protein S6 kinase 2 inhibitor attenuates the malignant phenotype of cutaneous malignant melanoma cells by inducing cell cycle arrest and apoptosis. Bioengineered, 13(5), 13555–13570. https://doi.org/10.1080/21655979.2022.2080364
- Liang, X., Hu, K., Li, D., Wang, Y., Liu, M., Wang, X., Zhu, W., Wang, X., Yang, Z., & Lu, J. (2020). Identification of core genes and potential drugs for castration-resistant prostate cancer based on bioinformatics analysis. DNA and Cell Biology, 39(5), 836–847. https://doi.org/10.1089/dna.2019.5247
- Liu, Z., Liu, L., Weng, S., Guo, C., Dang, Q., Xu, H., Wang, L., Lu, T., Zhang, Y., Sun, Z., & Han, X. (2022). Machine learning-based integration develops an immune-derived lncRNA signature for improving outcomes in colorectal cancer. Nature Communications, 13(1), 816. https://doi.org/10.1038/s41467-022-28421-6
- Liu, Z., Xu, H., Weng, S., Guo, C., Dang, Q., Zhang, Y., Ren, Y., Liu, L., Wang, L., Ge, X., Xing, Z., Zhang, J., Luo, P., & Han, X. (2023). Machine learning algorithm-generated and multi-center validated melanoma prognostic signature with inspiration for treatment management. Cancer Immunology, Immunotherapy: CII, 72(3), 599–615. https://doi.org/10.1007/s00262-022-03279-1
- Long, G. V., Swetter, S. M., Menzies, A. M., Gershenwald, J. E., & Scolyer, R. A. (2023). Cutaneous melanoma. Lancet (London, England), 402(10400), 485–502. https://doi.org/10.1016/S0140-6736(23)00821-8
- Love, M. I., Huber, W., & Anders, S. (2014). Moderated estimation of fold change and dispersion for RNA-seq data with DESeq2. Genome Biology, 15(12), 550. https://doi.org/10.1186/s13059-014-0550-8
- Lu, X., Meng, J., Su, L., Jiang, L., Wang, H., Zhu, J., Huang, M., Cheng, W., Xu, L., Ruan, X., Yeh, S., Liang, C., & Yan, F. (2021a). Multi-omics consensus ensemble refines the classification of muscle-invasive bladder cancer with stratified prognosis, tumour microenvironment and distinct sensitivity to frontline therapies. Clinical and Translational Medicine, 11(12), e601. https://doi.org/10.1002/ctm2.601
- Lu, X., Meng, J., Zhou, Y., Jiang, L., & Yan, F. (2021b). MOVICS: An R package for multi-omics integration and visualization in cancer subtyping. Bioinformatics, 36(22–23), 5539–5541. https://doi.org/10.1093/bioinformatics/btaa1018
- Mayakonda, A., Lin, D. C., Assenov, Y., Plass, C., & Koeffler, H. P. (2018). Maftools: Efficient and comprehensive analysis of somatic variants in cancer. Genome Research, 28(11), 1747–1756. https://doi.org/10.1101/gr.239244.118
- Meng, J., Jiang, A., Lu, X., Gu, D., Ge, Q., Bai, S., Zhou, Y., Zhou, J., Hao, Z., Yan, F., Wang, L., Wang, H., Du, J., & Liang, C. (2023). Multiomics characterization and verification of clear cell renal cell carcinoma molecular subtypes to guide precise chemotherapy and immunotherapy. iMeta, 2(4), e147. https://doi.org/10.1002/imt2.147
- Meraz-Torres, F., Niessner, H., Plöger, S., Riel, S., Schörg, B., Casadei, N., Kneilling, M., Schaller, M., Flatz, L., Macek, B., Eigentler, T., Rieß, O., Garbe, C., Amaral, T., & Sinnberg, T. (2024). Augmenting MEK inhibitor efficacy in BRAF wild-type melanoma: Synergistic effects of disulfiram combination therapy. Journal of Experimental & Clinical Cancer Research: CR, 43(1), 30. https://doi.org/10.1186/s13046-023-02941-5
- Newell, F., Pires da Silva, I., Johansson, P. A., Menzies, A. M., Wilmott, J. S., Addala, V., Carlino, M. S., Rizos, H., Nones, K., Edwards, J. J., Lakis, V., Kazakoff, S. H., Mukhopadhyay, P., Ferguson, P. M., Leonard, C., Koufariotis, L. T., Wood, S., Blank, C. U., Thompson, J. F., … Long, G. V. (2022). Multiomic profiling of checkpoint inhibitor-treated melanoma: Identifying predictors of response and resistance, and markers of biological discordance. Cancer Cell, 40(1), 88–102.e7. https://doi.org/10.1016/j.ccell.2021.11.012
- Noviello, T. M. R., Di Giacomo, A. M., Caruso, F. P., Covre, A., Mortarini, R., Scala, G., Costa, M. C., Coral, S., Fridman, W. H., Sautès-Fridman, C., Brich, S., Pruneri, G., Simonetti, E., Lofiego, M. F., Tufano, R., Bedognetti, D., Anichini, A., Maio, M., & Ceccarelli, M. (2023). Guadecitabine plus ipilimumab in unresectable melanoma: Five-year follow-up and integrated multi-omic analysis in the phase 1b NIBIT-M4 trial. Nature Communications, 14(1), 5914. https://doi.org/10.1038/s41467-023-40994-4
- Nsengimana, J., Laye, J., Filia, A., O'Shea, S., Muralidhar, S., Poźniak, J., Droop, A., Chan, M., Walker, C., Parkinson, L., Gascoyne, J., Mell, T., Polso, M., Jewell, R., Randerson-Moor, J., Cook, G. P., Bishop, D. T., & Newton-Bishop, J. (2018). β-Catenin-mediated immune evasion pathway frequently operates in primary cutaneous melanomas. The Journal of Clinical Investigation, 128(5), 2048–2063. https://doi.org/10.1172/JCI95351
- Pérez-Fernández, A., López-Ruano, G., Prieto-Bermejo, R., Ijurko, C., Díez-Campelo, M., Sánchez-Guijo, F., & Hernández-Hernández, Á. (2019). SHP1 and SHP2 inhibition enhances the pro-differentiative effect of phorbol esters: An alternative approach against acute myeloid leukemia. Journal of Experimental & Clinical Cancer Research: CR, 38(1), 80. https://doi.org/10.1186/s13046-019-1097-z
- Pontecorvi, G., Bellenghi, M., Tait, S., Tirelli, V., Matarrese, P., Mattia, G., Carè, A., & Puglisi, R. (2022). Different susceptibilities of human melanoma cell lines to G2/M blockage and cell death activation in response to the estrogen receptor β agonist LY500307. Journal of Cancer, 13(5), 1573–1587. https://doi.org/10.7150/jca.65425
- Poźniak, J., Nsengimana, J., Laye, J. P., O'Shea, S. J., Diaz, J. M. S., Droop, A. P., Filia, A., Harland, M., Davies, J. R., Mell, T., Randerson-Moor, J. A., Muralidhar, S., Hogan, S. A., Freiberger, S. N., Levesque, M. P., Cook, G. P., Bishop, D. T., & Newton-Bishop, J. (2019). Genetic and environmental determinants of immune response to cutaneous melanoma. Cancer Research, 79(10), 2684–2696. https://doi.org/10.1158/0008-5472.CAN-18-2864
- Racle, J., & Gfeller, D. (2020). EPIC: A tool to estimate the proportions of different cell types from bulk gene expression data. Methods in Molecular Biology (Clifton, N.J.), 2120, 233–248.
- Radke, J., Schumann, E., Onken, J., Koll, R., Acker, G., Bodnar, B., Senger, C., Tierling, S., Möbs, M., Vajkoczy, P., Vidal, A., Högler, S., Kodajova, P., Westphal, D., Meier, F., Heppner, F., Kreuzer-Redmer, S., Grebien, F., Jürchott, K., & Redmer, T. (2022). Decoding molecular programs in melanoma brain metastases. Nature Communications, 13(1), 7304. https://doi.org/10.1038/s41467-022-34899-x
- Robert, C., & Gautheret, D. (2022). Multi-omics prediction in melanoma immunotherapy: A new brick in the wall. Cancer Cell, 40(1), 14–16. https://doi.org/10.1016/j.ccell.2021.12.008
- Roshni Thanka, M., Bijolin Edwin, E., Ebenezer, V., Martin Sagayam, K., Jayakeshav Reddy, B., Günerhan, H., & Emadifar, H. (2023). A hybrid approach for melanoma classification using ensemble machine learning techniques with deep transfer learning. Computer Methods and Programs in Biomedicine Update, 3, 100103. https://doi.org/10.1016/j.cmpbup.2023.100103
- Roth, S. C. (2019). What is genomic medicine? Journal of the Medical Library Association: JMLA, 107(3), 442–448. https://doi.org/10.5195/jmla.2019.604
- Shi, C., Qin, K., Lin, A., Jiang, A., Cheng, Q., Liu, Z., Zhang, J., & Luo, P. (2022). The role of DNA damage repair (DDR) system in response to immune checkpoint inhibitor (ICI) therapy. Journal of Experimental & Clinical Cancer Research: CR, 41(1), 268. https://doi.org/10.1186/s13046-022-02469-0
- Siegel, R. L., Giaquinto, A. N., & Jemal, A. (2024). Cancer statistics, 2024. CA: A Cancer Journal for Clinicians, 74(1), 12–49. https://doi.org/10.3322/caac.21820
- Siegel, R. L., Miller, K. D., Fuchs, H. E., & Jemal, A. (2022). Cancer statistics, 2022. CA: A Cancer Journal for Clinicians, 72(1), 7–33. https://doi.org/10.3322/caac.21708
- Villani, A., Potestio, L., Fabbrocini, G., Troncone, G., Malapelle, U., & Scalvenzi, M. (2022). The treatment of advanced melanoma: Therapeutic update. International Journal of Molecular Sciences, 23(12), 6388. https://doi.org/10.3390/ijms23126388
- Wan, B., Liu, B., Huang, Y., & Lv, C. (2020). Identification of genes of prognostic value in the ccRCC microenvironment from TCGA database. Molecular Genetics & Genomic Medicine, 8(4), e1159. https://doi.org/10.1002/mgg3.1159
- Wang, K., Wang, X., Zhang, M., Ying, Z., Zhu, Z., Tam, K. Y., Li, C., Zhou, G., Gao, F., Zeng, M., Sze, S. C. W., Wang, X., & Sha, O. (2023). Trichosanthin promotes anti-tumor immunity through mediating chemokines and granzyme B secretion in hepatocellular carcinoma. International Journal of Molecular Sciences, 24(2), 1416. https://doi.org/10.3390/ijms24021416
- Wei, X., Gu, X., Ma, M., & Lou, C. (2019). Long noncoding RNA HCP5 suppresses skin cutaneous melanoma development by regulating RARRES3 gene expression via sponging miR-12. OncoTargets and Therapy, 12, 6323–6335. https://doi.org/10.2147/OTT.S195796
- Xu, L., Deng, C., Pang, B., Zhang, X., Liu, W., Liao, G., Yuan, H., Cheng, P., Li, F., Long, Z., Yan, M., Zhao, T., Xiao, Y., & Li, X. (2018). TIP: A web server for resolving tumor immunophenotype profiling. Cancer Research, 78(23), 6575–6580. https://doi.org/10.1158/0008-5472.CAN-18-0689
- Yu, G., Wang, L.-G., Han, Y., & He, Q.-Y. (2012). clusterProfiler: An R package for comparing biological themes among gene clusters. Omics: A Journal of Integrative Biology, 16(5), 284–287. https://doi.org/10.1089/omi.2011.0118
- Zeng, D., Ye, Z., Shen, R., Yu, G., Wu, J., Xiong, Y., Zhou, R., Qiu, W., Huang, N., Sun, L., Li, X., Bin, J., Liao, Y., Shi, M., & Liao, W. (2021). IOBR: Multi-omics immuno-oncology biological research to decode tumor microenvironment and signatures. Frontiers in Immunology, 12, 687975. https://doi.org/10.3389/fimmu.2021.687975
- Zhang, S., Xiong, Y., Zheng, C., Long, J., Zhou, H., Zeng, Z., Ouyang, Y., & Tang, F. (2022). Crosstalk between four types of RNA modification writers characterizes the tumor immune microenvironment infiltration patterns in skin cutaneous melanoma. Frontiers in Cell and Developmental Biology, 10, 821678. https://doi.org/10.3389/fcell.2022.821678
- Zhang, X., Miao, Y., Sun, H.-W., Wang, Y.-X., Zhao, W.-M., Pang, A.-Y., Wu, X.-Y., Shen, C.-C., & Chen, X.-D. (2022). Integrated analysis from multi-center studies identities m7G-derived modification pattern and risk stratification system in skin cutaneous melanoma. Frontiers in Immunology, 13, 1034516. https://doi.org/10.3389/fimmu.2022.1034516
- Zhao, L., Zhang, W., Luan, F., Chen, X., Wu, H., He, Q., Weng, Q., Ding, L., & Yang, B. (2023). Butein suppresses PD-L1 expression via downregulating STAT1 in non-small cell lung cancer. Biomedicine & Pharmacotherapy = Biomedecine & Pharmacotherapie, 157, 114030. https://doi.org/10.1016/j.biopha.2022.114030