
 ?Mathematical formulae have been encoded as MathML and are displayed in this HTML version using MathJax in order to improve their display. Uncheck the box to turn MathJax off. This feature requires Javascript. Click on a formula to zoom.
Abstract
Despite considerable improvement in therapy and diagnosis, brain tumors remain a global public health concern. Among all brain tumors, 80% are due to Glioblastoma. The average survival rate of a patient once diagnosed with glioblastoma is 15 months. Lately, the role of peptidase enzymes, especially Neprilysin, a neutral endopeptidase, is gaining attention for its role in tumor growth regulation. Neprilysin expressions are positively correlated with several tumors including GBM and reduced expression of NEP protein is associated with the pathogenesis of multiple tumors. One of the main reasons for NEP protein downregulation is the action of Histone deacetylase (HDAC) enzymes, especially HDAC1. Additionally, studies have reported that increased levels of HDAC1 are responsible for downregulating NEP gene expression. Hence, HDAC1 inhibition can be a good target to elevate NEP levels, which can be a good therapeutic approach to GBM. This study utilizes the computational drug repurposing tool, Schrodinger Maestro to identify HDAC1 inhibitors from the ZINC15 database.1379 FDA-approved drugs from the ZINC15 database were screened through molecular docking. Based on docking score and ligand-protein interaction, the top ten molecules were selected which were then subjected to binding energy calculation and molecular dynamics (MD) simulations. The three most active drugs from the MD simulations- ZINC22010649 (Panobinostat), ZINC4392649 (Tasimelteon) and ZINC1673 (Melphalan), were tested on C6 and U87 MG glioblastoma cells for cytotoxicity and HDAC1 protein levels using western blot analysis. Among the three drugs, Panobinostat exhibited potent cytotoxic action and showed a significant reduction in the HDAC1 protein levels.
Communicated by Ramaswamy H. Sarma
1. Introduction
Glioma accounts for nearly 29% of all brain cancers. Glioblastoma (GBM), the most malignant glioma, has an average survival rate of 15 months (Lah et al., Citation2020). According to World Health Organization (WHO) classification of tumors 2021, WHO CNS 5, astrocytic tumors are grouped into- with and without Isocitrate dehydrogenase (IDH) mutations. Tumors without IDH mutations (wildtype) are termed glioblastoma (IDH- wildtype with CNS WHO grade 4) (Torp et al., Citation2022). This highly invasive and aggressive tumor emerges from the astrocytes, a subtype of the non-neuronal cells which provide homeostatic support to the neurons in the nervous system (Sasmita et al., Citation2018) (Akmal et al., Citation2020).
Nearly, 86% of the GBM cases are seen in the anterior subcortical regions of the brain, specific to the frontal lobe (40%), temporal lobe (29%), parietal lobe (14%) and occipital lobe (3%) and the remaining cases (14%) occur in other regions as well (Janjua et al., Citation2021). Among these, the survival rate is better in GBM of the frontal lobe, than the others (Thakkar et al., Citation2014). It is also reported that the brain regions are differentially invaded by the GBM cells, indicating differential susceptibility of brain regions to GBM invasion, with the hippocampus being an uncommon site for GBM progression (Perrin et al., Citation2019). GBM is categorized into primary and secondary, where many cases belong to the former and are seen in older patients. In comparison, secondary GBM is seen in younger patients and usually arises from the progression of lower glioma grades (van Tellingen et al., Citation2015).
Patients suffering from primary GBM experience severe complications and do not survive beyond 9–12 months after being diagnosed, while in the case of secondary GBM, the severity of the disease increases with time (Silantyev et al., Citation2019). The current treatment strategies for GBM consist of tumor resection, radiation and chemotherapy, and best supportive care (Carlsson et al., Citation2014) (Minniti et al., Citation2021). The gold standard in GBM therapy involves treatment with Temozolomide, an alkylating agent. However, the disease is considered incurable due to its heterogenous nature and recurrence (Yu & Quail, Citation2021). This necessitates the need for new therapeutic approaches.
The role of peptidases in drug discovery has been emerging over the last decade. Neprilysin (NEP), an endopeptidase, is gaining considerable attention in cancer suppression (Sankhe et al., Citation2021a). NEP, a membrane bound metalloendoprotease, plays a key role in the breakdown of peptides like angiotensin II, endothelin 1 and 2, bombesin-like peptides, substance P, adrenomedullin and natriuretic peptides (Prausmüller et al., Citation2021; Nalivaeva et al., Citation2012).
NEP, which is described as a tumor-specific antigen, CD10 (cluster of differentiation), is implicated in carcinogenesis and tumor microenvironment regulation (Pavo et al., Citation2019). Some known mechanisms of NEP include growth factor degradation, enhancing PTEN activity, promoting apoptosis and inhibiting cancer cell migration (Sankhe et al., Citation2021a). The altered expression of NEP is associated with various tumors including prostate (Albrecht et al., Citation2003), lung (Ganju et al., Citation1994), breast (Smollich et al., Citation2007), cervical (Terauchi et al., Citation2005) and hepatocellular cancers (Uematsu et al., Citation2006). The NEP expression is positively correlated with tumor proliferation and aggressiveness, which highlights its role in tumor biology (Riddell & Vader, Citation2017; Louhichi et al., Citation2018).
The reasons for the downregulation of NEP are hypermethylation of the NEP promoter region and AICD (Amyloid Precursor Protein Intracellular Domain) mediated histone deacetylation. AICD-mediated histone deacetylation is the most significant post-translational modification (PTM) and is characterized by the involvement of histone deacetylase (HDAC) enzyme, which competes with AICD for the NEP promoter region leading to NEP downregulation (Sankhe et al., Citation2021a) and further, these findings are confirmed using chromatin immunoprecipitation studies providing an inverse relationship between HDAC1 and AICD towards NEP promoter region (Belyaev et al., Citation2010). Additionally, studies conducted on prostate cells have shown promising results on AICD, HDAC and NEP relations, as the treatment with HDAC inhibitors like valproic acid and trichostatin A caused an increased NEP expression and protein levels (Hong et al., Citation2012).
The nucleosome, the fundamental unit of chromatin, consists of histones (octamer), mainly one H3/H4 tetramer and two H2A/H2B dimers, and the gene transcription occurs by modifying these nucleosomes (de Ruijter et al., Citation2003). HDACs regulate chromatin remodeling (Ramaiah et al., Citation2021) by removing the acetyl group from the lysine residues, resulting in a denser chromatin structure (Xu et al., Citation2007). Human HDACs consist of 18 isoforms and are categorized as Class I (HDAC 1,2,3 and 8); Class II (Class IIa: HDAC 4,5,7,9 and Class IIb: HDAC 6,10); Class III (Sirtuins SIRT 1–7) and Class IV (HDAC 11) (Melesina et al., Citation2021). Class I HDAC shows widespread tissue expression and is mainly localized in the nucleus (Bondarev et al., Citation2021). HDAC1 and HDAC2 play a vital role in histone deacetylation compared to the rest of HDACs (Ho et al., Citation2020). The correlation of HDAC1 is associated with the pathogenesis of multiple cancers like lung cancer, ovarian cancer, breast cancer, gastric cancer, colorectal cancer, liver cancer and even glioblastoma (Kundu et al., Citation2022) and the expression levels of HDAC1 are increased in GBM (Lo Cascio et al., Citationn.d.). HDAC inhibitors have been shown to upregulate the NEP levels in both the in vitro and in vivo model of Alzheimer by inhibiting the HDAC1 enzyme (Natalia N. Nalivaeva et al., Citation2012).
In this study, we aim to identify HDAC1 inhibitors using in silico drug repurposing approach. For this, the HDAC1 protein structure, without any co-crystallised ligand, was taken from the protein data bank (PDB) and the important amino acid residues considered for HDAC1 protein were Asp99, His140, His141, Phe150, Asp176, His178, Phe205, Asp264, Leu271 and Tyr303 (Choubey & Jeyaraman, Citation2016). The ZINC15 database consisting of 1379 FDA-approved drugs was taken for the repurposing study. The drugs were then screened based on the drug-protein interaction to identify potential HDAC1 inhibitors.
2. Methodology
The molecular docking and simulation studies were done with the help of Schrodinger Maestro software version 11.8. The system used has Linux ubuntu operating system having 4 GB RAM and Intel CORE i3 processor with built-in Haswell graphics.
2.1. Protein Preparation
X-ray crystallographic structure of the protein, HDAC1 (PDB ID: 4BKX) (Millard et al., Citation2013) was downloaded from Research Collaboratory for Structural Bioinformatics (RCSB) PDB. 4BKX with a resolution of 3 A0, consists of two chains A and B, out of which chain B which contains HDAC1 protein was selected. Sulfate, water and acetate were removed and Zn2+ and K+ were retained in the protein structure (Sixto-López et al., Citation2020). Before performing docking studies, the protein was subjected to the 'Protein Preparation Wizard’ of the Schrodinger suite. This wizard helps to identify and remove any defects in the protein structure by incorporating hydrogen atoms, filling missing side chains and allocating bind orders. In this tool, the downloaded protein was put through the following processes—import and refine; review and modify and minimize processes. The missing residues and side chains were filled with the help of the prime tool. The critical active sites were kept untouched in the protein structure. The OPLS3e (Optimised potential for liquid stimulation) force field was used for energy minimization of the protein to create low energy state protein.
2.2. Ligand preparation
The drug repurposing was performed by using 1379 FDA-approved drugs obtained from the ZINC15 database. Here, the Lig-Prep tool was used where pre-processing of all the ligands was done, which included the generation of the tautomers, ionization state at a pH 7.0 ± 2.0 using Epik, hydrogen bond addition, neutralization of charged group and ligand geometry optimisation (Chatterjee et al., Citation2014; Lanka et al., Citation2023; Sankhe et al., Citation2021b).
2.3. Binding site determination and grid generation
As the structure of the protein does not have the co-crystallised ligand, the active binding pockets of the structure were determined with the help of the SiteMap module of the Schrodinger suite. The SiteMap helps to predict the druggable sites and to identify the possible binding pockets on the protein structure. It ranks the binding sites according to the site score obtained after running the module. The Receptor grid generation wizard of the glide module of the Schrodinger suite was further employed to obtain the grid along with the protein using the residues obtained after running SiteMap, which gives a receptor box that spans around the active sites of the protein. The obtained grid was further used for molecular docking studies (Lanka et al., Citation2023).
2.4. Ligand docking
The molecular docking was done with the help of the Ligand Docking module. The FDA-approved drugs that were subjected to the LigPrep tool were selected for conducting the docking studies. The prepared ligands were docked within the grid generated on the prepared protein obtained after performing grid generation based on SiteMap analysis. Initially, all drugs were screened through HTVS (High Throughput Virtual Screening) docking mode. Based on the docking score obtained after performing HTVS docking, the drugs were further screened through SP (Standard Precision) and XP (Extra Precision) docking modes, giving attention to the docking score and the ligand–protein interactions. Finally, after the completion of XP docking, a total of ten molecules were selected as per the docking score and ligand-protein interactions and these selected molecules were tested to MMGBSA (Molecular Mechanics Generalised Born Surface Area) for predicting the binding affinity of these drug candidates (Chatterjee et al., Citation2014; Sankhe et al., Citation2021b).
2.5. Molecular mechanics generalized born surface area (MMGBSA) analysis
To perform the binding free energy (ΔGBinding) of the protein–ligand complex, the Prime MM-GBSA module is employed. It integrates molecular mechanics and solvation model calculations with a continuous system for obtaining the binding free energy of the ligand-protein complex and is calculated using the equation given below.
ΔGBinding, ΔGreceptor and ΔGligand denotes total binding energy of the complex, free receptor and unbound ligand, respectively (Lanka et al., Citation2023). The strength of the protein–ligand complex increases with the increase in the negative value of the binding free energy of the complex (Holderbach et al., Citation2020).
2.6. ADME (absorption, distribution, metabolism and excretion) properties prediction
ADME plays a crucial role in evaluating the drug-like properties of the identified molecules in the drug development process. The properties like Log P, hydrogen bond donor, hydrogen bond acceptor, polar Surface area, Blood–brain barrier permeability and GI absorption predictions for the selected ten compounds were performed with the help of the SwissADME tool, a free web tool for predicting the ADME properties of the drug molecules (Daina et al., Citation2017).
2.7. Molecular dynamics (MD) simulation and post-MD MMGBSA analysis
To comprehend the interactions of the selected ten drug molecules with the HDAC1 protein, MD simulations were performed using the Desmond module of the Schrodinger suite. Initially, the drug-4BKX protein complex was subjected to a system builder module where the complex is made suitable for simulation by solvating in the predefined SPC solvent under orthorhombic boundary conditions. Further, these solvated complexes were subjected to energy minimization until they reached a gradient threshold of 25 kcal/mol/A0 balanced at 300 K temperature and 1 bar pressure. Finally, the prepared system was subjected to MD simulation for 100 ns. All the simulations were performed using the Desmond module (Lanka et al., Citation2023; Sankhe et al., Citation2021b). After MD simulations, thermal MMGBSA was performed using the script thermal_mmgbsa.py with every 10th frame of 100 ns MD simulation trajectory to calculate the dG binding energy (Balaji E et al., Citation2023).
2.8. Cell lines
U87 MG (human origin) and C6 (rat origin) glioblastoma cells were purchased from the National Centre for Cell Science (NCCS), Pune, India. The cells were cultured in Dulbecco’s Modified Eagle Medium (DMEM, Gibco) containing 10% Fetal Bovine Serum (FBS, Gibco), 100 units/ml penicillin, 50 μg/ml streptomycin and 100 μg/ml amphotericin (Invitrogen), in 25 cm2 flasks at 37° C, in a humidified incubator having 5% CO2.
2.8.1. Cytotoxicity studies
The cytotoxicity of the selected drug molecules in both cell lines was determined using Sulforhodamine B (SRB) assay (Vichai & Kirtikara, Citation2006). Briefly, the cells were trypsinised at 70–80% confluency and seeded in 96 well plates, at 5000 cells per well in the respective media and incubated for 24 hrs for cell attachment. 24 hrs later, the media was removed, and the cells were treated with different concentrations of Panobinostat (195.35 to 1.522 nM), Melphalan (2000 to 7.812 μM), Tasimelteon (6000 to 46.87 μM) and Temozolomide (8000 to 62.5 μM). The plates were incubated for 48 hrs. After 48 hrs, the media was removed and the cells were fixed using 10% Trichloroacetic acid (TCA) for 1 hr, then washed three times with water. The cells were then stained with SRB and incubated for half an hour followed by washing with acetic acid and adding tris solution. Finally, the absorbance was measured at 540 nm using a microplate reader (Elx800, BioTek). Additionally, the current therapeutic drug for glioblastoma- Temozolomide, was also used for comparison of the efficacy of the test compounds.
2.9. Western blot analysis
The U-87 MG and C6 cells were seeded in 6 well plates at a density of 1 × 10⁶ cells per well. After 24 hrs, treatment with IC10 and IC30 doses of the selected drugs and the standard drug—temozolomide for comparison, and incubated for 48 hrs. The cells were then washed with ice-cold PBS and then scrapped with radioimmunoprecipitation assay (RIPA) buffer having protease and phosphatase inhibitors and centrifuged to obtain the supernatant. The total protein content of the cells was determined by bicinchoninic acid (BCA) method (QPRO-BCA kit, Cyangen). 20 µg of 20 µl of protein from each group were heated at 95 °C for 5 min and were separated by 10% Tris-HCl SDS PAGE (Sodium dodecyl sulphate—Polyacrylamide gel) electrophoresis by applying 50 V, until the samples were properly resolved and further transferred to PVDF membrane (Cytivia) by applying 90 V for 2 hrs. Afterwards, the membrane was blocked in 5% bovine serum albumin (BSA) in wash buffer (tris buffered saline having tween 20, TBST) for 2 hrs at room temperature. Subsequently, membranes were incubated with HDAC1 (1:1000) polyclonal antibody having α-tubulin (1:1000) as the reference protein (Elabscience Biotechnology Inc.) and kept overnight at 40C. Further, membranes were washed 2 times with TBST followed by incubation with goat anti-rabbit IgG conjugated with horseradish peroxidase (1:10000) (Invitrogen) for 2 hrs at room temperature. Again, washed 3 times with TBST and detected using a chemiluminescent HRP substrate (Takara Bio Inc.). The quantification of the bands was done by using Image J software (Pulya et al., Citation2022).
2.10. Statistical analysis
All the results are expressed as Mean ± SEM, and the analysis was carried out using GraphPad Prism version 8.0.2 for windows. All the experiments were conducted in triplicates. One-way ANOVA followed by the Tukey test was used for western blot analysis.
3. Results
3.1. molecular docking
The FDA-approved drug molecules downloaded from the ZINC15 database were initially docked with HDAC1 protein within the grid, selected based on the top score using the SiteMap module through HTVS docking mode. The SiteMap generated 5 druggable binding sites, among which site 1 with sitecore of 0.8981 was selected that had amino acids Asp99, His140, His141, Phe150, Asp176, His178, Phe205, Asp264, Leu271 and Tyr303 as per our literature survey. A cut-off docking score of −5 was chosen for the HTVS docking, and the molecules having a docking score above −5 were then selected for SP docking. After SP docking, molecules with a docking score above −5 were selected for XP docking. After XP docking, MMGBSA was also carried out to understand the binding affinity of the shortlisted drug candidates and the MMGBSA(Kcal/mol) values are depicted in . After screening of drugs through HTVS, SP and XP docking modes, it yielded a total of 10 drugs from a total of 1379 FDA-approved drugs taken from the ZINC15 database, with the docking score ranging from −10.558 to −7.305 (Kcal/mol), which are listed in . The selected drug molecules also showed good interactions with the reported critical amino acids for HDAC1 inhibition. The three drugs- ZINC22010649, ZINC3818726 and ZINC4392649 showed bonding and non-bonding interaction with all the crucial amino acids like Asp99, His140, His141, Phe150, Asp176, His178, Phe205, Asp264, Leu271 and Tyr303. All the selected drugs except ZINC2272 showed hydrophobic interaction with TYR303. All 10 drugs showed different bonding and non-bonding interaction which are depicted in .
Table 1. List of drugs from the ZINC15 database with docking score and binding energy scores.
Table 2. Ligand interaction diagram of the selected ten drugs after XP docking.
3.2. ADME properties prediction
SwissADME tool was employed to analyse the pharmacokinetic and pharmacodynamic properties of the ten selected compounds. The selected ten compounds were checked for Lipinski’s rule of five, Polar surface area (PSA), Blood-brain barrier (BBB) penetrability, and GI (Gastrointestinal) absorption and the obtained results are listed in . All ten drugs except Telmisartan, Lapatinib and Candesartan followed the Lipinski rule of five. All the selected drugs excluding Telmisartan, Lapatinib and Candesartan showed high Gastrointestinal absorption (). From the ten drugs, based on the drug-protein interaction and ADME properties like BBB penetrability, a total of 4 drugs were filtered out that were Panobinostat, Tasimelteon, Melphalan and Ketoprofen. These four drugs were then subjected to induced fit docking and molecular dynamics simulation studies.
Table 3. Predicted ADME properties of the selected drugs using the SwissADME tool.
3.3. MD simulation studies
The MD studies were performed to learn the activity of drugs based on binding stability and non-binding interaction with the vital amino acid residues. The simulations were carried out for the top four molecules based on the docking score, binding energy, and ADME properties. Of the four drugs, three (Panobinostat, Tasimelteon and Melphalan) showed good interaction and stability, whereas Ketoprofen showed poor interaction with the HDAC1 protein. The drug-protein complexes which showed good interaction and stability were Panobinostat-HDAC1 (Complex 1), Tasimelteon-HDAC1 (Complex 2) and Melphalan-HDAC1 (Complex 3). The ketoprofen-HDAC1 (Complex 4) showed poor stability and interaction during the MD.
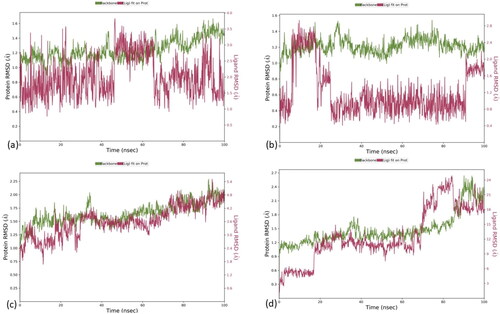
For Complex 1, the RMSD values for the ligand and protein were 1.5 A0 and 3.5 A0, respectively, but drift was observed at 0–4 ns and 70–100 ns. The RMSD values for the Complex 2 were 1.8 A0 and 2.4 A0 for the ligand and protein, respectively. The complex showed an initial drift of 0–5 ns, stabilization of 5–20 ns, and a drift of 20–100 ns. In Complex 3, the RMSD value was 5.4 A0 and 4.8 A0, the protein and ligand, respectively. The complex showed an initial drift from 5–15 ns but afterwards stabilized from 15 to 100 ns. For Complex 4, the ligand and the protein complex were unstable throughout the 100 ns simulation time. The RMSD of the ligand-protein complexes is shown in .
Figure 1. RMSD plot of ligand-protein complexes. RMSD of (a) Panobinostat (b) Tasimelteon and (c) Melphalan and (d) Ketoprofen with the active site of HDAC1 protein.
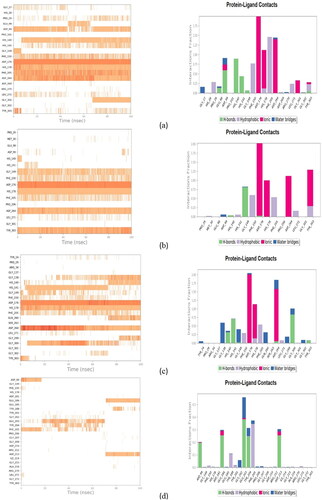
After MD simulations, the non-bonding interactions for the selected drug molecules were analyzed. In the case of Panobinostat, the ligand was found to be in the protein’s binding pocket and showed stable interaction of HIS178, ASP264, ASP176 and GLY301 with Zn (Zinc). It showed H-bond interaction with HIS140, HIS141 and ASP99. A new Pi-Pi cation interaction was seen with PHE205 while Pi-Pi stacking with the PHE205 was retained. After the MD simulation, Pi-Pi stacking interaction with PHE150 was missing. Tasimelteon was found to be in the protein’s binding pocket and showed good interaction of TYR303, ASP176, HIS178 and ASP264 with Zn. It showed H-bond interaction with GLY149, while H-bond and Pi-Pi stacking interaction with HIS141 was missing after the MD simulation. In the case of Melphalan, the drug showed H-bonds with HIS140, HIS141 and GLY300. ASP264, HIS178 and ASP176 showed metal coordination with Zn metal. In the case of Ketoprofen, the drug showed H-bonds with ASP99, HIS178 and PHE205. It showed Pi-Pi stacking interaction with HIS178 and Pi-cation interaction with PHE150 and HIS141. The MMGBSA dG bind was done for the entire simulation at every 10th frame. The average binding energy scores obtained for Panobinostat, Tasimelteon, Melphalan and Ketoprofen were −49.50 Kcal/mol,-39.95 Kcal/mol, −31.81 Kcal/mol and −40.47 Kcal/mol, respectively. Among the four drugs, Panobinostat showed better scores than the rest of the drugs (). The ligand-protein MD interaction diagram and the contacts of molecules with the residues of HDAC1 protein in each trajectory frame are shown in and , respectively.
Figure 2. MMGBSA of drug ligand complexes.
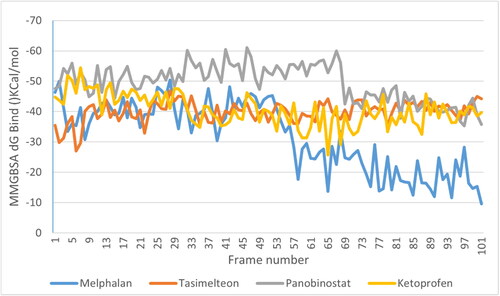
Figure 3. Ligand-Protein interaction diagram after MD of (a) Panobinostat (b) Tasimelteon and (c) Melphalan and (d) Ketoprofen with the HDAC1 protein.
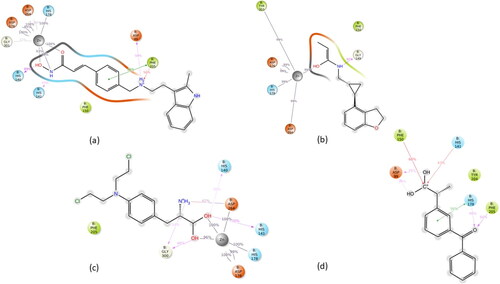
Figure 4. Ligand-protein contacts of (a) Panobinostat (b) Tasimelteon (c) Melphalan and (d) Ketoprofen throughout 100 ns time frame with HDAC1 protein.
3.4. cytotoxicity studies
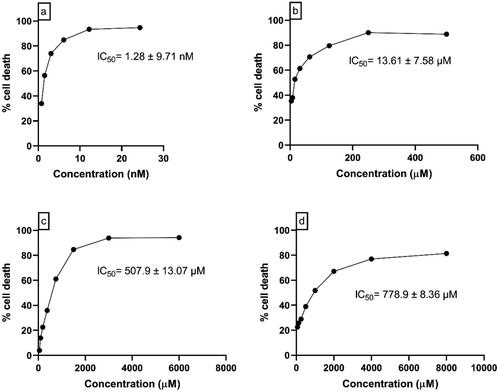
In U87 MG cells, 48 hrs of incubation with Panobinostat (195.35 to 1.522 nM), Melphalan (2000 to 7.812 μM), Tasimelteon (6000 to 46.87 μM) and Temozolomide (8000 to 62.5 μM) showed the IC50 values of 100.8 nM ± 3.75, 505.8 μM ± 9.92, 1082 μM ± 11.20 and 2033.1 μM ± 8.32, respectively. In C6 Glioblastoma cells, the drugs—Panobinostat (48.75 to 0.38 nM), Melphalan (500 to 3.9 μM), Tasimelteon (600 to 46.87 μM) and Temozolomide (8000 to 62.5 μM) showed IC50 values of 1.28 nM ± 9.71, 13.61 μM ± 7.58, 507.9 μM ± 13.07 and 778.9 μM ± 8.36, respectively. The concentration vs percentage cell death graph in U87 MG and C6 glial cells are shown in and , respectively.
Figure 5. Concentration vs Percentage cell death graph of (a) Panobinostat (b) Melphalan (c) Tasimelteon (d) Temozolomide in U87 MG cells.
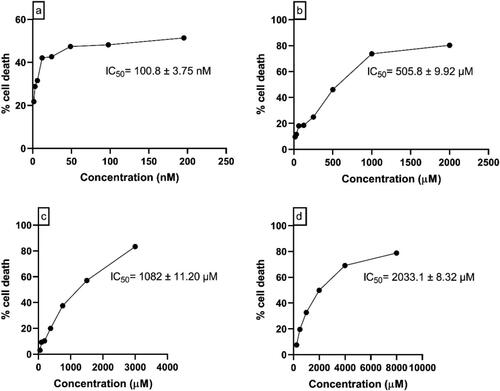
Figure 6. Concentration vs Percentage cell death graph of (a) Panobinostat (b) Melphalan (c) Tasimelteon (d) Temozolomide in C6 glial cells.
3.5. Western blot analysis
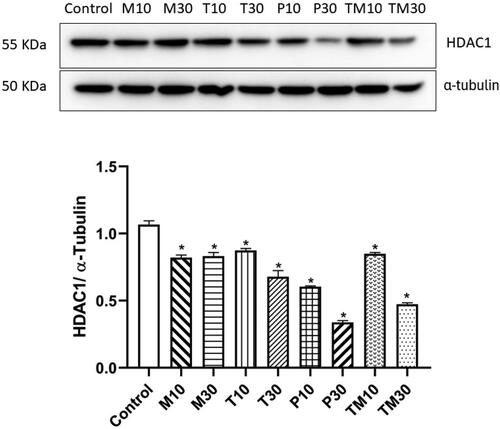
U-87 MG and C6 cells were treated with the IC10 and IC30 doses of Melphalan, Tasimelteon, Panobinostat and Temozolomide, and the levels of HDAC1 protein were estimated using western blot analysis. In U87 MG cells, the IC10 and IC30 doses were Melphalan (M10–54.30 μM and M30–213.91 μM), Tasimelteon (T10–195.97 μM and T30–559.86 μM), Panobinostat (P10–0.018 nM and P30–3.63 nM) and Temozolomide (TM10–288.85 μM and TM30–957.93 μM). All the drugs- Melphalan (M10–p < 0.01, 0.8528 ± 0.04960, M30–p < 0.01, 0.8361 ± 0.03012) Tasimelteon (T10–p < 0.01, 0.8583 ± 0.02006, T30–p < 0.01, 0.6529 ± 0.04446), Panobinostat (P10–p < 0.01, 0.5918 ± 0.007483, P30–p < 0.01, 0.3318 ± 0.01988) and Temozolomide (TM10–p < 0.01, 0.8318 ± 0.06801, TM30–p < 0.01, 0.4689 ± 0.008362) showed significant decrease in HDAC1 levels compared to the untreated control group ().
Figure 7. Representative image of western blot analysis of HDAC1 protein in U87 MG cells and relative density ratio of HDAC1/α-tubulin. The values are represented as mean ± SEM, where *p < 0.01 vs control group (n = 3). 10 and 30 represent the IC10 and IC30 doses of M–Melphalan, T–Tasimelteon, P–Panobinostat and TM–Temozolomide, respectively.
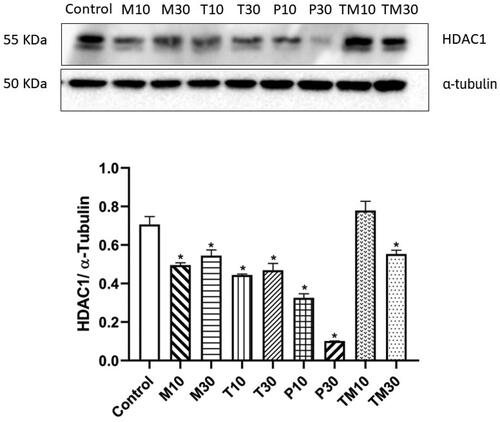
In C6 cells, the IC10 and IC30 doses were Melphalan (M10–0.38 μM and M30–3.44 μM), Tasimelteon (T10–98.18 μM and T30–269.49 μM), Panobinostat (P10–0.19 nM and P30–0.61 nM) and Temozolomide (TM10–24.74 μM and TM30–205.97 μM). In C6 glial cells, both the doses of the three test drugs (M10–p < 0.01, 0.4628 ± 0.03055, M30–p < 0.01, 0.5080 ± 0.05254, T10–p < 0.01, 0.4548 ± 0.04846, T30–p < 0.01, 0.4787 ± 0.01993, P10–p < 0.01, 0.3302 ± 0.01179 and P30–p < 0.01, 0.07754 ± 0.01060) and the higher dose of the standard, Temozolomide (T30–p < 0.01, 0.6315 ± 0.004914), exhibited reduction in the levels of HDAC1 protein. ().
Figure 8. Representative image of western blot analysis of HDAC1 protein in C6 glial cells and relative density ratio of HDAC1/α-tubulin. The values are represented as mean ± SEM, where *p < 0.01 vs control group (n = 3). 10 and 30 represent the IC10 and IC30 doses of M- Melphalan, T- Tasimelteon, P- Panobinostat and TM- Temozolomide, respectively.
4. Discussion
The overexpression of HDAC1 in glioblastoma may result in NEP enzyme’s downregulation. Therefore, inhibition of HDAC1 could result in the upregulation of NEP, which could be a better strategy against glioblastoma.
HDACs are the class of enzymes that are associated with transcriptional repression through chromatin compaction. The HDAC1 knockdown has shown significant effects in a p53-dependent manner on glioma stem cell phenotype (Lo Cascio et al., n.d.). Studies have proven that HDAC1 levels are elevated in glioblastoma and silencing HDAC1 gene results in the suppression of cancer cell proliferation and migration (Zhang et al., Citation2021).
In the current study, in silico computational approach was employed to identify HDAC1 inhibitors for glioblastoma. Molecular docking, MMGBSA, and molecular dynamics studies indicated that the three compounds- Panobinostat, Melphalan and Tasimelteon could be good agents for targeting HDAC1 protein. The selected molecules showed good interactions with the critical amino acids required for HDAC1 inhibition. In vitro cytotoxicity of these compounds was performed in U87 MG and C6 glial cells to determine the IC50 values, and later, the effects of these molecules (IC10 and IC30 doses) on HDAC1 levels were analyzed using western blot. The results were compared with the existing standard drug for glioblastoma, Temozolomide.
In in vitro cytotoxicity studies, all the drugs exhibited potent cytotoxicity against the glioma cells. Among the three selected molecules, Panobinostat exhibited potent cytotoxic action in the nanomolar range in both the cell lines. While estimating the levels of HDAC1, as anticipated, the levels of the protein was elevated in the untreated, control groups of both U87 MG and C6 cells. All the tested drugs Panobinostat, Melphalan, Tasimelteon and Temozolomide showed significant reduction in HADC1 levels, with Panobinostat exhibiting the maximum effect.
Panobinostat is an FDA-approved drug for multiple myeloma. It is a pan-HDAC inhibitor, with IC50 values in the nanomolar range, and having high potency against all HDACs (Laubach et al., Citation2015). In preclinical studies, Panobinostat has shown good results via inducing apoptosis, generation of reactive oxygen species, inhibition of angiogenesis and autophagic cell death in the GBM model (Meng et al., Citation2019). Tasimelteon is a melatonin receptor agonist, shows action towards MT1 and MT2 melatonergic receptors and is approved for non-24-h sleep-wake disorder (Kim & Yang, Citation2022). No previous studies have been reported explaining the role of Tasimelteon in glioblastoma. So our study is an attempt to understand the role of Tasimelteon on HDAC1 inhibition. Melphalan and Temozolomide belong to the class of alkylating agents where Temozolomide is the standard drug for glioblastoma therapy. Studies conducted using the alkylating agents over HDACs have been reported to show synergistic activity with HDAC inhibitors as alkylating agents downregulated HDAC3 levels in HBL-2 cells (Hiraoka et al., Citation2013). Furthermore, alkylating agents have been shown to suppress the histone synthesis causing a reduced histone/DNA ratio in a dose-dependent manner (Grunicke et al., Citation1984).
5. Conclusion
The current therapy for glioblastoma consists of Temozolomide, in addition to radiation therapy. However, the increased cases of temozolomide resistance necessitate the development of new drug molecules for glioblastoma. The role of histone deacetylases in cancer progression has been reported, and the identification of HDAC1 inhibitors could benefit glioblastoma therapy. In this study, we have identified Panobinostat, Melphalan and Tasimelteon from the ZINC 15 database, which have high affinity for the critical amino acids of HDAC1 protein, needed for its inhibition. The selection of molecules was based on the docking score, MMGBSA, ADME properties and drug–protein interactions. These interactions were supported by the MD studies performed at 100 ns. Additionally, the selected drugs were investigated for cytotoxicity and their action on HDAC1 protein in U87 MG and C6 glial cells. We found that the selected drug molecules significantly reduced the HDAC1 protein levels in the in vitro analysis.
Furthermore, in vivo studies are warranted to determine the inhibitory effect of the selected drugs towards the HDAC1 inhibition, the elevation of NEP levels and ultimately the suppression of glioblastoma.
Authors’ contributions
AG—Conceptualization, in silico modelling, analysis, interpretation, and original draft preparation
RS—In silico modelling, interpretation, data curation and editing.
ER—In silico modelling, interpretation and editing.
TK—Data interpretation, curation and reviewing.
RU—Data interpretation, curation and reviewing.
KSRP—Data interpretation, curation and reviewing.
AK—Conceptualization, supervision, reviewing and editing the manuscript.
Acknowledgements
The authors thank Indian Council of Medical Education (ICMR) for providing the grant (File No. 58/13/2020/PHA/BMS) necessary to perform the studies. The authors are also thankful to Manipal-Schrödinger Centre for Molecular Simulations, Manipal College of Pharmaceutical Sciences and Manipal Academy of Higher Education (MAHE), Manipal, India, for providing all the necessary facilities to carry out the study.
Disclosure statement
The authors report there are no competing interests to declare.
Additional information
Funding
References
- Akmal, M., Hasnain, N., Rehan, A., Iqbal, U., Hashmi, S., Fatima, K., Farooq, M. Z., Khosa, F., Siddiqi, J., & Khan, M. K. (2020). Glioblastome multiforme: A bibliometric analysis. World Neurosurgery, 136, 270–282. https://doi.org/10.1016/j.wneu.2020.01.027
- Albrecht, M., Mittler, A., Wilhelm, B., Lundwall, Å., Lilja, H., Aumüller, G., & Bjartell, A. (2003). Expression and immunolocalisation of neutral endopeptidase in prostate cancer. European Urology, 44(4), 415–422. https://doi.org/10.1016/S0302-2838(03)00322-1
- Balaji E, V., Satarker, S., Kumar, B. H., Pandey, S., Birangal, S. R., Nayak, U. Y., & Pai, K. S. R. (2023). In-silico lead identification of the pan-mutant IDH1 and IDH2 inhibitors to target glioblastoma. Journal of Biomolecular Structure & Dynamics, 42(7), 3764–3789. https://doi.org/10.1080/07391102.2023.2215884
- Belyaev, N. D., Kellett, K. A. B., Beckett, C., Makova, N. Z., Revett, T. J., Nalivaeva, N. N., Hooper, N. M., & Turner, A. J. (2010). The transcriptionally active amyloid precursor protein (APP) intracellular domain is preferentially produced from the 695 isoform of APP in a β-secretase-dependent pathway*. The Journal of Biological Chemistry, 285(53), 41443–41454. https://doi.org/10.1074/jbc.M110.141390
- Bondarev, A. D., Attwood, M. M., Jonsson, J., Chubarev, V. N., Tarasov, V. V., & Schiöth, H. B. (2021). Recent developments of HDAC inhibitors: Emerging indications and novel molecules. British Journal of Clinical Pharmacology, 87(12), 4577–4597. https://doi.org/10.1111/bcp.14889
- Carlsson, S. K., Brothers, S. P., & Wahlestedt, C. (2014). Emerging treatment strategies for glioblastoma multiforme. EMBO Molecular Medicine, 6(11), 1359–1370. https://doi.org/10.15252/emmm.201302627
- Chatterjee, A., Cutler, S. J., Doerksen, R. J., Khan, I. A., & Williamson, J. S. (2014). Discovery of thienoquinolone derivatives as selective and ATP non-competitive CDK5/p25 inhibitors by structure-based virtual screening. Bioorganic & Medicinal Chemistry, 22(22), 6409–6421. https://doi.org/10.1016/j.bmc.2014.09.043
- Choubey, S. K., & Jeyaraman, J. (2016). A mechanistic approach to explore novel HDAC1 inhibitor using pharmacophore modeling, 3D- QSAR analysis, molecular docking, density functional and molecular dynamics simulation study. Journal of Molecular Graphics & Modelling, 70, 54–69. https://doi.org/10.1016/j.jmgm.2016.09.008
- Daina, A., Michielin, O., & Zoete, V. (2017). SwissADME: A free web tool to evaluate pharmacokinetics, drug-likeness and medicinal chemistry friendliness of small molecules. Scientific Reports, 7(1), 42717. https://doi.org/10.1038/srep42717
- de Ruijter, A. J. M., van Gennip, A. H., Caron, H. N., Kemp, S., & van Kuilenburg, A. B. P. (2003). Histone deacetylases (HDACs): Characterization of the classical HDAC family. The Biochemical Journal, 370(Pt 3), 737–749. https://doi.org/10.1042/BJ20021321
- Ganju, R. K., Sunday, M., Tsarwhas, D. G., Card, A., & Shipp, M. A. (1994). CD10/NEP in non-small cell lung carcinomas. Relationship to cellular proliferation. The Journal of Clinical Investigation, 94(5), 1784–1791. https://doi.org/10.1172/JCI117526
- Grunicke, H., Zwierzina, H., Loidl, A., Helliger, W., & Puschendorf, B. (1984). Alkylating antitumour agents decrease histone acetylation in Ehrlich-Ascites tumour cells. In Cancer Chemotherapy and Selective Drug Development. Springer. pp. 413–417. https://doi.org/10.1007/978-1-4613-3837-6_62
- Hiraoka, N., Kikuchi, J., Koyama, D., Wada, T., Mori, S., Nakamura, Y., & Furukawa, Y. (2013). Alkylating agents induce histone H3K18 hyperacetylation and potentiate HDAC inhibitor-mediated global histone acetylation and cytotoxicity in mantle cell lymphoma. Blood Cancer Journal, 3(12), e169. https://doi.org/10.1038/bcj.2013.66
- Ho, T. C. S., Chan, A. H. Y., & Ganesan, A. (2020). Thirty years of HDAC inhibitors: 2020 insight and hindsight. Journal of Medicinal Chemistry, 63(21), 12460–12484. https://doi.org/10.1021/acs.jmedchem.0c00830
- Holderbach, S., Adam, L., Jayaram, B., Wade, R. C., & Mukherjee, G. (2020). RASPD+: Fast protein-ligand binding free energy prediction using simplified physicochemical features. Frontiers in Molecular Biosciences, 7, 601065. https://doi.org/10.3389/fmolb.2020.601065
- Hong, Y., Beckett, C., Belyaev, N. D., & Turner, A. J. (2012). The impact of amyloid precursor protein signalling and histone deacetylase inhibition on neprilysin expression in human prostate cells. International Journal of Cancer, 130(4), 775–786. https://doi.org/10.1002/ijc.26028
- Janjua, T. I., Rewatkar, P., Ahmed-Cox, A., Saeed, I., Mansfeld, F. M., Kulshreshtha, R., Kumeria, T., Ziegler, D. S., Kavallaris, M., Mazzieri, R., & Popat, A. (2021). Frontiers in the treatment of glioblastoma: Past, present and emerging. Advanced Drug Delivery Reviews, 171, 108–138. https://doi.org/10.1016/j.addr.2021.01.012
- Kim, H. K., & Yang, K. I. (2022). Melatonin and melatonergic drugs in sleep disorders. Translational and Clinical Pharmacology, 30(4), 163–171. https://doi.org/10.12793/tcp.2022.30.e21
- Kundu, R., Banerjee, S., Baidya, S. K., Adhikari, N., & Jha, T. (2022). A quantitative structural analysis of AR-42 derivatives as HDAC1 inhibitors for the identification of promising structural contributors. SAR and QSAR in Environmental Research, 33(11), 861–883. https://doi.org/10.1080/1062936X.2022.2145353
- Lah, T. T., Novak, M., & Breznik, B. (2020). Brain malignancies: Glioblastoma and brain metastases. Seminars in Cancer Biology, 60, 262–273. https://doi.org/10.1016/j.semcancer.2019.10.010
- Lanka, G., Begum, D., Banerjee, S., Adhikari, N., P, Y., & Ghosh, B. (2023). Pharmacophore-based virtual screening, 3D QSAR, Docking, ADMET, and MD simulation studies: An in silico perspective for the identification of new potential HDAC3 inhibitors. Computers in Biology and Medicine, 166, 107481. https://doi.org/10.1016/j.compbiomed.2023.107481
- Laubach, J. P., Moreau, P., San-Miguel, J. F., & Richardson, P. G. (2015). Panobinostat for the treatment of multiple myeloma. Clinical Cancer Research: An Official Journal of the American Association for Cancer Research, 21(21), 4767–4773. https://doi.org/10.1158/1078-0432.CCR-15-0530
- Lo Cascio, C., McNamara, J. B., Melendez, E. L., Lewis, E. M., Dufault, M. E., Sanai, N., Plaisier, C. L., & Mehta, S. (n.d). Nonredundant, isoform-specific roles of HDAC1 in glioma stem cells. JCI Insight, 6(17), e149232. https://doi.org/10.1172/jci.insight.149232
- Louhichi, T., Saad, H., Dhiab, M. B., Ziadi, S., & Trimeche, M. (2018). Stromal CD10 expression in breast cancer correlates with tumor invasion and cancer stem cell phenotype. BMC Cancer, 18(1), 49. https://doi.org/10.1186/s12885-017-3951-8
- Melesina, J., Simoben, C. V., Praetorius, L., Bülbül, E. F., Robaa, D., & Sippl, W. (2021). Strategies To Design Selective Histone Deacetylase Inhibitors. ChemMedChem, 16(9), 1336–1359. https://doi.org/10.1002/cmdc.202000934
- Meng, W., Wang, B., Mao, W., Wang, J., Zhao, Y., Li, Q., Zhang, C., & Ma, J. (2019). Enhanced efficacy of histone deacetylase inhibitor panobinostat combined with dual PI3K/mTOR inhibitor BEZ235 against glioblastoma. Nagoya Journal of Medical Science, 81, 93–102. https://doi.org/10.18999/nagjms.81.1.93
- Millard, C. J., Watson, P. J., Celardo, I., Gordiyenko, Y., Cowley, S. M., Robinson, C. V., Fairall, L., & Schwabe, J. W. R. (2013). Class I HDACs share a common mechanism of regulation by inositol phosphates. Molecular Cell, 51(1), 57–67. https://doi.org/10.1016/j.molcel.2013.05.020
- Minniti, G., Niyazi, M., Alongi, F., Navarria, P., & Belka, C. (2021). Current status and recent advances in reirradiation of glioblastoma. Radiation Oncology, 16(1), 36. https://doi.org/10.1186/s13014-021-01767-9
- Nalivaeva, N. N., Belyaev, N. D., Lewis, D. I., Pickles, A. R., Makova, N. Z., Bagrova, D. I., Dubrovskaya, N. M., Plesneva, S. A., Zhuravin, I. A., & Turner, A. J. (2012). Effect of sodium valproate administration on brain Neprilysin expression and memory in rats. Journal of Molecular Neuroscience: MN, 46(3), 569–577. https://doi.org/10.1007/s12031-011-9644-x
- Nalivaeva, N. N., Belyaev, N. D., Zhuravin, I. A., & Turner, A. J. (2012). The Alzheimer’s amyloid-degrading peptidase, Neprilysin: Can we control it? International Journal of Alzheimer’s Disease, 2012, e383796. https://doi.org/10.1155/2012/383796
- Pavo, N., Arfsten, H., Cho, A., Goliasch, G., Bartko, P. E., Wurm, R., Freitag, C., Gisslinger, H., Kornek, G., Strunk, G., Raderer, M., Zielinski, C., & Hülsmann, M. (2019). The circulating form of neprilysin is not a general biomarker for overall survival in treatment-naïve cancer patients. Scientific Reports, 9(1), 2554. https://doi.org/10.1038/s41598-019-38867-2
- Perrin, S. L., Samuel, M. S., Koszyca, B., Brown, M. P., Ebert, L. M., Oksdath, M., & Gomez, G. A. (2019). Glioblastoma heterogeneity and the tumour microenvironment: Implications for preclinical research and development of new treatments. Biochemical Society Transactions, 47(2), 625–638. https://doi.org/10.1042/BST20180444
- Prausmüller, S., Spinka, G., Arfsten, H., Stasek, S., Rettl, R., Bartko, P. E., Goliasch, G., Strunk, G., Riebandt, J., Mascherbauer, J., Bonderman, D., Hengstenberg, C., Hülsmann, M., & Pavo, N. (2021). Relevance of neutrophil Neprilysin in heart failure. Cells, 10(11), 2922. https://doi.org/10.3390/cells10112922
- Pulya, S., Patel, T., Paul, M., Adhikari, N., Banerjee, S., Routholla, G., Biswas, S., Jha, T., & Ghosh, B. (2022). Selective inhibition of histone deacetylase 3 by novel hydrazide based small molecules as therapeutic intervention for the treatment of cancer. European Journal of Medicinal Chemistry, 238, 114470. https://doi.org/10.1016/j.ejmech.2022.114470
- Ramaiah, M. J., Tangutur, A. D., & Manyam, R. R. (2021). Epigenetic modulation and understanding of HDAC inhibitors in cancer therapy. Life Sciences, 277, 119504. https://doi.org/10.1016/j.lfs.2021.119504
- Riddell, E., & Vader, J. M. (2017). Potential expanded indications for Neprilysin inhibitors. Current Heart Failure Reports, 14(2), 134–145. https://doi.org/10.1007/s11897-017-0327-y
- Sankhe, R., Pai, S. R. K., & Kishore, A. (2021a). Tumour suppression through modulation of neprilysin signaling: A comprehensive review. European Journal of Pharmacology, 891, 173727. https://doi.org/10.1016/j.ejphar.2020.173727
- Sankhe, R., Rathi, E., Manandhar, S., Kumar, A., Pai, S. R. K., Kini, S. G., & Kishore, A. (2021b). Repurposing of existing FDA approved drugs for Neprilysin inhibition: An in-silico study. Journal of Molecular Structure, 1224, 129073. https://doi.org/10.1016/j.molstruc.2020.129073
- Sasmita, A. O., Wong, Y. P., & Ling, A. P. K. (2018). Biomarkers and therapeutic advances in glioblastoma multiforme. Asia-Pacific Journal of Clinical Oncology, 14(1), 40–51. https://doi.org/10.1111/ajco.12756
- Silantyev, A. S., Falzone, L., Libra, M., Gurina, O. I., Kardashova, K., Sh, Nikolouzakis, T. K., Nosyrev, A. E., Sutton, C. W., Mitsias, P. D., & Tsatsakis, A. (2019). Current and future trends on diagnosis and prognosis of glioblastoma: from molecular biology to proteomics. Cells, 8(8), 863. https://doi.org/10.3390/cells8080863
- Sixto-López, Y., Gómez-Vidal, J. A., de Pedro, N., Bello, M., Rosales-Hernández, M. C., & Correa-Basurto, J. (2020). Hydroxamic acid derivatives as HDAC1, HDAC6 and HDAC8 inhibitors with antiproliferative activity in cancer cell lines. Scientific Reports, 10(1), 10462. https://doi.org/10.1038/s41598-020-67112-4
- Smollich, M., Götte, M., Yip, G. W., Yong, E.-S., Kersting, C., Fischgräbe, J., Radke, I., Kiesel, L., & Wülfing, P. (2007). On the role of endothelin-converting enzyme-1 (ECE-1) and neprilysin in human breast cancer. Breast Cancer Research and Treatment, 106(3), 361–369. https://doi.org/10.1007/s10549-007-9516-9
- Terauchi, M., Kajiyama, H., Shibata, K., Ino, K., Mizutani, S., & Kikkawa, F. (2005). Anti-progressive effect of neutral endopeptidase 24.11 (NEP/CD10) on cervical carcinoma in vitro and in vivo. Oncology, 69(1), 52–62. https://doi.org/10.1159/000087476
- Thakkar, J. P., Dolecek, T. A., Horbinski, C., Ostrom, Q. T., Lightner, D. D., Barnholtz-Sloan, J. S., & Villano, J. L. (2014). Epidemiologic and molecular prognostic review of glioblastoma. Cancer Epidemiology, Biomarkers & Prevention: A Publication of the American Association for Cancer Research, Cosponsored by the American Society of Preventive Oncology, 23(10), 1985–1996. https://doi.org/10.1158/1055-9965.EPI-14-0275
- Torp, S. H., Solheim, O., & Skjulsvik, A. J. (2022). The WHO 2021 Classification of Central Nervous System tumours: A practical update on what neurosurgeons need to know—A minireview. Acta Neurochirurgica, 164(9), 2453–2464. https://doi.org/10.1007/s00701-022-05301-y
- Uematsu, F., Takahashi, M., Yoshida, M., Igarashi, M., & Nakae, D. (2006). Methylation of neutral endopeptidase 24.11 promoter in rat hepatocellular carcinoma. Cancer Science, 97(7), 611–617. https://doi.org/10.1111/j.1349-7006.2006.00227.x
- van Tellingen, O., Yetkin-Arik, B., de Gooijer, M. C., Wesseling, P., Wurdinger, T., & de Vries, H. E. (2015). Overcoming the blood–brain tumor barrier for effective glioblastoma treatment. Drug Resistance Updates: Reviews and Commentaries in Antimicrobial and Anticancer Chemotherapy, 19, 1–12. https://doi.org/10.1016/j.drup.2015.02.002
- Vichai, V., & Kirtikara, K. (2006). Sulforhodamine B colorimetric assay for cytotoxicity screening. Nature Protocols, 1(3), 1112–1116. https://doi.org/10.1038/nprot.2006.179
- Xu, W. S., Parmigiani, R. B., & Marks, P. A. (2007). Histone deacetylase inhibitors: Molecular mechanisms of action. Oncogene, 26(37), 5541–5552. https://doi.org/10.1038/sj.onc.1210620
- Yu, M. W., & Quail, D. F. (2021). Immunotherapy for glioblastoma: Current progress and challenges. Frontiers in Immunology, 12, 676301. https://doi.org/10.3389/fimmu.2021.676301
- Zhang, L., Liu, Z., Dong, Y., & Kong, L. (2021). Epigenetic targeting of SLC30A3 by HDAC1 is related to the malignant phenotype of glioblastoma. IUBMB Life, 73(5), 784–799. https://doi.org/10.1002/iub.2463