
ABSTRACT
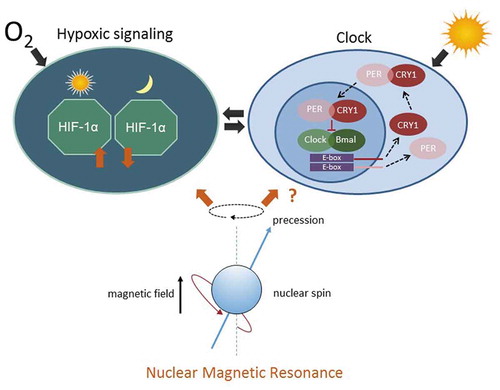
The influence of low intensity electromagnetic fields on circadian clocks of cells and tissues has gained increasing scientific interest, either as a therapeutic tool or as a potential environmental hazard. Nuclear Magnetic Resonance (NMR) refers to the property of certain atomic nuclei to absorb the energy of radio waves under a corresponding magnetic field. NMR forms the basis for Magnetic Resonance Imaging, Magnetic Resonance Spectroscopy and, in a low-intensity form, for NMR therapy (tNMR). Since the circadian clock is bi-directionally intertwined with hypoxic signaling in vertebrates and mammals, we hypothesized that low intensity electromagnetic fields, such as tNMR, might not only affect circadian clocks but also Hypoxia-Inducible Factor-1α (HIF-1α). As master regulator of the hypoxic signaling pathway, HIF-1α is known to dampen the circadian amplitude under reduced oxygen availability, while the hypoxic response of cells and organisms, itself, is tightly clock controlled. In a first experiment, we investigated if tNMR is able to act as Zeitgeber for the core clock mechanism of unsynchronized zebrafish and mouse fibroblast cells, using direct light irradiation and treatment with the glucocorticoid Dexamethasone as references. tNMR significantly affected the cell autonomous clocks of unsynchronized mouse fibroblast cells NIH3-T3, but did not act as a Zeitgeber. Similar to light irradiation and in contrast to treatment with Dexamethasone, tNMR did not synchronize expression profiles of murine clock genes. However, irradiation with tNMR as well as light significantly altered mRNA and protein expression levels of Cryptochrome1, Cryptochrome2 and Clock1 for more than 24 h. Changes in mRNA and protein after different treatment durations, namely 6 and 12 h, appeared to be nonlinear. A nonlinear dose-response relationship is known as hallmark of electromagnetic field induced effects on biological systems. The most prominent alterations were detected in murine HIF-1α protein, again in a nonlinear dose–response. In contrast to murine cells, zebrafish fibroblasts did not respond to tNMR at all. Light, a potent Zeitgeber for the peripheral clocks of fish, led to the expected synchronized clock gene oscillations of high amplitude, as did Dexamethasone. Hence, we conclude, mammalian peripheral clocks are more susceptible to tNMR than the direct light entrainable fish fibroblasts. Although light and tNMR did not act as Zeitgebers for the circadian clocks of unsynchronized murine cells, the significant observed effects might indicate downstream cell-physiological ramifications, which are worth future investigation. However, beside the effects tNMR exerts on the core clock mechanism of mammalian cells, the technology might be the first non-pharmacological approach to modify HIF-1α protein in cells and tissues. HIF-1α and the associated circadian clock play key roles in diseases with underlying ischemic background, such as infarct, stroke, and cancer and, also infectious diseases, such as Covid-19. Hence, low intensity magnetic fields such as tNMR might be of significant medical interest.
Introduction
Nuclear Magnetic Resonance (NMR) forms the basis for Magnetic Resonance Imaging (MRI), Magnetic Resonance Spectroscopy (MRS), as well as for the therapeutic tool of NMR therapy (tNMR or MBST®-NMR). tNMR is used for the treatment of osteoarthritis and osteoporosis and regeneration of bone and soft tissue. Its basis, and that of the other above listed techniques, is the so-called spin effect, as a quantum mechanical property of atomic nuclei with an odd number of protons or neutrons . When such spinning nuclei, for example, hydrogen protons, are exposed to an external magnetic field, they align in parallel or antiparallel to the field lines. The application of an additional corresponding radio frequency pulse forces the nuclear spins to deviate from the spin direction, thereby gaining energy. Once the radio frequency pulse ceases, the increase in energy is released to the close environment of the nuclei. In MRI, this release of energy is used for the generation of images, while in MRS it is used to determine the concentrations of chemical compounds. In tNMR, the release of energy is supposed to affect a yet unspecified cellular signaling, which consequently leads to regeneration and healing of the irradiated tissue. While MRI and MRS require strong magnetic fields, typically in the range of several Tesla, the MBST® therapy device generates a magnetic field of only 0.4 mT, and the used radio frequencies, therefore, are much lower as well (MBST®-NMR: 17 kHz-130 kHz compared to MRI: 10 MHz–200 MHz).
Several groups have been investigating the impact of low intensity electromagnetic fields (EMFs) on biological systems, as potential therapeutic tools (Carter et al. Citation2020; Cook et al. Citation2015; Kiss et al. Citation2015; Markov Citation2015; Morris and Skalak Citation2008; Rose et al. Citation2016; Vadala et al. Citation2016) or as possible environmental hazards (Juutilainen et al. Citation2018; Kaszuba-Zwoinska et al. Citation2015; Vanderstraeten et al. Citation2012, Citation2015; World Health Organization Citation2007). Special interest was thereby given to the influence of low-intensity EMFs on circadian clocks, and here, in particular, on the flavoprotein family of Cryptochromes (Crys). As core clock members, Crys are known to heterodimerize with Period protein isoforms to repress the activity of the Clock/Bmal1 complex, establishing therewith the central clock feedback loop. The generated loop leads to anti-phasic expression cycles of the involved genes and proteins, with a duration of ~24 h. This enables cells, tissues, and organisms proper time keeping (Shearman et al. Citation2000; Vatine et al. Citation2011). Crys are receptor molecules for the light-dependent retinal magneto-sensitivity of animals (Liedvogel and Mouritsen Citation2010; Liedvogel et al. Citation2007; Zoltowski et al. Citation2019). In this context, Crys have been shown to respond to alterations of the geomagnetic field by forming spin-correlated radical pairs through electron transfer within the protein, known as the radical pair mechanism or RPM. The concept of the RPM, in which a magnetic field is able to change the kinetics of a chemical reaction, was postulated (Schulten et al. Citation1978) and reviewed recently by Hore and Mouritsen (Hore and Mouritsen Citation2016).
In a recent study, the impact of weak-pulsed electromagnetic fields (PEMFs) on the CRY of mammalian cells, more specifically on the CRY of human HEK293 and murine MEF cells, was demonstrated (Sherrard et al. Citation2018). With PEMF treatment, the authors found an increased production of reactive oxygen species (ROS), which appeared to depend on CRY. Increased concentrations of ROS were found intracellularly as well as in the extracellular space, which means that quite large amounts of hydrogen peroxide were transported outwards. In a subsequent study, it was demonstrated that the application of an extremely low frequency- magnetic field (ELF-MF) of 0.1 mT and 50 Hz to human dermal fibroblasts led to direct entrainment of the cellular clocks. This suggests a potential timing (Zeitgeber) capacity of ELF-MF for the circadian clock of mammalian cells (Manzella et al. Citation2015). Lundberg and colleagues, however, found no effects on the expression of Cry1 and Cry2 after the exposure of mice to a 50 Hz magnetic field of 580 μT for 30 min. Instead, they observed a significantly reduced overall locomotor activity of the exposed mice. The magnetic field applied in the study was generated by a pair of Helmholtz coils and was used with and without blue LED light irradiation at 700 lux (Lundberg et al. Citation2019). Due to the diversity of experimental settings used in all these studies, no common conclusions can be drawn. Thus, the question of if and to what extent cell autonomous clocks or circadian rhythmicity might be affected by changes in the external magnetic field remains open. This is even more the case for the impact of NMR on cellular clocks.
The circadian clock is intimately linked with the hypoxic signaling pathway. In zebrafish, we were able to show that the bidirectional link between both pathways exists at the molecular, physiological, and organismic level (Egg et al. Citation2013, Citation2014; Pelster and Egg Citation2015, Citation2018; Sandbichler et al. Citation2018). The same mutual interaction was subsequently found in mammals and, therefore, appears to represent a fundamental aspect of eukaryotic cell biology (Adamovich et al. Citation2016; Manella et al. Citation2020; Peek et al. Citation2016; Wu et al. Citation2016). In a first study on tNMR, we investigated its effects on the cellular clocks and the hypoxic signaling pathway in zebrafish (Oliva et al. Citation2018). We used a tNMR dose of a single hour repeated for four consecutive days (4 h in total) on zebrafish cells and larvae, but found only minor effects (Oliva et al. Citation2018). To exclude that a too short irradiation time might have been the reason, in the present study we extended the total irradiation time to 6 h or 12 h, respectively. Additionally, we compared fibroblast cell lines of two different model organisms, the zebrafish fibroblast cell line Z3 and the mouse fibroblast cell line NIH3-T3. Apart from the teleost genome duplication, which occurred in fish and led to a higher number of clock gene isoforms compared to mammals (Pelster and Egg Citation2018), the circadian clock of both organisms also shows functional differences. Fish cells can be directly entrained to light-dark cycles (Froland Steindal and Whitmore Citation2019), similar to the cells of Drosophila. In zebrafish, the photosensitivity of cells was shown to depend on the expression of melanopsin (OPN4), which belongs to the protein family of the nonvisual opsins (Sousa et al. Citation2017). Due to the lack of OPN4 expression in mammalian peripheral clocks, they commonly do not respond directly to an external change of light (Froland Steindal and Whitmore Citation2019). However, direct light responsiveness was recently found in human adipocytes, which were shown to express OPN4 as well (Ondrusova et al. Citation2017), as it was in mouse skin cells, which express OPN5 (Buhr et al. Citation2019). In addition, we compared the effects of tNMR with those of direct light irradiation and with those of the glucocorticoid dexamethasone (DEX). DEX is known to synchronize the cellular clocks of zebrafish cells (Sousa et al. Citation2017), as well as those of mouse cells (Balsalobre et al. Citation2000; Chen et al. Citation2017; Nagoshi et al. Citation2004; So et al. Citation2009).
Here we show that tNMR affects clock gene expression of unsynchronized mouse fibroblasts. The observed effects resembled those of direct light irradiation, both without synchronizing the cellular expression of core clock members. tNMR led to increased protein levels of CRY1 and Hypoxia Inducible Factor-1 alpha (HIF-1α), which regulates the circadian clock with dependence on accessible oxygen (Adamovich et al. Citation2016; Egg et al. Citation2013; Peek et al. Citation2016; Pelster and Egg Citation2015, Citation2018; Sandbichler et al. Citation2018; Wu et al. Citation2016). Changes in the expression of mRNA and protein due to tNMR treatment thereby followed a nonlinear dose–response relationship, which is a hallmark of magnetic field exposed cells and tissues (Juutilainen et al. Citation2018; Marino et al. Citation2001). Surprisingly, in zebrafish fibroblasts, extended tNMR treatment durations did not lead to any significant changes in gene expression. Consequently, mammalian cells appear to be far more susceptible to tNMR than (zebra)fish cells. Hence, tNMR appears to be the first non-pharmacological approach to modulate HIF-1α protein levels in cells and tissues, apart from hypoxia itself. The technology, therefore, might be of significant medical interest for diseases with ischemic background, such as infarct, stroke, cancer, or infectious diseases, such as Covid-19.
Material and methods
Cell culture and tNMR treatments
The zebrafish fibroblast cell line Z3 was cultured in Leibovitz’s L-15 Medium (Life Technologies, USA), supplemented with 15% Fetal Bovine Serum (Life Technologies, USA), 1% L-Glutamin (Life Technologies, USA), 1% Penicillin-Streptomycin (Life Technologies, USA), and 0.12% Gentamicin (Life Technologies, USA) under constant darkness at 25°C in a non-humidified incubator at atmospheric CO2. The mouse fibroblast cell line NIH3-T3 (LGC Standards, USA) was cultured in Dulbecco’s Modified Eagle’s Medium (Life Technologies, USA), supplemented with 10% Calf Serum (Sigma Aldrich, USA) and 1% Penicillin-Streptomycin (Life Technologies, USA) at 37°C under constant darkness at 5% CO2 in a humidified incubator. For all experiments, cells were seeded in 10 cm petri dishes (Sarstedt, Germany).
Seeding of the cells was carried out under dim light, due to better handling. Any further exposition of the cells to light was excluded, except for the light-treated cells during their exposure times (Supplementary Figure S1A). As control group, cells were sham exposed in a dark room, at a distance of 2 m from the tNMR device (Figure S1, dark D). tNMR treatments were implemented using the MBST®-Open System 350 (MedTec Medizintechnik GmbH, Germany) with a field intensity of 0.4 mT and a radio frequency of 17 kHz (Figure S1, tNMR). Dexamethasone (Sigma Aldrich, USA) was added to the cells at a final concentration of 100 nM (Figure S1, DEX). Light exposure was performed in a Memmert-IPP-light incubator (Memmert GmbH, Germany; wavelength components: red 66%; green: 52%; blue: 13%; UV: 44%; white 100%) (Figure S1, Light). For all four treatment groups, culture conditions regarding temperature and percentage of CO2 were kept constant during treatments, and in the case of tNMR, sham exposure and dexamethasone treatments were performed simultaneously in the same dark room. As shown in (Supplementary Figure S1A), seeding of cells was carried out at 08:00 h. tNMR, sham (D) and light treatments were performed for two consecutive days for 3 h, between 08:00 and 11:00 h. DEX incubation was done once, the second day after seeding, between 08:00 and 11:00 h. Sampling for all treatment groups started on day 4, at 08:00 h, 21 h after the end of the second treatment, and was continued every 4 h for two consecutive days (Supplementary Figure S1B).
Cells used in the dose–response experiments (Supplementary Figure S2) were seeded at 08:00 h. All sham and tNMR treatments were started the day after, at 08:00 h in a dark room, maintaining temperature and CO2 levels for the respective cell lines constant during the treatments. Immediately after the exposures, cells were transferred again into the incubator. Sampling was then accomplished every 12 h for two circadian cycles, starting immediately before the treatments at 0 h. All experimental protocols conform to the international ethical standards of circadian rhythm research (Portaluppi et al. Citation2010).
Quantitative realtime – PCR (qRT-PCR)
Isolation of total RNA and cDNA synthesis of both cell lines, NIH3-T3 and Z3, was performed as outlined in Egg et al. (Citation2013). Primers were designed using Primer Express 3.0, and primer concentrations were optimized by performing primer matrices prior to realtime qPCR. Gene-specific mRNA copy numbers were measured in triplicate using the Power SYBR® Green Master Mix and a QuantStudio™ 3 Real-Time PCR System (Thermo Fisher Scientific, Warrington, UK). For absolute quantification, CT-values were reciprocally calculated to the log10 of the copy numbers and normalized to 20 ng of total RNA.
Mouse: Cry1: accession number NM_004075 (forward (f): 5ʹ-ttc gcc ggc tct tcc aa-3ʹ, reverse (r): 5ʹ-ctc aag aca ctg aag caa aaa tcg-3ʹ); Cry2: accession number NM_009963 (f: 5ʹ-cac ggc cca tcg tca atc-3ʹ, r: 5ʹ-tct gct tca ttc gtt caa tgt tg-3ʹ); Clock1: accession number XR_001784602 (f: 5ʹ-aca ccg aca aag atc cct act ga-3ʹ; r: 5ʹ-ttc atg agc tgg caa atg ct-3ʹ); Per1: accession number NM_001159367 (f: 5ʹ-ggc agg cca gcc ctt t-3ʹ, r: 5ʹ-ccc gtt ccg agc aca gaa-3ʹ); Per2: accession number NM_011066 (f: 5ʹ-tca tga gcc aga cat cat cca-3ʹ, r: 5ʹ-tcc tcc ggt gag act cct ctt-3ʹ).
Zebrafish: cry1aa: accession number NM_001077297.2 (f: 5ʹ-ggc cgc cgc act ga-3ʹ, r: 5ʹ-ccc ctt aag act ggc aga tat cg-3ʹ), cry2a: accession number NM_131786.2 (f: 5ʹ-cac tac ccc aaa ccc atg gta-3ʹ, r: 5ʹ-ctg ctt cat cct ctc aat gtt ga-3ʹ); clock1a: accession number XM_009294633 (f: 5ʹ-tca ggc ccc acg tct ttt ac-3ʹ, r: 5ʹ-gcc gcc tgg agg atc ag-3ʹ); per1b: accession number NM_212439 (f: 5ʹ-cac cca ccg tcc ttc ctt tc-3ʹ, r: 5ʹ-tct gag acg gga tgg gag at-3ʹ) and per2: accession number NM_182857 (f: 5ʹ-cag ccg gtg tta gag agc agt ca-3ʹ, r: 5ʹ-aat cca gtc cag tca cag ctt ca-3ʹ).
Western blot
NIH3-T3 cells were harvested in lysis buffer containing glycerol (25%), NaCl (420 mM), MgCl2 (1.5 mM), EDTA (0.2 mM), Hepes (20 mM), and protease inhibitor cocktail (including Sodium Vanadate (1 mM), Phenylmethylsulfonylfluoride [PMSF] (0.5 mM), Aprotinin (1 μg/ml), Leupeptin (1 μg/ml), Pepstatin (1 μg/ml), Dithiothreitol [DTT] (0.5 mM), and MG132 [carbobenzoxy-Leu-Leu-leucinal] (10 mM)), and kept on ice. Lysates were centrifuged at 5000 rpm for 5 min at 4°C. Cell pellets were resuspended in 50 μl Laemmli sample buffer (2×) (Bio-Rad Laboratories, USA) and heated to 95°C for 5 min. Samples were mixed and centrifuged at 5000 rpm for 5 min at room temperature. The resulting supernatants were used for western blotting. Protein concentrations were determined in triplicate using the Nanodrop 2000c Spectrophotometer (Thermo Scientific, Waltham, Massachusetts, USA), and 20 μg of total protein of each sample was used. Proteins were separated by a 12% SDS page and after electrophoretic transfer of proteins to a polyvinylidene fluoride membrane, unspecific protein-binding sites were blocked in 5% low fat powdered milk (Carl Roth GmbH, Germany) dissolved in tris buffered saline (50 mM TRISBase, 150 mM NaCl, pH 7.5) containing 0.1% Tween 20 (Carl Roth GmbH, Germany) (blocking buffer) for 45 min at room temperature. The following primary antibodies dilutions were used for overnight incubation, at 4°C, in blocking buffer: Cry1 1:2000 (a generous gift from Jürgen Ripperger, PhD, University Freiburg, Germany), Clock 1:4000 (ab3517, Abcam, UK), Hif1 1:1000 (ab179483, Abcam, UK), Cry2 1:4000 (AM8637b, Abgent, USA) and ß-Actine as loading control 1:1000 (A2066, Sigma Aldrich, USA). After three washing steps, the membrane was incubated for 60 min in blocking buffer at room temperature with secondary antibodies goat anti-rabbit IgG peroxidase 1:10000 (ab6721, Abcam, USA) or anti-mouse IgG peroxidase 1:1000 (A9044 Sigma Aldrich, USA). Three washing steps were carried out before chemiluminescent detection using ECL™ Prime Western Blotting System (GE Healthcare, Germany). Relative quantification of protein levels was accomplished by Image LabTM Software 5.2.1 (Bio-rad, Germany).
Statistics
Data are presented as means ± SEM. Data were analyzed using two-way analysis of variance (ANOVA) followed by Holm-Sidak post-hoc tests and, in the case of failed normality, Kruskal–Wallis one-way ANOVA on ranks. Significance was accepted for p ≤ 0.05. Statistical analysis and Cosinor analysis for rhythm detection, with p-value determined by F-test of the amount of variance accounted for by the fit of the cosine vs. straight line to the time series data was performed using GraphPad Prism 6.0 () as outlined in detail in (Oliva et al. Citation2018).
Figure 1. Effects of tNMR, dexamethasone, and light treatment on the cell autonomous clocks of the mouse fibroblast cells NIH3-T3: mRNA expression over two circadian cycles of (A) Cryptochrome1 (Cry 1), (B) Cryptochrome2 (Cry 2), (C) Clock1, (D) Period1 (Per1), and (E) Period2 (Per2); tNMR (left) presented in light blue, dexamethasone DEX (middle) in red, and light irradiation (right) in light orange; presented are means ± SEM, n = 6; asterisks mark significant changes calculated using two-way ANOVA (GraphPad Prism version 6.00). Cosinor analysis was applied using GraphPad Prism version 6.00, as outlined in detail in Oliva et al. (Citation2018). Circadian oscillations of DEX treated cells are indicated by an additional red cosinor wave
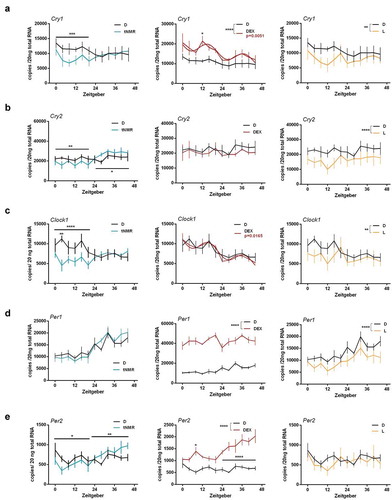
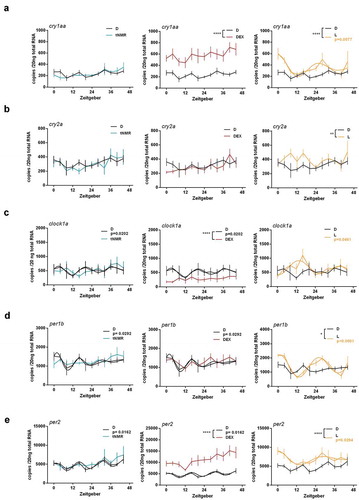
Figure 2. Effects of tNMR, dexamethasone and light on the cell autonomous clocks of zebrafish fibroblast cells Z3: mRNA expression over two circadian cycles of (A) cry1aa, (B) cry2a, (C) clock1a, (D) per1b, and (E) per2; tNMR (left) presented in light blue, dexamethasone DEX (middle) in red, and light irradiation (right) in light orange; presented are means ± SEM, n = 6; asterisks mark significant changes calculated using two-way ANOVA (GraphPad Prism version 6.00). Cosinor analysis was applied using GraphPad Prism version 6.00, as outlined in detail in Oliva et al. (Citation2018). Circadian oscillations of light treated cells are indicated by an additional light orange cosine wave. Circadian oscillations of unsynchronized zebrafish cells kept under constant darkness (in black) show two acrophases per circadian cycle, as previously reported in Oliva et al. (Citation2018)
Results
tNMR reduces mRNA clock gene steady state levels in mouse fibroblasts but does not induce rhythmicity
Clock gene mRNA profiles of mouse fibroblasts NIH3-T3 were recorded 21 h after the last treatment with tNMR (2 × 3 h, two consecutive days), dexamethasone DEX (1 × 3 h), or light (2 × 3 h, two consecutive days) for two circadian cycles ( and experimental setup Supplementary Figure S1). Cry1 mRNA decreased significantly after tNMR and light treatment during the first 24 h of sampling, whereas it increased in its expression level and oscillation amplitude after DEX treatment (). tNMR and light treated cells did not differ in their Cry1 response. After tNMR treatment, Cry2 mRNA modestly decreased during the first 24 h of sampling and increased subsequently. No difference in Cry2 mRNA steady state levels was observable in DEX treated cells compared to control cells. Light treatment led to a decrease in Cry2 mRNA over the whole sampling period (). tNMR and light treated cells thereby revealed a significant difference in their Cry2 response (p < 0.0001). Clock1 mRNA levels were significantly reduced in tNMR and light treated cells over the first 24 h of sampling, while DEX treatment induced a circadian oscillation of Clock1 mRNA (). Per1 mRNA copy numbers of tNMR treated cells did not differ from control cells, but were reduced in light treated cells, while DEX led to an overall highly increased Per1 mRNA level. Hence, tNMR and light treated cells differed significantly in their Per1 mRNA steady state levels (p < 0.001) (). mRNA expression of Per2 decreased over the first 24 h and increased afterward upon tNMR treatment, thus resembling the tNMR response of Cry2, whereas light treated cells showed no difference. DEX, in turn, led to continuously increasing Per2 mRNA copy numbers (). Per2 mRNA levels did not differ between tNMR and light treated cells. In summary, the cell autonomous clocks of mouse fibroblasts were affected by tNMR in its overall mRNA steady state levels, while DEX induced rhythmicity. Light induced effects resembled those of tNMR irradiation, but differed gene specifically.
An extended tNMR treatment of six hours does not affect mRNA clock gene steady state levels in zebrafish fibroblasts
A tNMR treatment for 2 × 3 h (Suppl. Figure S1) did not lead to any alterations in cry1aa mRNA of zebrafish Z3 cells (). After DEX treatment, cry1aa mRNA copy numbers increased in overall level. Light irradiation synchronized the oscillation of cry1aa mRNA to a 24 h rhythm (as shown by the circadian dampened cosine wave in , right) and enhanced its overall expression level (). cry2a mRNA showed no response to tNMR and DEX, but strongly increased due to light irradiation (). Although apparently oscillating after light treatment, we were not able to substantiate a circadian rhythm by cosine wave approximation to the cry2a mRNA time series data. Clock1a showed a bi-phasic oscillation under constant darkness. mRNA copy numbers of clock1a did not respond to tNMR and decreased after treatment with DEX. Light synchronized the expression of clock1a mRNA to a circadian oscillation of high amplitude (). Both clock1a mRNA and per1b mRNA oscillated in a bi-phasic rhythm under constant darkness. No significant response was observed in the level of per1b mRNA after tNMR or DEX exposure, although the circadian rhythmicity was apparently compromised in both cases. Light irradiation led to a synchronized circadian per1b mRNA oscillation of high amplitude (). Under constant darkness, the mRNA levels of per2 followed a bi-phasic rhythm and did not react to tNMR. After incubation with DEX, per2 overall mRNA copy numbers were enhanced, whereas light synchronized the expression of per2 mRNA to a high amplitude oscillation ().
In summary, neither of the zebrafish clock genes was affected by tNMR using a dose of 2 × 3 h. Although overall steady state levels were significantly affected, DEX did not induce circadian rhythmicity. Light led to the known synchronization of the clock genes. Hence, the response of the core clock mechanism to all three treatments differed fundamentally in mouse and zebrafish fibroblasts.
Murine mRNA steady state levels of clock genes and associated Hif-1α reacts to tNMR in a nonlinear dose–response relationship
Next, we wanted to test if the transcriptional changes observed in murine clock gene mRNA might follow a dose–response relationship. We therefore used the experimental set up shown in (Supplementary Figure S2) and compared 6 h treatments with 12 h treatments. Sampling was performed over a period of 60 h in intervals of 12 h. While mRNA steady state levels of all investigated genes seemed to follow a similar pattern (), significant changes induced by tNMR treatment were only detected in the Period1 and Period2 genes, as well as in Hif-1α (). Recorded differences in mRNA copy numbers between the 6 h and the 12 h treatment thereby did not follow a linear dose–response relationship. Since in zebrafish fibroblasts no changes in clock gene levels were found even after extended treatment durations, we decided not to further investigate in this direction ().
Figure 3. Dose effect relationships of tNMR in the cell autonomous clocks of mouse fibroblast cells NIH3-T3: mRNA expression over two circadian cycles of (A) Cry1, (B) Cry2, (C) Per1, (D) Per2, (E) Clock1, and (F) Hif-1α; sham treated cells under constant darkness are shown in black, cells treated with tNMR for 6 h in gray, and cells treated with tNMR for 12 h in white; presented are means ± SEM, n = 4–8. Asterisks mark significant changes calculated using two-way ANOVA (GraphPad Prism version 6.00)
Figure 4. Dose effect relationships of tNMR in the cell autonomous clocks of zebrafish fibroblast cells Z3: mRNA expression over two circadian cycles of (A) cry1aa, (B) cry2a, (C) per1b, (D) per2, and (E) clock1a; sham treated cells under constant darkness are shown in black, cells treated with tNMR for 6 h in gray, and cells treated with tNMR for 12 h in white; presented are means ± SEM, n = 3–8. Asterisks mark significant changes calculated using two-way ANOVA (GraphPad Prism version 6.00)
CRY1 and HIF-1α protein follow a nonlinear dose–response relationship in response to the treatment with tNMR
In a further step, we wanted to find out if the tNMR induced alterations observed in murine mRNA steady state levels could also be found at the protein level. We, therefore, semi-quantified the amounts of murine CLOCK1, CRY1, CRY2, and HIF-1α (), using the experimental setup shown in (Supplementary Figure S2). Due to the Transcription-Translation Feedback Loops of the cellular clocks, we expected higher protein levels of CLOCK1 and CRY1 after the 6 h treatment, because of the significantly reduced mRNA copy numbers of Clock1 and Cry1 ( and C). CLOCK1 protein did not respond to the 6 h treatment and was elevated only moderately after the 12 h treatment, between sampling points 12 h and 36 h (). CRY1, in contrast, was reduced after the 6 h treatment, while it was significantly elevated thereafter, between 36 h and 60 h (). CRY2 did not respond to any of the two treatment durations (). After the 6 h treatment, protein levels of HIF-1α increased over the whole sampling period, most prominently at sampling point 48 h (). After the 12 h tNMR treatment, the trend tended rather to the opposite direction, namely to a reduction in the protein levels of CRY1 and HIF-1α ( and D).
Figure 5. Dose effect relationships between tNMR and proteins levels of clock proteins and HIF-1α in mouse fibroblast NIH3-T3 cells: protein levels over two circadian cycles, semi-quantified using Western Blots, of CLOCK1 (A), CRY1 (B), CRY2 (C), and HIF-1α (D); presented are means ± SEM, n = 5–8. Asterisks mark significant changes calculated using two-way ANOVA (GraphPad Prism version 6.00). Representative blots and ß-actin loading controls are shown below the respective graphs
Figure 6. tNMR affects the cell autonomous clocks and hypoxic signaling in mammalian cells: Hypoxic signaling and the circadian clock are bi-directionally intertwined (Adamovich et al. Citation2016; Egg et al. Citation2013, Citation2014; Manella et al. Citation2020; Peek et al. Citation2016; Sandbichler et al. Citation2018; Wu et al. Citation2016). The hypoxic response is clock controlled and depends on the time of day (left). The circadian clock, in turn, is modulated by HIF-1α according to the available oxygen (right). The interaction between both cell circuits is indicated by the two arrows in the middle. tNMR affects both pathways, leading to up or down regulation of the respective genes and proteins, depending on the dose of irradiation. In unsynchronized mouse fibroblasts, tNMR does not induce expression of rhythmicity
Discussion
The influence of magnetic fields from various sources on living cells, tissues, and organisms has gained increasing interest during recent years, beyond the research on geomagnetic compass orientation of migrating animals. Related studies focused on eventual harmful effects of human electromagnetic exposition in modern everyday life (Juutilainen et al. Citation2018; Kaszuba-Zwoinska et al. Citation2015; Vanderstraeten et al. Citation2012, Citation2015; World Health Organization Citation2007), as well as on the biological effects of electromagnetic radiation as future evidence based therapeutic tools (Cook et al. Citation2015; Kiss et al. Citation2015; Markov Citation2015; Morris and Skalak Citation2008; Rose et al. Citation2016; Vadala et al. Citation2016). In a previous study, we tested the impact of tNMR on the circadian clock and hypoxic signaling in zebrafish (Oliva et al. Citation2018). Here, we found only minor effects of tNMR on both signaling pathways, which are intimately intertwined in zebrafish and mammals (Adamovich et al. Citation2016; Egg et al. Citation2013, Citation2014; Manella et al. Citation2020; Peek et al. Citation2016; Pelster and Egg Citation2015, Citation2018; Sandbichler et al. Citation2018; Wu et al. Citation2016). Since we were not sure if the reason for the only subtle effects observed might have been too short exposure durations (4 × 1 h), we investigated longer tNMR treatment durations, namely ones of 6 and 12 h, without any additional light source. In a first attempt, we wanted to find out if tNMR was able to synchronize the circadian rhythm of cells. We, therefore, took unsynchronized zebrafish (Z3) and mouse (NIH3-T3) fibroblasts and compared three different treatments, namely tNMR, DEX, and light. DEX was shown to synchronize the circadian clock in mammalian cells (Balsalobre et al. Citation2000; Chen et al. Citation2017; Nagoshi et al. Citation2004; So et al. Citation2009), and light is known to generate robust oscillations of core clock genes in the directly light sensitive cells of fish (Froland Steindal and Whitmore Citation2019).
tNMR was unable to induce a circadian oscillation of clock genes in either one of the two unsynchronized cell lines (, left). These results are in contrast to those reported in the study of Manzella et al. (Citation2015), who demonstrated the entrainment capacity of an ELF-MF (0.1 mT and 50 Hz) in serum starved human fibroblast cells, which lack a circadian oscillation.
DEX treatment, in turn, induced circadian oscillations of murine Cry1 and Clock1 mRNA, and increased the levels of Per1 and Per2 mRNA up to fourfold, without leading to robust oscillations of the latter (, middle). Mammalian clock genes of different cell lines and tissues have been shown to react rather differently to DEX exposure, as, for example, also with an overall up or downregulation of the respective mRNA levels. However, a synchronizing effect of DEX on the cell autonomous clocks of mammalian cells is commonly accepted, and our data are in accordance with the findings of other groups (Balsalobre et al. Citation2000; Chen et al. Citation2017; Kiessling et al. Citation2017; Nebzydoski et al. Citation2010; Preitner et al. Citation2002; So et al. Citation2009). We also found significant effects of DEX on the clock gene expression of zebrafish Z3 cells (, middle). Copy numbers of cry1aa and per2 increased by threefold and twofold, respectively, while mRNA copy numbers of clock1 decreased by half. Nonetheless, cosinor anlaysis did not reveal circadian rhythmicity in the observed oscillations. A study investigating the effects of DEX treatment on circadian clock gene expression in zebrafish fibroblast-like embryonic cells (ZEM-2S) under constant darkness reported comparable results. Yet, the authors did not apply cosinor analysis to test for circadian rhythmicity of the oscillations (Sousa et al. Citation2017).
tNMR, however, led to significant reductions in the copy numbers of murine Cry1 and Clock1 over an entire 24 h cycle, resembling the effects of direct light irradiation on the same genes ( and C, left and right). Murine Cry2 and Per1 mRNA levels, in contrast, differed significantly between the two types of irradiations (, and E, left and right). Initially, we attributed these differences to varying amounts of energy/photons arriving in the cells. The comparison between the effects of tNMR and light in zebrafish cells, though, does not seem to favor this hypothesis. In zebrafish cells, we observed either an all-or-nothing response, which was, as described previously (Tamai et al. Citation2007; Vallone et al. Citation2005), either a strong induction of circadian rhythmicity in the case of light exposure (, left and right), or no reaction at all in the case of tNMR. Hence, in mouse fibroblast cells, direct light irradiation significantly affected clock gene mRNA steady state levels without inducing oscillations. The potential cell-physiological ramifications of this phenomenon are unknown. Only recently, direct light responsiveness of cellular clocks, a feature hitherto attributed exclusively to fish and drosophila cells, was found in human adipocytes (Ondrusova et al. Citation2017). According to the authors, between 1% and 5% of blue/green light penetrates the human skin to varying depths, depending on its wavelength and intensity. Similarly, also mouse skin fibroblast cells were demonstrated to be directly entrainable by light (Buhr et al. Citation2019). In both cases, the synchronization of the circadian clock was found to depend on the expression of nonvisual opsin isoforms, OPN4 in zebrafish cells (Sousa et al. Citation2017) and OPN5 in human adipocytes (Ondrusova et al. Citation2017). Against this background and based on our own findings, we believe that downstream cell-physiological consequences in cells and tissues exposed to light will be probable in both cases, with and without a light induced circadian synchronization of peripheral clock genes.
To further characterize the effects of tNMR on cell autonomous clocks, we performed a dose–response experiment to investigate the relationship and compared a single 6 h with a single 12 h treatment (Supplementary Figure S2). As shown in (), only murine Per1 and Per2 genes, as well as mRNA steady state levels of associated HIf-1α responded differently to the two treatment durations, although comparable trends were noticeable in all genes. While mRNA copy numbers decreased after the 6 h treatment, cells treated for 12 h revealed increased mRNA copy numbers of the respective genes. Such nonlinear dose–response relationships were repeatedly reported for the effects of (electro)magnetic fields on biological systems (Juutilainen et al. Citation2018; Marino et al. Citation2001). They are also known as “window effects” or resonance-type responses (Adey Citation1993; Funk et al. Citation2009; Mansourian et al. Citation2016; Markov Citation2010). These window effects may refer to frequencies (frequency window), flux densities of (electro)magnetic fields (intensity window), as well as to exposure durations (time window) (Mansourian et al. Citation2016; Markov Citation2010), and are found in a wide range of different cell-physiological parameters after exposure to non-ionizing radiation. The nonlinearity observed therein appears to reside in the biological detection molecules or systems, similar to the principle of radio receivers (Adey Citation1993; Funk et al. Citation2009; Markov Citation2010). In addition, the increased durations of tNMR treatment (6 h and 12 h in comparison to the 4 × 1 h used in Oliva et al. Citation2018) did not lead to an increase in the effects reported for zebrafish cells. Rather, no significant effects were observed at all (). We, therefore, conclude that mammalian cells might be far more susceptible to tNMR than fish cells.
To quantify protein expression, we used the dose–response experimental setup under constant darkness, shown in (Supplementary Figure 2). While CLOCK1 protein increased only modestly after the 12 h tNMR treatment, CRY1, apart from an initial decrease, was significantly elevated over a whole circadian cycle after the 6 h treatment ( and B). CRY2, in turn, did not react at all (). Discrepancies between mRNA and protein expression levels are known to be rather the rule than the exception, as indicated by the low Pearson correlation coefficient of approximately 0.4 in mammalian cells (Kosti et al. Citation2016; Perl et al. Citation2017; Vogel and Marcotte Citation2012). Mammalian CRY1 and CRY2 are both type II cryptochromes and their photosensitivity is still under debate (Michael et al. Citation2017; Niessner et al. Citation2016; Vanderstraeten et al. Citation2020). In humans, both isoforms were demonstrated to respond to changes in the external magnetic field when introduced into Drosophila cryptochrome-deficient strains (Foley et al. Citation2011; Sherrard et al. Citation2018). In both studies, the magneto-sensitivity appeared to be dependent on blue light irradiation. In a study on male C57BL/6J mice, again no changes in Cry1 and Cry2 mRNA expression in adrenals, liver, and hippocampus were observed after an exposure of 30 min to a 50 Hz magnetic field of 580 μT and/or a blue LED light at 700 lux (Lundberg et al. Citation2019). Nonetheless, animals displayed a decreased total locomotor activity after exposure to the magnetic field, even when no additional light was applied. In this context, Hirayama and colleagues (Hirayama et al. Citation2019) were able to show that total locomotor activity of zebrafish was clearly clock controlled and depended on the expression of cry1a and per2. Assuming that total activity levels are clock regulated in mice, too, we propose that in the Lundberg study (Lundberg et al. Citation2019) changes in the expression of Cry1 and/or Cry2 possibly might have occurred also in the skin of mice. Remarkably, most prominent alterations induced by tNMR were detected in the amounts of HIF-1α protein (). While after 6 h of tNMR treatment, the amount of protein increased significantly over the whole sampling period, protein levels rather tended to decrease after the tNMR treatment of 12 h. Hence, the response of HIF-1α to varying tNMR treatment durations was as well nonlinear. Of note, increased protein levels of HIF-1α after the 6 h treatment coincided with reduced mRNA copy numbers of Per1 and Per2 ( and D), and a reversed trend was observed after the 12 h treatment. In previous studies on zebrafish Z3 cells, we were able to show that HIF-1α directly binds to the gene control regions of period1b and period2 under hypoxic conditions, resulting in downregulation of the respective mRNA copy numbers (Egg et al. Citation2013; Pelster and Egg Citation2015; Sandbichler et al. Citation2018). Binding of HIF-1α to promoter regions of core clock genes at the genome level was also reported for mammalian cells (Peek et al. Citation2016; Wu et al. Citation2016). As recently reviewed (Bartman and Eckle Citation2019; Morgan et al. Citation2019), the regulation of Period genes through Hif-1α is currently commonly accepted. Only recently, CRY1, but not CRY2, was identified as a negative regulator of HIF-1α in the mouse fibroblast NIH3-T3 and MEF cell lines, at the level of transactivation capacity, as well as at the level of protein quantity (Dimova et al. Citation2019). Furthermore, CRY1 and CRY2 are reported to suppress HIF1α- BMAL1 heterodimers in mouse muscles (Vaughan et al. Citation2020). Against this background, the contemporaneously increased quantities of CRY1 and HIF-1α protein over the period of 2 h after the 6 h tNMR treatment seem astonishing ( and D). In addition, both proteins appear to immediately react to the tNMR exposure. This fast response even implies a major role for HIF-1α in the cellular perception of magnetic field alterations or in the subsequent signal transduction. This is all the more plausible, when considering that oxygen, itself, is a paramagnetic element, and that the functional interaction between HIF-1α and CRY1 appears to be an essential one (). Furthermore, the exposure of chick embryos to a low-intensity EMF (2–10 μT, 10 Hz) seems to protect the animals against a subsequent hypoxic insult (Di Carlo et al. Citation2000). In another study, it was demonstrated that prior PEMF treatment resulted in reduced damage of hypoxia and inflammation induced injuries in Neuron-Like and Microglial Cells via a reduction of HIF-1α protein (Vincenzi et al. Citation2017). Both studies implicate that magnetic fields might directly interfere with hypoxic signaling in vivo. In addition, the ability of EMF to treat type 2 diabetes in mice (Carter et al. Citation2020) strongly underpins our findings, given that the cellular glucose metabolism is mainly controlled by HIF-1α.
In conclusion, we are aware that the findings of our study raise many new questions, for example, the question of downstream cell-physiological consequences of tNMR induced altered CRY1 and HIF-1α levels, given that both proteins are major and potent cellular transcription factors. However, apart from hypoxia itself, tNMR appears to be the first non-pharmacological approach to alter HIF-1α protein levels in cells and tissues. Hence, the technology might have high potential as a therapeutic tool for ischemic conditions and diseases where the interplay between both pathways, the circadian clock and hypoxic signaling, is out of equilibrium.
Declaration of interest
This work was funded by a grant (P 215529) from MedTec company, Wetzlar, Germany.
Supplemental Material
Download PDF (330.8 KB)Acknowledgements
This work was funded by a grant (P 215529) from MedTec company, Wetzlar, Germany.
Supplementary material
Supplemental data for this article can be accessed on the publisher’s website.
Additional information
Funding
References
- Adamovich Y, Ladeuix B, Golik M, Koeners MP, Asher G. (2016). Rhythmic oxygen levels reset circadian clocks through HIF1α. Cell Metab. 25:93–101. doi:10.1016/j.cmet.2016.09.014. PMID: 27773695.
- Adey WR. (1993). Biological effects of electromagnetic fields. J Cell Biochem. 51:410–416. doi:10.1002/jcb.2400510405. PMID: 8388394.
- Balsalobre A, Brown S, Marcacci L, Tronche F, Kellendonk C, Reichardt H, Schütz G, Schibler U. (2000). Resetting of circadian time in peripheral tissues by glucocorticoid signaling. Science. 289:2344–2347. doi:10.1126/science.289.5488.2344
- Bartman CM, Eckle T. (2019). Circadian-hypoxia link and its potential for treatment of cardiovascular disease. Curr Pharm Des. 25:1075–1090. doi:10.2174/1381612825666190516081612. PMID: 31096895.
- Buhr ED, Vemaraju S, Diaz N, Lang RA, Van Gelder RN. (2019). Neuropsin (OPN5) mediates local light-dependent induction of circadian clock genes and circadian photoentrainment in exposed murine skin. Curr Biol. 29:3478–3487. doi:10.1016/j.cub.2019.08.063. PMID: 31607531.
- Carter CS, Huang SC, Searby CC, Cassaidy B, Miller MJ, Grzesik WJ, Piorczynski TB, Pak TK, Walsh SA, Acevedo M, et al. (2020). Exposure to static magnetic and electric fields treats type 2 diabetes. Cell Metab. 32:561–574. doi:10.1016/j.cmet.2020.09.012. PMID: 33027675.
- Chen H, Gao L, Xiong Y, Yang D, Li C, Wang A, Jin Y. (2017). Circadian clock and steroidogenic-related gene expression profiles in mouse Leydig cells following dexamethasone stimulation. Biochem Biophys Res Commun. 483:294–300. doi:10.1016/j.bbrc.2016.12.149. PMID: 28025148.
- Cook JJ, Summers NJ, Cook EA. (2015). Healing in the new millennium: bone stimulators: an overview of where we’ve been and where we may be heading. Clin Podiatr Med Surg. 32:45–59. doi:10.1016/j.cpm.2014.09.003. PMID: 25440417.
- Di Carlo AL, Mullins JM, Litovitz TA. 2000. Thresholds for electromagnetic field-induced hypoxia protection: evidence for a primary electric field effect. Bioelectrochemistry. 52:9–16. doi:10.1016/S0302-4598(00)00076-3. PMID: 11059571.
- Dimova EY, Jakupovic M, Kubaichuk K, Mennerich D, Chi TF, Tamanini F, Oklejewicz M, Hanig J, Byts N, Makela KA, et al. (2019). The circadian clock protein CRY1 is a negative regulator of HIF-1α. iScience. 13:284–304. doi:10.1016/j.isci.2019.02.027. PMID: 30875610.
- Egg M, Koblitz L, Hirayama J, Schwerte T, Folterbauer C, Kurz A, Fiechtner B, Most M, Salvenmoser W, Sassone-Corsi P, et al. 2013. Linking oxygen to time: the bidirectional interaction between the hypoxic signaling pathway and the circadian clock. Chronobiol Int. 30:510–529. doi:10.3109/07420528.2012.754447. PMID: 23421720.
- Egg M, Paulitsch M, Ennemoser Y, Wustenhagen A, Schwerte T, Sandbichler AM, Fiechtner B, Koblitz L, Prem C, Pelster B. 2014. Chronodisruption increases cardiovascular risk in zebrafish via reduced clearance of senescent erythrocytes. Chronobiol Int. 31:680–689. doi:10.3109/07420528.2014.889703. PMID: 24568569.
- Foley LE, Gegear RJ, Reppert SM. 2011. Human cryptochrome exhibits light-dependent magnetosensitivity. Nat Commun. 2:356. doi:10.1038/ncomms1364. PMID: 21694704.
- Froland Steindal IA, Whitmore D. Circadian clocks in fish-what have we learned so far? Biology (Basel). 2019;8. doi:10.3390/biology8010017. PMID: 30893815.
- Funk RH, Monsees T, Ozkucur N. 2009. Electromagnetic effects - from cell biology to medicine. Prog Histochem Cytochem. 43:177–264. PMID: 19167986. doi:10.1016/j.proghi.2008.07.001.
- Hirayama J, Alifu Y, Hamabe R, Yamaguchi S, Tomita J, Maruyama Y, Asaoka Y, Nakahama K-I, Tamaru T, Takamatsu K, et al. (2019). The clock components Period2, Cryptochrome1a, and Cryptochrome2a function in establishing light-dependent behavioral rhythms and/or total activity levels in zebrafish. Sci Rep. 9:196. doi:10.1038/s41598-018-37879-8. PMID: 30655599.
- Hore PJ, Mouritsen H. 2016. The radical-pair mechanism of magnetoreception. Annu Rev Biophys. 45:299–344. doi:10.1146/annurev-biophys-032116-094545. PMID: 27216936.
- Juutilainen J, Herrala M, Luukkonen J, Naarala J, Hore PJ. Magnetocarcinogenesis: is there a mechanism for carcinogenic effects of weak magnetic fields? Proc Biol Sci. 2018;285. doi:10.1098/rspb.2018.0590. PMID: 29794049.
- Kaszuba-Zwoinska J, Gremba J, Galdzinska-Calik B, Wojcik-Piotrowicz K, Thor PJ. 2015. Electromagnetic field induced biological effects in humans. Przegl Lek. 72:636–641. PMID: 27012122.
- Kiessling S, Beaulieu-Laroche L, Blum ID, Landgraf D, Welsh DK, Storch K-F, Labrecque N, Cermakian N. 2017. Enhancing circadian clock function in cancer cells inhibits tumor growth. BMC Biol. 15:13. doi:10.1186/s12915-017-0349-7. PMID: 28196531.
- Kiss B, Laszlo JF, Szalai A, Porszasz R. 2015. Analysis of the effect of locally applied inhomogeneous static magnetic field-exposure on mouse ear edema – a double blind study. PLoS One. 10:e0118089. doi:10.1371/journal.pone.0118089. PMID: 25695832.
- Kosti I, Jain N, Aran D, Butte AJ, Sirota M. 2016. Cross-tissue analysis of gene and protein expression in normal and cancer tissues. Sci Rep. 6. doi:10.1038/srep24799.
- Liedvogel M, Maeda K, Henbest K, Schleicher E, Simon T, Timmel CR, Hore PJ, Mouritsen H. 2007. Chemical magnetoreception: bird cryptochrome 1a is excited by blue light and forms long-lived radical-pairs. PLoS One. 2:e1106. doi:10.1371/journal.pone.0001106. PMID: 17971869.
- Liedvogel M, Mouritsen H. 2010. Cryptochromes—a potential magnetoreceptor: what do we know and what do we want to know? J R Soc Interface. 7:S147–S162. doi:10.1098/rsif.2009.0411.focus. PMID: 19906675.
- Lundberg L, Sienkiewicz Z, Anthon DC, Broom KA. 2019. Effects of 50 Hz magnetic fields on circadian rhythm control in mice. Bioelectromagnetics. 40:250–259. doi:10.1002/bem.22188. PMID: 30945762.
- Manella G, Aviram R, Bolshette N, Muvkadi S, Golik M, Smith DF, Asher G. 2020. Hypoxia induces a time- and tissue-specific response that elicits intertissue circadian clock misalignment. Proc Natl Acad Sci USA. 117:779–786. doi:10.1073/pnas.1914112117. PMID: 31848250.
- Mansourian M, Marateb HR, Vaseghi G. 2016. The effect of extremely low-frequency magnetic field (50–60 Hz) exposure on spontaneous apoptosis: the results of a meta-analysis. Adv Biomed Res. 5:141. doi:10.4103/2277-9175.187375. PMID: 27656610.
- Manzella N, Bracci M, Ciarapica V, Staffolani S, Strafella E, Rapisarda V, Valentino M, Amati M, Copertaro A, Santarelli L. 2015. Circadian gene expression and extremely low-frequency magnetic fields: an in vitro study. Bioelectromagnetics. 36:294–301. doi:10.1002/bem.21915. PMID: 25808738.
- Marino AA, Wolcott RM, Chervenak R, Jourd’heuil F, Nilsen E, Frilot C. 2001. Nonlinear dynamical law governs magnetic field induced changes in lymphoid phenotype. Bioelectromagnetics. 22:529–546. doi:10.1002/bem.82. PMID: 11748671.
- Markov M. 2015. XXIst century magnetotherapy. Electromagn Biol Med. 34:190–196. doi:10.3109/15368378.2015.1077338. PMID: 26444192.
- Markov MS. 2010. Angiogenesis, magnetic fields and ‘window effects’. Cardiology. 117:54–56. doi:10.1159/000315433. PMID: 20924178.
- Michael AK, Fribourgh JL, Van Gelder RN, Partch CL. 2017. Animal cryptochromes: divergent roles in light perception, circadian timekeeping and beyond. Photochem Photobiol. 93:128–140. doi:10.1111/php.12677. PMID: 27891621.
- Morgan MN, Dvuchbabny S, Martinez C, Kerr B, Cistulli PA, Cook KM. 2019. The cancer clock is (not) ticking: links between circadian rhythms and cancer. Clock Sleep. 1:435–458. doi:10.3390/clockssleep1040034
- Morris CE, Skalak TC. 2008. Acute exposure to a moderate strength static magnetic field reduces edema formation in rats. Am J Physiol Heart Circ Physiol. 294:H50–H57. doi:10.1152/ajpheart.00529.2007. PMID: 17982018.
- Nagoshi E, Saini C, Bauer C, Laroche T, Naef F, Schibler U. 2004. Circadian gene expression in individual fibroblasts: cell-autonomous and self-sustained oscillators pass time to daughter cells. Cell. 119:693–705. doi:10.1016/j.cell.2004.11.015. PMID: 15550250.
- Nebzydoski SJ, Pozzo S, Nemec L, Rankin MK, Gressley TF. 2010. The effect of dexamethasone on clock gene mRNA levels in bovine neutrophils and lymphocytes. Vet Immunol Immunopathol. 138:183–192. doi:10.1016/j.vetimm.2010.07.017
- Niessner C, Denzau S, Malkemper EP, Gross JC, Burda H, Winklhofer M, Peichl L. 2016. Cryptochrome 1 in retinal cone photoreceptors suggests a novel functional role in mammals. Sci Rep. 6:21848. doi:10.1038/srep21848. PMID: 26898837.
- Oliva R, Jansen B, Benscheidt F, Sandbichler AM, Egg M. 2018. Nuclear Magnetic Resonance affects the circadian clock and hypoxia inducible factor isoforms in zebrafish. Biol Rhythm Res. 50:739–757. doi:10.1080/09291016.2018.1498194.
- Ondrusova K, Fatehi M, Barr A, Czarnecka Z, Long W, Suzuki K, Campbell S, Philippaert K, Hubert M, Tredget E, et al. (2017). Subcutaneous white adipocytes express a light sensitive signaling pathway mediated via a melanopsin/TRPC channel axis. Sci Rep. 7:16332. doi:10.1038/s41598-017-16689-4. PMID: 29180820.
- Peek CB, Levine DC, Cedernaes J, Taguchi A, Kobayashi Y, Tsai SJ, Bonar NA, McNulty MR, Ramsey KM, Bass J. 2016. Circadian clock interaction with HIF1α mediates oxygenic metabolism and anaerobic glycolysis in skeletal muscle. Cell Metab. 25:86–92. doi:10.1016/j.cmet.2016.09.010. PMID: 27773696.
- Pelster B, Egg M. 2015. Multiplicity of hypoxia-inducible transcription factors and their connection to the circadian clock in the zebrafish. Physiol Biochem Zool. 88:146–157. doi:10.1086/679751
- Pelster B, Egg M. 2018. Hypoxia-inducible transcription factors in fish: expression, function and interconnection with the circadian clock. J Exp Biol. 221:jeb163709. doi:10.1242/jeb.163709
- Perl K, Ushako K, Pozniak Y, Yizhar-Barnea O, Bhonker Y, Shivatzki S, Geige T, Avraham KB, Shamir R. 2017. Reduced changes in protein compared to mRNA levels across non-proliferating tissues. BMC Genom. 18. doi:10.1186/s12864-017-3683-9.
- Portaluppi F, Smolensky MH, Touitou Y. 2010. Ethics and methods for biological rhythm research on animals and human beings. Chronobiol Int. 27:1911–1929. doi:10.3109/07420528.2010.516381
- Preitner N, Damiola F, Luis Lopez M, Zakany J, Duboule D, Albrecht U, Schibler U. 2002. The orphan nuclear receptor REV-ERBα controls circadian transcription within the positive limb of the mammalian circadian oscillator. Cell. 110:251–260. doi:10.1016/S0092-8674(02)00825-5
- Rose NS, LaRocque JJ, Riggall AC, Gosseries O, Starrett MJ, Meyering EE, Postle BR. 2016. Reactivation of latent working memories with transcranial magnetic stimulation. Science. 354:1136–1139. doi:10.1126/science.aah7011. PMID: 27934762.
- Sandbichler AM, Jansen B, Peer BA, Paulitsch M, Pelster B, Egg M. 2018. Metabolic plasticity enables circadian adaptation to acute hypoxia in zebrafish cells. Cell Physiol Biochem. 46:1159–1174. doi:10.1159/000489058.
- Schulten K, Swenberg C, Weller A. 1978. A biomagnetic sensory mechanism based on magnetic field modulated coherent electron spin motion. Z Phys Chem. 111:1–5. doi:10.1524/zpch.1978.111.1.001
- Shearman LP, Sriram S, Weaver DR, Maywood ES, Chaves I, Zheng B, Kume K, Lee CC, van der Horst GT, Hastings MH, et al. 2000. Interacting molecular loops in the mammalian circadian clock. Science. 288:1013–1019. doi:10.1126/science.288.5468.1013. PMID: 10807566.
- Sherrard RM, Morellini N, Jourdan N, El-Esawi M, Arthaut L-D, Niessner C, Rouyer F, Klarsfeld A, Doulazmi M, Witczak J, et al. (2018). Low-intensity electromagnetic fields induce human cryptochrome to modulate intracellular reactive oxygen species. PLoS Biol. 16:e2006229. doi:10.1371/journal.pbio.2006229. PMID: 30278045.
- So AY, Bernal TU, Pillsbury ML, Yamamoto KR, Feldman BJ. 2009. Glucocorticoid regulation of the circadian clock modulates glucose homeostasis. Proc Natl Acad Sci USA. 106:17582–17587. doi:10.1073/pnas.0909733106. PMID: 19805059.
- Sousa JC, Magalhaes-Marques KK, da Silveira Cruz-Machado S, Moraes MN, Castrucci AML. 2017. Dexamethasone modulates nonvisual opsins, glucocorticoid receptor, and clock genes in Danio rerio ZEM-2S cells. Biomed Res Int. 2017:8459385. doi:10.1155/2017/8459385. PMID: 28589149.
- Tamai TK, Young LC, Whitmore D. 2007. Light signaling to the zebrafish circadian clock by cryptochrome 1a. Proc Natl Acad Sci USA. 104:14712–14717. doi:10.1073/pnas.0704588104. PMID: 17785416.
- Vadala M, Morales‐Medina JC, Vallelunga A, Palmieri B, Laurino C, Iannitti T. 2016. Mechanisms and therapeutic effectiveness of pulsed electromagnetic field therapy in oncology. Cancer Med. 5:3128–3139. doi:10.1002/cam4.861. PMID: 27748048.
- Vallone D, Lahiri K, Dickmeis T, Foulkes NS. 2005. Zebrafish cell clocks feel the heat and see the light! Zebrafish. 2:171–187. doi:10.1089/zeb.2005.2.171. PMID: 18248192.
- Vanderstraeten J, Burda H, Verschaeve L, De BC. 2015. Could magnetic fields affect the circadian clock function of cryptochromes? Testing the basic premise of the cryptochrome hypothesis (ELF magnetic fields). Health Phys. 109:84–89. doi:10.1097/HP.0000000000000292. PMID: 26011501.
- Vanderstraeten J, Gailly P, Malkemper EP. 2020. Light entrainment of retinal biorhythms: cryptochrome 2 as candidate photoreceptor in mammals. Cell Mol Life Sci. 77:875–884. doi:10.1007/s00018-020-03463-5. PMID: 31982933.
- Vanderstraeten J, Verschaeve L, Burda H, Bouland C, De BC. 2012. Health effects of extremely low-frequency magnetic fields: reconsidering the melatonin hypothesis in the light of current data on magnetoreception. J Appl Toxicol. 32:952–958. doi:10.1002/jat.2761. PMID: 22696437.
- Vatine G, Vallone D, Gothilf Y, Foulkes NS. 2011. It’s time to swim! Zebrafish and the circadian clock. FEBS Lett. 585:1485–1494. doi:10.1016/j.febslet.2011.04.007. PMID: 21486566.
- Vaughan ME, Wallace M, Handzlik MK, Chan AB, Metallo CM, Lamia KA. 2020. Cryptochromes suppress HIF1α in muscles. iScience. 23:101338. doi:10.1016/j.isci.2020.101338. PMID: 32683313.
- Vincenzi F, Ravani A, Pasquini S, Merighi S, Gessi S, Setti S, Cadossi R, Borea PA, Varani K. 2017. Pulsed electromagnetic field exposure reduces hypoxia and inflammation damage in neuron-like and microglial cells. J Cell Physiol. 232:1200–1208. doi:10.1002/jcp.25606. PMID: 27639248.
- Vogel C, Marcotte EM. 2012. Insights into the regulation of protein abundance from proteomic and transcriptomic analyses. Nat Rev Genet. 13:227–232. doi:10.1038/nrg3185
- World Health Organization. 2007. Extremely low frequency fields. Environmental Health Criteria Monograph no. 238. Geneva: WHO.
- Wu Y, Tang D, Liu N, Xiong W, Huang H, Li Y, Ma Z, Zhao H, Chen P, Qi X, et al. 2016. Reciprocal regulation between the circadian clock and hypoxia signaling at the genome level in mammals. Cell Metab. 25:73–85. doi:10.1016/j.cmet.2016.09.009. PMID: 27773697.
- Zoltowski BD, Chelliah Y, Wickramaratne A, Jarocha L, Karki N, Xu W, Mouritsen H, Hore PJ, Hibbs RE, Green CB, et al. 2019. Chemical and structural analysis of a photoactive vertebrate cryptochrome from pigeon. Proc Natl Acad Sci USA. 116:19449–19457. doi:10.1073/pnas.1907875116. PMID: 31484780.