
ABSTRACT
Consumer-grade, multi-sensor, rest-activity trackers may be powerful tools, to help optimize rest-activity management in shiftwork populations undergoing circadian misalignment. Nevertheless, performance testing of such devices under field conditions is scarce. We previously validated Fitbit Charge 2TM against home polysomnography and now evaluated the potential of this device to document differences in rest-activity behavior, including sleep macrostructure, in first-responder shift workers in an operational setting. We continuously monitored 89 individuals (54% females; mean age: 33.9 ± 7.7 years) for 32.5 ± 9.3 days and collected 2,974 individual sleep episodes scattered around the clock. We stratified the study participants according to their self-reported circadian preference on the reduced Horne-Östberg Morningness-Evening Questionnaire (rMEQ; the scores from 4 participants were missing). Fitbit estimates of sleep duration, wakefulness after sleep onset (WASO), REM sleep percentage in the first NREM-REM sleep cycle, and REM sleep latency formed approximately sinusoidal oscillations across 24 hours. Generalized additive mixed model analyses revealed that the phase position of sleep duration minimum was delayed by 2.8 h in evening types (ET; rMEQ ≤ 11; n = 20) and by 2.6 h in intermediate types (IT; 11 < rMEQ < 18; n = 45) when compared to morning types (MT; rMEQ ≥ 18; n = 20). Similarly, the phase position of WASO was delayed by 2.7 h in ET compared to MT. While nocturnal sleep duration did not differ among the three groups, sleep episodes during the biological day decreased in duration from ET to IT to MT. Together, the findings support the notion that a consumer-grade, rest-activity tracker allows estimation of behavioral sleep/wake cycles and sleep macrostructure in shift workers under naturalistic conditions that are consistent with their self-reported chronotype.
Introduction
With the progressing development of 24/7 societies, more and more people are forced to perform shift work. Many shift workers experience circadian misalignment, such that neither active nor rest behaviors can be performed during their optimal circadian windows of opportunity. Circadian misalignment may manifest itself in increased sleepiness and impaired cognitive performance (Chellappa et al. Citation2018), reduced sleep quality, shorter sleep duration and increased sleep disruption (Czeisler et al. Citation1980b), as well as a large variety of adverse health outcomes when compared to normal sleep-wake schedules (Sletten et al. Citation2020). Accumulating evidence demonstrates that individual factors contribute to the degree of sleep impairment associated with shift work. One of these factors is chronotype (Booker et al. Citation2018). Chronotype describes the robust, trait-like inter-individual differences in diurnal preferences on a continuum from ‘eveningness’ to ‘morningness’ (Adan et al. Citation2012; Horne and Östberg Citation1977) and can be reliably determined with self-report questionnaires, such as the reduced Morningness-Eveningness Questionnaire (rMEQ) (Adan and Almirall Citation1991; Di Milia et al. Citation2013). Systematic review of the literature indicates that morning-type shift workers have poorer sleep quality than evening-type shift workers (Booker et al. Citation2018). Nevertheless, most available studies rely on self-report questionnaires and objective estimates of sleep quality in operational settings are lacking. Such measurements would be helpful to inform individually tailored shift work schedules to minimize circadian misalignment-induced sleep disruption.
Seminal laboratory experiments under strictly controlled conditions have elucidated that human sleep characteristics vary as a function of circadian phase (Czeisler et al. Citation1980a, Citation1980b; Zimmerman et al. Citation1980). More specifically, in an environment free of external time-cues, the number of times individuals elected to initiate bedrest increased as core body temperature decreased, with bedrest number maximum occurring in phase with temperature minimum. Time asleep was longest at body temperature minimum and shortest at temperature maximum. At the temperature cycle maximum, the proportion of REM sleep approached zero, whereas the opposite pattern was the case at the temperature minimum. Latencies to REM sleep were shortest just after occurrence of temperature minimum and longest near temperature maximum. Occurrence of REM sleep was advanced and sleep latencies in day sleep episodes were longer in morning-type when compared to evening-type individuals (Kerkhof and Lancel Citation1991).
We recently validated Fitbit Charge 2TM sleep and heart rate estimates against polysomnography in shift workers at home and concluded that this multi-sensor wearable can provide reasonably accurate mean sleep values under naturalistic conditions (Stucky et al. Citation2021). The current work aimed to elucidate whether prolonged rest-activity monitoring with Fitbit Charge 2TM in an operational setting would allow to objectively document diurnal variations in sleep macrostructure in emergency medical rescue workers and law enforcement personnel. We took advantage of these professions’ typical work requirements, to examine the occurrence of sleep at various clock times of the day and night. We expected to observe more sleep episodes of longer duration and little disruption at favorable circadian phases compared to sleep episodes at unfavorable circadian phases. Furthermore, we hypothesized that rest-activity patterns and estimated sleep macrostructure would vary as a function of chronotype, such that sleep variables regulated by the circadian clock would be advanced in individuals with morning activity preference when compared to individuals with evening activity preference. Thus, this work contributes to the critical evaluation of the usefulness of an inexpensive, easy-to-use tool, to objectively monitor sleep quality in personnel performing shift work.
Methods
We recruited a total of 89 emergency medical rescue workers (n = 61), police officers (n = 25) and emergency doctors (n = 3) of both sexes (females n = 48) and various ages (age: 33.85 ± 7.73 years) from urban locations in the greater Zurich area, Switzerland. Volunteers contributed to a larger study investigating sleep and resilience to psychological stress and trauma conducted from July 2017 through November 2019. They were recruited by informational media, as well as e-mail and presentations at shift change. All participants provided written informed consent prior to participation. The study protocol and all experimental procedures were approved by the Ethics Commission of the Canton of Zurich (KEK identification number: 2016–01357) and carried out in accordance with the Declaration of Helsinki. All participants fulfilled inclusion criteria of an age between 18 and 65 years, body mass index (BMI) ≤ 25 (or if exceeding a BMI of 26, no presence of sleep problems, e.g., sleep breathing disorders, were reported), employment in one of two selected emergency rescue stations and one police station, possession of a smart phone and command of the German language. Participants were excluded based on the presence of a neurological disorder diagnosis or head injury, reported consumption of > 5 alcoholic beverages per week or if a urine drug screen (Drug-Screen Multi 12-AE, Nal von Minden GmbH, Regensburg, DE) indicated drug abuse. All participants were shift workers and shift schedules differed between the professions. Individual work schedules could not be examined. Emergency medical rescue workers (including emergency doctors) worked in cycles of two 12-hour day shifts followed by two 12-hour night shifts, interspersed with a day off, concluded by four days off. Police officers worked on four subsequent days with varying sleep and rest times, followed by two days off.
Experimental protocol
The experimental protocol consisted of one month of continuous monitoring of wrist-derived rest-activity behavior including sleep, yielding 2,974 individual sleep episodes initiated at varying clock times throughout the day and night. We administered validated German versions of questionnaires to assess lifestyle, psychological variables, chronotype, and sleep quality. Participants were paid CHF 50 for their participation and provided with an individualized sleep report based on their own data, which was explained to them by a study staff member at debriefing.
Morningness-Eveningness Questionnaire – A reduced scale
Chronotype was assessed by the Horne-Östberg Morningness-Eveningness Questionnaire – a Reduced Scale (rMEQ) (Adan and Almirall Citation1991). This scale consists of five items of the original 19 questionnaire items of the MEQ (Horne and Ostberg Citation1976). It correlates strongly (r = 0.92, p < .01) with the original MEQ with high reliability and convergent validity (Adan and Almirall Citation1991; Caci et al. Citation2009; Chelminski et al. Citation2000). The rMEQ was chosen over the original MEQ in this study in the interest of minimizing burden for participants. The rMEQ data from four study participants could not be included in our analysis due to missing data. We adopted the cutoff scores of the validated German version of the rMEQ (Randler Citation2013), to form three chronotype groups: evening type (ET; rMEQ ≤ 11; n = 20), intermediate type (IT; 11 < rMEQ < 18; n = 45) and morning type (MT; rMEQ ≥18; n = 20).
Pittsburg Sleep Quality Index (PSQI)
Individuals completed a validated German version of the Pittsburg Sleep Quality Index (PSQI) (Backhaus et al. Citation2002) at the beginning of their study month and again at the end. Briefly, scores range from 0 to 21, with higher scores indicating worse sleep quality. A score above 5 indicates reduced sleep quality (Buysse et al. Citation1989).
Multi-sensor wearable rest-activity monitoring
A commercially available, multi-sensor fitness tracker (Fitbit Charge 2TM, Fitbit Inc., San Francisco, CA, USA), which records wrist activity by means of accelerometry and heart rate (HR) by means of photoplethysmography (PPG), was worn around-the-clock by all participants on their non-dominant wrist for one month (32.45 ± 9.29 days). A Fitbit proprietary algorithm which utilizes wrist-activity and PPG data outputs one of two types of sleep data per recorded sleep episode: (1) sleep “stages” data (“deep,” “light,” “REM” and “wake”) with a resolution of 30 s or (2) sleep “classic” data (“sleep,” “restless” and “wake”) with a resolution of 60 s. The sleep “classic” data are generated instead of sleep “stages” data when battery charge is critically low, the sleep episode lasts for less than 3 h or when contact to the PPG sensor is insufficient (Fitbit Inc Citation2020). The device detects and records all sleep episodes, including naps, that are at least one hour long (Fitbit Inc Citation2020). The sleep recording sensitivity in the settings of the individual online Fitbit accounts of participants was set to “sensitive.” Comparison with “normal” sensitivity revealed no impact on data output, when these two different setting options were verified. Sleep onset and offset times were generated by Fitbit per sleep episode.
In a subsample of 61 individuals, we recorded nocturnal sleep with ambulatory polysomnography (PSG) during two nights at home while simultaneously wearing the Fitbit Charge 2TM, permitting its validation against the gold standard of PSG (Stucky et al. Citation2021). The data suggest that Fitbit’s “deep” sleep in the “stages” datatype may capture PSG-defined N3 sleep, whereas the “light” sleep stage may correspond to PSG-defined N1 + N2 sleep stages. Because neither information nor raw data are provided by Fitbit, it remained unclear what PSG sleep “restless” in the “classic” datatype refers to. In general, the Fitbit sleep staging needs to be treated with caution. While sleep onset and sleep offset times were generally detected with high confidence, it is likely that the proprietary algorithm misses brief PSG-defined stage changes and stage interruptions (Stucky et al. Citation2021).
Data analyses and statistics
All statistical analyses of Fitbit data were carried out in the statistical programming environment R (version 4.0.0). For the group comparisons of demographic data, we applied the ANOVA test (R function aov) for continuous data, while we used for the Chi-Squared test (R function chisq.test) for frequency data. A significance level of p < .05 was considered statistically significant.
We conducted the diurnal analyses using the mgcv R package (version 1.8–31). Non-linear diurnal modulations over time of day and the repeatedly measured sleep episodes per individual suggested the use of generalized additive mixed models (GAMMs). We used suitable distribution families and link functions to model individuals’ diurnal modulations over time. In particular, the non-symmetrically distributed Gamma family was applied to REM sleep percentage in the first NREM-REM sleep cycle, REM sleep latency and wakefulness after sleep onset (WASO). For sleep duration, the Gaussian family with a log link function was selected. Only for WASO the residual assumptions were only partially fulfilled. This is due to the bimodal nature of the distribution of WASO, which might originate from an uncorrected or unknown factor or from the way Fitbit’s algorithm operates.
We calculated the confidence intervals of diurnal data via posterior simulation on the model with 50,000 random samples, which can be done with the simulate function in the gratia package of R (version 0.4.1). Here, skewedness is computed as the difference in slopes between the midpoints of the maximum to minimum and minimum to maximum. The computed confidence intervals are simultaneous, as mentioned in Ruppert et al. (Citation2003). Therefore, these intervals can effectively overcome the multiple-testing issue in a continuous fashion. Our code for computing the reported confidence intervals is a version of the confint function in gratia. The gratia::confit function calculates simultaneous confidence intervals for the first derivatives of a fitted generalized additive model and not for the differences between two groups, nor does it provide simultaneous intervals for the fitted curves. We thus modified the code slightly to sample differences between the fitted curves of the chronotypes as well as sampling the fitted curves themselves, instead of the first derivatives.
We corrected all models with linear terms for sex and age. The smooth term per sleep onset time and chronotype is a cyclic cubic regression spline with knots at hour 0 and 24, to ensure a continuous transition around midnight. We limited the smooth terms to 7 degrees of freedom to avoid overfitting. The plots always display the model estimate for a female with age 23 years, the minimum age in the whole sample.
We computed the variables REM sleep percentage in the first NREM-REM sleep cycle (REM%) and REM sleep latency (RL) in accordance with criteria as delineated in Feinberg and Floyd (Citation1979). For WASO, we took sleep onset and offset times from Fitbit, except when the first stage after sleep onset or the last stage before sleep offset was labeled as “wake,” which is a peculiarity of the Fitbit algorithm that sometimes occurs. In the latter case, we omitted these short wake episodes and adjusted the sleep onset and offset times accordingly. We only included the fine-grained “stages” data to the REM sleep calculations. For WASO, we considered both the “stages” and “classic” data, such that we combined the “classic” data variable “restless” with “wake,” in accordance with prevailing Fitbit guidelines (Fitbit Inc Citation2020). Finally, we computed the RL decile density plot with bootstrapped confidence intervals using 1,000 bootstrap samples and multiple-testing correction as described in Rousselet et al. (Citation2017) and implemented in the rogme R package (version 0.2.1).
Results
Distribution of rest-activity behavior
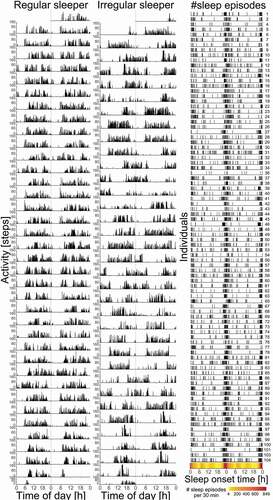
Although the majority of sleep episodes was initiated between the hours of about 21:00–02:00, there is considerable variability in sleep timing between individuals. shows Fitbit ‘steps’ illustrating the rest-activity behavior in two representative study participants across the entire recording period. Whereas there is a pattern of rest activity behavior that is relatively uniform and occurring at regular intervals in the “Regular sleeper,” the rest-activity behavior of the “Irregular sleeper” is in contrast erratic, with periods of sleep and wakefulness less rhythmically patterned over the course of the month-long study period. Nevertheless, the PSQI scores of both the “Regular sleeper” and “Irregular sleeper” indicated good sleep quality (PSQI scores ≤ 5) when surveyed at both the start and end of their study months.
Figure 1. Organization of rest-activity behavior and sleep times. The left two columns display the double-plotted raster actograms derived from Fitbit “steps” data over the course of the study month showing the rest-activity behavior of a “regular sleeper” (left) and an “irregular sleeper” (middle). Amplitude (number of “steps” per minute) is plotted on the vertical axis, whereas “Time of day” in hours is plotted on the horizontal axis. The right-most panel (“#sleep episodes”) displays the timing of habitual sleep occurring at multiple clock times of the day and night derived from Fitbit sleep onset times in a double plotted raster format for all participants (n = 89). The vertical axis displays all individuals’ data sets, whereas the horizontal axis displays “Sleep onset time” in hours. The number of sleep episodes per 30 minutes is displayed beneath and is color-coded to highlight density of sleep onset occurrence
Distribution of chronotypes
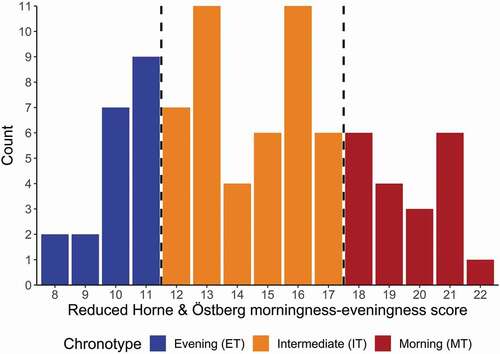
The study sample of 85 individuals was comprised of 1 definite MT (1.1%), 19 moderate MT (22.4%), 45 IT (52.9%) and 20 moderate ET (23.5%). There were no definite ET in our sample. We combined the moderate and definite MT into one single group ().
Figure 2. Distribution of morningness – eveningness scores (n = 85) derived from the German version of the reduced Horne-Östberg Morningness-Eveningness Questionnaire (rMEQ) (Randler Citation2013). The rMEQ scores are plotted on the horizontal axis and their colors correspond to the rMEQ-derived chronotypes labeled beneath. The number (“Count”) of individuals per score is plotted on the vertical axis. The dashed vertical lines delineate the Evening Types (rMEQ score ≤ 11; n = 20), Intermediate Types (11 < rMEQ score < 18; n = 45) and Morning Types (rMEQ score ≥ 18; n = 20)
A summary of selected demographic variables is presented in . The MT were on average 5.4 years older than the IT, and the IT were 2.9 years older than the ET. Age weakly correlated with rMEQ score, such that rMEQ score became higher (indicating increasing morningness) as age increased (rs = 0.35, p < .001). Experience in shift work also differed among the groups, such that MT had 6.6 years more shift work experience than ET (p = .0006). Most shift work experience in our sample appears to have been garnered from the current profession since these two variables correlate strongly (n = 78; rs = 0.71, p < .0001). The 4.95 year longer experience in the profession of MT compared to ET revealed a trend (p = .0615). The three groups differed slightly in sports frequency (p = .0118) indicating that ET may exercise less frequently than MT. We found no differences with respect to sex, BMI, and frequency of beverages consumed containing alcohol or caffeine. The distribution of emergency medical rescue workers (including emergency doctors) and police officers did not differ between ET, IT and MT (p = .1991). Subjective sleep quality (measured by the PSQI), posttraumatic stress (PCL-5), and perceived stress (PSS-10) assessed at the start and end of the study month did not differ between the groups, except for a trend in PCL-5 at the start of the study (p = .0891), which was not observed anymore at the end of the study (p = .3562).
Table 1. Demographic characteristics
Fitbit-derived estimates of sleep macrostructure
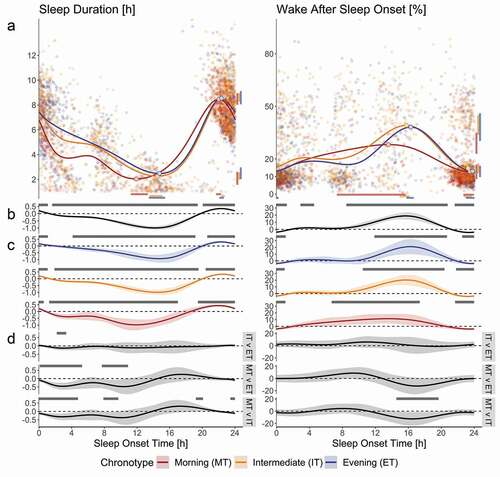
All groups spent roughly 7.5 h in Fitbit-estimated sleep per 24 hours (), yet the occurrence of sleep across the day was not random. We observed approximate diurnal oscillations in the pattern of sleep duration, WASO, REM%, and RL as a function of sleep onset time, as evident from the difference from intercept at many clock times and the occurrence of amplitude maxima and minima. The duration of sleep episodes was typically greatest when sleep was initiated during the night, reaching a maximum mean duration of 8.57 (95% confidence intervals: 8.24, 8.94) h of sleep episodes initiated at 22:26 (22:16, 22:39) and lowest when initiated during the day, with a minimum mean duration of 2.23 (1.94, 2.56) h at 14:56 (14:12, 15:23) (). We observed a significant effect of factor “age” for sleep duration (p < .01), such that sleep duration decreased when age increased. The effect of “age” did not remain significant in the model when the factor “chronotype” was included. The variable WASO revealed the approximate inverse waveshape to that of sleep duration, such that the maximum mean percentage of 40.18% (34.47%, 45.98%) was observed when sleep was initiated at 16:06 (15:39, 16:22), whereas the minimum mean percentage of 14.24% (11.62%, 16.73%) occurred at 23:35 (23:02, 23:54).
Figure 3. Variations in the occurrence and internal organization of sleep across the day derived from Fitbit Charge 2TM sleep data. Morning Type (n = 20; red dots and lines), Intermediate Type (n = 45; orange dots and lines) and Evening Type (n = 20; blue dots and lines) data are plotted for variables ‘Sleep Duration’ (left) and ‘Wake After Sleep Onset’ (right). All plots have time of sleep onset in hours as the horizontal axis. Panel A displays individual data points, their averages (curves), as well as peak and nadir (circles on curves). The vertical axis of ‘Sleep Duration’ displays time in hours, whereas this axis shows percentage of sleep episode for variable ‘Wake After Sleep Onset.’ Confidence intervals for maxima and minima are displayed horizontally beneath and vertically to the right of the figures of panel A (color-coded bars match the respective chronotype). Panels B, C and D display non-linear diurnal modulations over time of day and 95% simultaneous confidence intervals (shaded area around curves); the vertical axes are in arbitrary units; gray bars on top of panels B and C indicate values that differ significantly from intercept (dashed line). Panel B shows data for the entire sample, whereas panel C displays data per chronotype. Panel D shows the differences between the chronotypes, such as indicated on the right; the gray bars on top of the panels indicate the times where the waveshapes differed significantly from one another
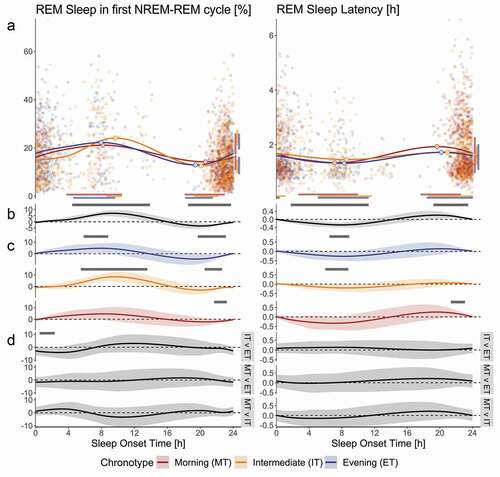
The maximum mean REM% of 21.57% (19.17%, 24.29%) occurred in sleep initiated at 08:56 (06:44, 10:01) h, whereas the minimum mean of 12.91% (9.90%, 15.58%) occurred at 19:41 (18:48, 21:19) h (). The time until the onset of REM sleep varied in the approximate inverse pattern to that of REM%, such that the shortest latencies were observed in sleep episodes during the morning hours, whereas the longest latencies occurred during the evening and nighttime hours. We found the mean minimum of RL of 1.42 (1.23, 1.58) h to occur at 08:02 (04:54, 10:49) h, whereas the mean maximum of 1.72 (1.54, 1.94) h occurred at 19:54 (18:10, 00:08) h.
Figure 4. Variations in the occurrence and internal organization of REM sleep across the day derived from Fitbit Charge 2TM sleep data. Morning Type (n = 20; red dots and lines), Intermediate Type (n = 45; orange dots and lines) and Evening Type (n = 20; blue dots and lines) data are plotted for variables ‘REM Sleep Percentage in first NREM-REM cycle’ (REM%; left) and ‘REM Sleep Latency’ (RL; right). All plots have time of sleep onset in hours as the horizontal axis. Panel A displays individual data points, their averages (curves), as well as peak and nadir (circles on curves). The vertical axis of ‘REM%’ displays time as a percentage of sleep episode, whereas for variable ‘RL’ the vertical axis shows time in hours. Confidence intervals for maxima and minima are displayed horizontally beneath and vertically to the right of the figures of panel A (color-coded bars match the respective chronotype). Panels B, C and D display non-linear diurnal modulations over time of day and simultaneous confidence intervals (shaded area around curves); the vertical axes are in arbitrary units; gray bars on top of panels B and C indicate that values differ significantly from intercept (dashed line). Panel B shows data for the entire sample, whereas panel C displays data per chronotype. Panel D shows the differences between the chronotypes, such as indicated on the right; the gray bars on top of the panels indicate the times where the waveshapes differed significantly from one another
Differences in Fitbit-derived estimates of sleep macrostructure among chronotypes
Chronotype preference influenced the phase of mean sleep duration minimum, such that MT achieved a mean minimum sleep duration of 2.04 (1.57, 2.61) h initiated at 11:54 (11:14, 13:18) compared to IT, who reached a mean minimum of 2.27 (1.98, 2.56) h at 14:28 (13:31, 15:06) and to ET, reaching 2.48 (2.03, 2.96) h at 14:43 (13:26, 15:24) (; panel A, left column). The chronotypes distributed the duration of their sleep episodes differently across the day as a function of sleep onset time, such that compared to MT, ET showed average sleep episodes of greater duration when sleep was initiated between 00:06 and 05:17 and between 07:42 and 10:54. The sleep durations of IT were estimated to mostly lie between MT and the ET. In particular, IT displayed on average greater sleep durations compared to MT in the sleep onset time windows 23:27–04:47 and 07:54–09:43, whereas IT obtained less sleep than MT when sleep was initiated between 19:13 and 20:05. On the other hand, IT showed reduced sleep duration when compared to ET between 02:11 and 03:20 sleep onset time (; panel D, left column). As for WASO, the estimated maxima between ET and MT differed in time of day (; panel A, right column). The ET reached a maximum of 38.19 (30.31, 46.13) % at 16:16 (15:46, 16:38). The estimated maxima of 28.21 (23, 34.95) % occurred in MT at 13:34 (07:19, 15:40). The MT displayed lower average WASO compared to IT between sleep onset times 14:34–19:41. A similar time window just failed to reach significance for WASO when ET was compared to MT (; panel D, right column). The ET displayed larger REM% compared to IT in the sleep onset time window 00:30–02:18. The phase of the mean sleep duration maximum, WASO minimum, as well as the diurnal variation in mean RL and all other aspects of the diurnal variation in REM% did not differ between the three groups.
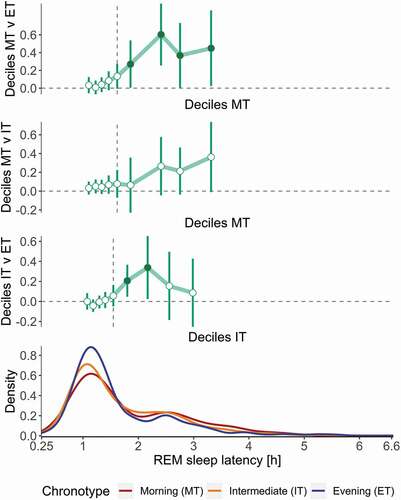
Nevertheless, the shape of the distributions of RL differed among the chronotypes, such that the 6th – 9th deciles of RL were delayed on average in MT compared to ET, reflected by greater weight in the distribution that is driven by more frequent outliers or increased first REM sleep episodes (). Similarly, the 6th and 7th deciles of RL were delayed in IT compared to ET.
Figure 5. Density distribution of REM sleep latencies in morning (MT, n = 20), intermediate (IT, n = 45) and evening type (ET, n = 20) study participants. The top three panels display the decile difference among MT, IT and ET. Circles represent average decile differences, whereas whiskers show bootstrapped confidence intervals corrected for multiple comparison. The dashed vertical line in the top two panels represents the median in MT; in the 3rd panel it represents the median in IT. The bottom panel describes the density functions of RL by chronotype (MT = red, IT = orange, ET = blue). The horizontal axis is shared by all panels and shows RL in hours. Compared to ET, the RL distributions in IT and MT display more weight in potential missed first REM sleep episodes (RL > 2 h)
Discussion
In this study, we used a consumer-grade, multi-sensor wearable to objectively estimate rest-activity patterns and sleep macrostructure in shift worker populations of emergency medical rescue workers and law enforcement personnel longitudinally under naturalistic conditions. Based on nearly 3,000 sleep episodes initiated at clock times across the day and night, we demonstrate sleep macrostructures that are similar to what would be expected based on prior literature showing the impacts of circadian and homeostatic regulatory processes on sleep occurring at varying circadian times. Consistent with our hypotheses, we observed fewer sleep episodes and of shorter duration at unfavorable phase positions and these sleep episodes were characterized by greater disruption compared to sleep initiated at favorable phase positions. More specifically, 40.25% of all sleep episodes were initiated by individuals irrespective of chronotype between 22:00 and 24:00, whereas only 1% was initiated between 18:00 and 20:00. Sleep episodes of the greatest duration were initiated between 20:00 and 22:00, whereas the shortest sleep durations were initiated between 16:00 and 18:00. Sleep was most disrupted between 16:00 and 18:00 and least disrupted between 22:00 and 02:00, reflected in the highest and lowest proportions of WASO observed in these respective time periods. These findings correspond closely to what models of the wake maintenance zone evoked by oscillatory processes of the endogenous circadian pacemaker and homeostatic regulation of sleep propensity would predict (Lavie Citation1986; Strogatz et al. Citation1987).
When bedrest occurs on the ascending slope of the core body temperature rhythm, then sleep propensity is low and sleep continuity is severely disrupted (Dijk and Czeisler Citation1994). We captured the proportion of REM sleep during the first NREM-REM sleep cycle and latencies to the first REM sleep episode to estimate the timing of REM sleep that is coupled tightly to the core body temperature rhythm (Czeisler et al. Citation1980b). The REM% approximated a diurnal oscillatory pattern, such that proportions were highest between 08:00 and 10:00 and lowest between 18:00 and 22:00. Sleep propensity and sleep duration were lowest and WASO percentage was highest on the descending slope of the REM% curve in our sample. The maximum of WASO in MT displayed a large confidence interval, i.e., it occurred between 07:19 and 15:40 and could only be estimated with rather high uncertainty. Latencies to REM sleep onset were shortest during morning hours of 06:00 to 08:00 and longest during the evening and nighttime hours of 20:00 to 22:00. Taken together, the curves of sleep characteristics show the expected approximate diurnal timing based on reports in the literature under imposed ultradian activity-bedrest and strictly controlled conditions (Czeisler et al. Citation1980b; Gonnissen et al. Citation2013).
The MT attained their sleep duration minimum earlier than IT and ET. This finding indicates that the prolonged (~ 30 days and nights) estimation of sleep-wake patterns with a commercially available multi-sensor wearable may be useful to objectively estimate sleep characteristics in shift work populations under naturalistic conditions. ET slept appreciably longer than IT and IT slept longer than MT during sleep episodes initiated in nighttime and morning hours. This was not the case in a brief window around 20:00 sleep onset time. In this time window, in which only a few sleep episodes were initiated, MT displayed longer sleep durations than IT. In accordance with prior conclusions almost exclusively based on self-report questionnaires, the current objective data suggest that ET may indeed adapt better overall to shift work than MT and IT (Booker et al. Citation2018). The ET chronotype group appears to scavenge sleep whenever their occupational demands, social opportunities and intrinsic circadian and homeostatic processes permitted. By contrast, MT, and to some degree also IT, may consolidate their bed rest and sleep more at nighttime and less during the daytime. This could indicate that ET in our sample were more flexible in circadian sleep-wake timing than the IT and MT. Alternatively, the occurrence of sleep episodes of greater duration throughout the daytime could suggest higher homeostatic sleep pressure in ET compared to IT and MT, who appear to be able to obtain the sleep they require in episodes clustered around conventional sleeping times at night. Electroencephalographic recordings indicate that sleep homeostasis dissipates and accumulates faster during sleep and wakefulness in some individuals with morning preference when compared to individuals with an evening preference (Mongrain et al. Citation2006). Accelerated dissipation and accumulation of homeostatic sleep propensity in some individuals with morning activity preference would fit the pattern of reduced sleep duration during daytime and may also be consistent with the higher proportion of prolonged REM sleep latencies in MT individuals (). Nevertheless, these differences need to be interpreted with caution because the chronotype groups differed in age. A previous study conducted under controlled laboratory conditions reported reduced mean daytime sleep propensity and shorter daytime sleep durations in older adults (> 60 years) when compared to younger adults (~ 22 years) (Klerman and Dijk Citation2008). Although individuals of the MT group were on average roughly 8 years older than those of the ET group, only five individuals were older than 50 years. Thus, a pronounced effect of advanced age on daytime sleep propensity was predictably absent. In addition, age was corrected for in the statistical analyses.
The estimated amplitudes of the diurnal variation in the REM sleep variables assessed were smaller and the estimation of maxima and minima less reliable than for sleep duration and WASO. This may be due to the relatively low number of observations between ~ 18:00 and 22:00, likely due to the influence of the wake maintenance zone (Dijk and Czeisler Citation1994) although social pressures cannot be ruled out. Such influences may have obscured subtle differences between the three chronotype groups. Alternatively, the proprietary sleep-scoring algorithm may have been uncertain in reliably recognizing REM sleep variables (Stucky et al. Citation2021). The hierarchical clustering and density distribution of the REM sleep latencies () suggest a high proportion of missed REM sleep episodes, with potentially different occurrence rates of missed first REM sleep per chronotype. Validation studies against polysomnography at different circadian phases are needed to evaluate whether Fitbit Charge 2TM is reliable and accurate in quantifying diurnal REM sleep characteristics under natural conditions.
The limitations of the current study also need to be mentioned. The rMEQ is not a shiftwork-specific instrument, and information on the individual work and rest schedules of the study participants is not available. Recent data suggest that the effect of chronotype on sleep duration and napping behavior during rotating shift work in police officers is modulated by the shift type (Kervezee et al. Citation2021). We did not distinguish between day and night shifts nor between main sleep episodes and naps. The Fitbit algorithm records all sleep episodes that are at least one hour long (Fitbit Inc Citation2020). Thus, sleep episodes shorter than one hour may not have been recorded and do not contribute to the analyses. Furthermore, it is not known whether a sleep episode of less than 7–8 h was a nap and deliberately short, an unsuccessful attempt at a main sleep episode, or a consequence of the work pattern. For example, it cannot be excluded that the difference in phase position of minimal sleep duration may be impacted by shift schedules (Kervezee et al. Citation2021). Given these limitations, we are bound to cautious, probabilistic statements. Masking factors such as light exposure, time cues, meals, occupational obligations, social opportunities and intake of psychoactive substances such as caffeine and alcohol may also have influenced the findings. All these factors could have magnified variability in the data and reduced the signal-to-noise ratio yet are common under naturalistic conditions.
On the other hand, the collection of rest-activity behavior continuously and around-the-clock over one month in a naturalistic environment yielded valuable data. The prospective design and naturalistic conditions boost the external validity of our findings that are typically lacking in cross-sectional epidemiological studies and controlled laboratory experiments. Research with validated, multi-sensor wearable devices should continue to attempt building a bridge between laboratory experiments and naturalistic studies with objective estimates of cardiovascular, metabolic, endocrine and other disease markers in at-risk populations such as shift workers. Some experimental evidence indicates that restructuring shift work schedules in accord with chronotype may benefit health, sleep quality and psychological wellbeing of workers (Hittle and Gillespie Citation2018; Juda et al. Citation2013; Vetter et al. Citation2015). The possibility to non-obtrusively document objective sleep quality and physiological measures in operational settings could provide the bases to implement individual work schedules that maximize sleep and circadian-related health in shift workers of different circadian preference.
Acknowledgements
We thank Maria Dimitriu, Giulia Haller, Zilla Huber, Zora Kaiser, Nora Krucker, Josefine Meier, Gioia Peterhans, Daniel Prossnitz, Sinja Rosemann-Niedrig, Nora Werner, Rafael Wespi, Laura van Bommel and Chantal Wey for assistance with data collection and processing. We wish to thank all participants and staff members of Schutz & Rettung Zürich, Rettungsdienst Winterthur and Stadtpolizei Winterthur.
Disclosure statement
No potential conflict of interest was reported by the author(s).
Additional information
Funding
References
- Adan A, Almirall H. 1991. Horne & Östberg morningess-eveningness questionnaire: a reduced scale. Person Indiv Diff. 12(3):241–253. doi:https://doi.org/10.1016/0191-8869(91)90110-W
- Adan A, Archer SN, Hidalgo MP, Di Milia L, Natale V, Randler C. 2012. Circadian typology: a comprehensive review. Chronobiol Int. 29(9):1153–1175. doi:https://doi.org/10.3109/07420528.2012.719971
- Backhaus J, Junghanns K, Broocks A, Riemann D, Hohagen F. 2002. Test-retest reliability and validity of the Pittsburgh Sleep Quality Index in primary insomnia. J Psychosom Res. 53(3):737–740. doi:https://doi.org/10.1016/S0022-3999(02)00330-6
- Booker LA, Magee M, Rajaratnam SMW, Sletten TL, Howard ME. 2018. Individual vulnerability to insomnia, excessive sleepiness and shift work disorder amongst healthcare shift workers. A systematic review. Sleep Med Rev. 41:220–233. doi:https://doi.org/10.1016/j.smrv.2018.03.005
- Buysse DJ, Reynolds CF, Monk TH, Berman SR, Kupfer DJ. 1989. The Pittsburgh Sleep Quality Index: a new instrument for psychiatric practice and research. Psychiatry Res. 28(2):193–213. doi:https://doi.org/10.1016/0165-1781(89)90047-4
- Caci H, Deschaux O, Adan A, Natale V. 2009. Comparing three morningness scales: age and gender effects, structure and cut-off criteria. Sleep Med. 10(2):240–245. doi:https://doi.org/10.1016/j.sleep.2008.01.007
- Chellappa SL, Morris CJ, Scheer FAJL. 2018. Daily circadian misalignment impairs human cognitive performance task-dependently. Sci Rep. 8(1):3041. doi:https://doi.org/10.1038/s41598-018-20707-4
- Chelminski I, Petros T, Plaud J, Ferraro F. 2000. Psychometric properties of the reduced Horne and Ostberg questionnaire. Pers Individ Dif. 29(3):469–478. doi:https://doi.org/10.1016/S0191-8869(99)00208-1
- Czeisler CA, Weitzman E, Moore-Ede MC, Zimmerman JC, Knauer RS. 1980a. Human sleep: its duration and organization depend on its circadian phase. Science. 210(4475):1264–1267. doi:https://doi.org/10.1126/science.7434029
- Czeisler CA, Zimmerman JC, Ronda JM, Moore-Ede MC, Weitzman ED. 1980b. Timing of REM sleep is coupled to the circadian rhythm of body temperature in man. Sleep. 2(3):329–346. doi:https://doi.org/10.1093/sleep/2.3.329
- Di Milia L, Adan A, Natale V, Randler C. 2013. Reviewing the psychometric properties of contemporary circadian typology measures. Chronobiol Int. 30(10):1261–1271. doi:https://doi.org/10.3109/07420528.2013.817415
- Dijk DJ, Czeisler CA. 1994. Paradoxical timing of the circadian rhythm of sleep propensity serves to consolidate sleep and wakefulness in humans. Neurosci Lett. 166(1):63–68. doi:https://doi.org/10.1016/0304-3940(94)90841-9
- Feinberg I, Floyd T. 1979. Systematic trends across the night in human sleep cycles. Psychophysiology. 16(3):283–291. doi:https://doi.org/10.1111/j.1469-8986.1979.tb02991.x
- Fitbit Inc. 2020. What should I know about sleep stages? [accessed 2020 July 10]. https://help.fitbit.com/articles/en_US/Help_article/2163.
- Gonnissen HK, Mazuy C, Rutters F, Martens EA, Adam TC, Westerterp-Plantenga MS. 2013. Sleep architecture when sleeping at an unusual circadian time and associations with insulin sensitivity. PLoS One. 8(8):e72877. doi:https://doi.org/10.1371/journal.pone.0072877
- Hittle BM, Gillespie GL. 2018. Identifying shift worker chronotype: implications for health. Ind Health. 56(6):512–523. doi:https://doi.org/10.2486/indhealth.2018-0018
- Horne JA, Ostberg O. 1976. A self-assessment questionnaire to determine morningness-eveningness in human circadian rhythms. Int J Chronobiol. 4(2):97–110.
- Horne JA, Östberg O. 1977. Individual differences in human circadian rhythms. Biol Psychol. 5(3):179–190. doi:https://doi.org/10.1016/0301-0511(77)90001-1
- Juda M, Vetter C, Roenneberg T. 2013. Chronotype modulates sleep duration, sleep quality, and social jet lag in shift-workers. J Biol Rhythms. 28(2):141–151. doi:https://doi.org/10.1177/0748730412475042
- Kerkhof GA, Lancel M. 1991. EEG slow wave activity, REM sleep, and rectal temperature during night and day sleep in morning-type and evening-type subjects. Psychophysiology. 28(6):678–688. doi:https://doi.org/10.1111/j.1469-8986.1991.tb01014.x
- Kervezee L, Gonzales-Aste F, Boudreau P, Boivin DB. 2021. The relationship between chronotype and sleep behavior during rotating shift work: a field study. Sleep. 44:4. doi:https://doi.org/10.1093/sleep/zsaa225
- Klerman EB, Dijk DJ. 2008. Age-related reduction in the maximal capacity for sleep - implications for insomnia. Curr Biol. 18(15):1118–1123. doi:https://doi.org/10.1016/j.cub.2008.06.047
- Lavie P. 1986. Ultrashort sleep-waking schedule. III. ‘gates’ and ‘forbidden zones’ for sleep. Electroencephalogr Clin Neurophysiol. 63(5):414–425. doi:https://doi.org/10.1016/0013-4694(86)90123-9
- Mongrain V, Carrier J, Dumont M. 2006. Circadian and homeostatic sleep regulation in morningness-eveningness. J Sleep Res. 15(2):162–166. doi:https://doi.org/10.1111/j.1365-2869.2006.00532.x
- Randler C. 2013. German version of the reduced morningness-eveningness questionnaire (rMEQ). Biol Rhythm Res. 44(5):730–736. doi:https://doi.org/10.1080/09291016.2012.739930
- Rousselet GA, Pernet CR, Wilcox RR. 2017. Beyond differences in means: robust graphical methods to compare two groups in neuroscience. Eur J Neurosci. 46(2):1738–1748. doi:https://doi.org/10.1111/ejn.13610
- Ruppert D, Wand MP, Carroll RJ. 2003. Semiparametric regression. Cambridge: Cambridge University Press.
- Sletten TL, Cappuccio FP, Davidson AJ, Van Cauter E, Rajaratnam SMW, Scheer FAJL. 2020. Health consequences of circadian disruption. Sleep. 43:1. doi:https://doi.org/10.1093/sleep/zsz194
- Strogatz SH, Kronauer RE, Czeisler CA. 1987. Circadian pacemaker interferes with sleep onset at specific times each day: role in insomnia. Am J Physiol. 253(1 Pt 2):R172–178. doi:https://doi.org/10.1152/ajpregu.1987.253.1.R172
- Stucky B, Clark I, Azza Y, Karlen W, Achermann P, Kleim B, and Landolt HP. 2021. Validation of Fitbit Charge 2™ Sleep and Heart Rate Estimates Against Polysomnography in Shift Workers: A Naturalistic Study. J Med Internet Res., in press
- Vetter C, Fischer D, Matera JL, Roenneberg T. 2015. Aligning work and circadian time in shift workers improves sleep and reduces circadian disruption. Curr Biol. 25(7):907–911. doi:https://doi.org/10.1016/j.cub.2015.01.064
- Zimmerman JC, Czeisler CA, Laxminarayan S, Knauer RS, Weitzman ED. 1980. REM density is dissociated from REM sleep timing during free-running sleep episodes. Sleep. 2(4):409–415. doi:https://doi.org/10.1093/sleep/2.4.409.