
ABSTRACT
Dim light melatonin onset (DLMO) is considered the most reliable circadian phase marker in humans. However, the methods to calculate it are diverse, which limits the comparability between studies. Given the key role of DLMO to diagnose circadian rhythm sleep-wake disorders and determine the optimal timing of chronotherapies, the establishment of clear and validated guidelines on the methodology to assess DLMO is very important. We performed a repeatability study (n = 31) and an agreement study (n = 62) in healthy young adults with hourly blood samples collected under dim light conditions (<8 lux) during a chronobiological protocol. We assessed the repeatability of DLMO with three different methods (fixed threshold, dynamic threshold and hockey stick) across two nights and assessed agreement of each method with the mean visual estimation made by four chronobiologists. Analyses included Bland-Altman diagrams, intraclass correlation coefficients and equivalence tests. The repeatability of the four methods across two nights ranged from good to perfect. The agreement study highlighted that the hockey stick showed equivalent or superior performance (ICC: 0.95, mean difference with visual estimation: 5 min) in healthy subjects compared to the dynamic and fixed thresholds. Thanks to its objective nature, the hockey stick method may provide better estimates than the mean of the visual estimations of several raters. These findings suggest that the hockey stick method provides the most reliable estimate of DLMO within the tested methods and should be considered for use in future studies.
Introduction
Melatonin is a hormone known to play an important role in the regulation of the sleep-wake cycle and circadian physiology (Pevet et al. Citation2021). It is produced by the pineal gland at night and its secretion is suppressed by light (Lewy et al. Citation1980). In humans, melatonin is usually undetectable during the day, rises in the evening shortly before usual sleep time, peaks in the middle of the night, and decreases gradually during the early morning to return to baseline levels just after usual wake time. Dim light melatonin onset (DLMO), the time at which melatonin level rises above the baseline under dim light condition, is considered as the most reliable circadian phase marker in humans (Benloucif et al. Citation2005; Lewy and Sack Citation1989). DLMO is an important tool in sleep medicine and chronobiology, notably to diagnose circadian rhythm sleep-wake disorders (CRSWD) (Kilic Huck et al. Citation2019; Keijzer et al. Citation2014), as well as for therapeutic purposes. The treatments of CRSWD aim to phase shift circadian rhythms to allow the patient to sleep and be awake during appropriate periods. The efficacy of bright light therapy or exogenous melatonin administration is known to depend on the patient’s circadian phase. Therefore, accurate DLMO assessment is crucial to administer melatonin and light therapy at an appropriate time relative to individual circadian timing for optimal treatment of CRSWD. Indeed, administration of these treatments at inappropriate times can worsen the medical condition due to phase shifting in the undesired direction. Furthermore, DLMO determination is also used for follow-up purposes to evaluate the therapeutic responses (Pandi-Perumal et al. Citation2007).
Several methods have been used to calculate the DLMO (Benloucif et al. Citation2008). However, to this day, no consensus has been reached on the optimal approach. The most commonly used methods are based on a fixed threshold (Benloucif et al. Citation2008; Lewy et al. Citation1992, Citation1999, Citation1985; Molina and Burgess Citation2011; Nagtegaal et al. Citation1998), which can be problematic in low melatonin secretors, or on a dynamic threshold calculated by the mean of three baseline values + 2 standard deviations (SD) (Voultsios et al. Citation1997), which is impossible to calculate in case of missing or unreliable baseline values. Even though the dynamic threshold method allows for DLMO calculation, even in low melatonin secretors, and takes into account individual baseline levels (Lewy et al. Citation1999; Molina and Burgess Citation2011; Voultsios et al. Citation1997), its results are more variable than the fixed threshold method (Crowley et al. Citation2016; Pullman et al. Citation2012). The hockey stick method, a non-threshold based method, was introduced more recently and seems to be a promising tool (Danilenko et al. Citation2014). However, the estimation provided by this method has been much less studied due to its relative novelty and its relevance for clinical or research practice remains to be determined. These calculation methods provide divergent estimation of the circadian phase. Moreover, according to reports from clinicians, DLMO is often determined visually, which also leads to variable results depending on rater subjectivity. This diversity of methods can prevent the use of the correct estimation of DLMO in the clinical field, because some methods might perform better than others, as well as it can make the comparability between studies difficult. For example, when DLMO cannot be determined using a given method, studies using this method will exclude those subjects, thus making the populations between studies not comparable. This emphasizes the compelling need for a comparison of the available calculation methods to establish a consensus on the most relevant method to use.
Here we conducted a repeatability and agreement study of DLMO evaluation by the fixed threshold, the dynamic threshold and hockey stick methods in comparison to the mean of the visual estimation by four experts, all based on hourly blood samples collected in healthy subjects during a constant routine protocol under highly controlled conditions.
Materials & methods
The study protocol and consent forms were approved by the ethical committee (CPP Est IV n°14/29) and the French National Public Health Agency (ANSM, n°ID-RCB 2014-A00795-42), in accordance with the guidelines for clinical research as stated in the Declaration of Helsinki. All data collected were protected according to the French national committee of informatics and liberty (CNIL). All participants provided written informed consent during the inclusion visit. The data underlying this article may be made available on reasonable request to the corresponding author.
Study participants
Sixty-two subjects, 18 to 40 years old, participated in the protocol. All subjects were non-smokers and agreed to abstain from consuming tobacco, alcohol, cannabis or any other drugs during the whole protocol. They were free from medical, psychiatric or sleep/circadian disorders, as assessed by physical, psychiatric (Mini International Neuropsychiatric Interview – MINI) and ophthalmological examinations, questionnaires (Beck Depression Inventory, Pittsburgh Sleep Quality Index, Epworth Sleepiness Scale, Pichot Fatigue Scale, Insomnia Severity Index, Medical Outcome Study Short Form–36), overnight polysomnography and actigraphy for at least 2 weeks. Chronotype was systematically assessed by a sleep physician and using the Munich Chronotype Questionnaire (Roenneberg et al. Citation2007) and Morningness-Eveningness Questionnaire (Horne and Östberg Citation1976). All participants agreed to keep a steady sleep/wake cycle during the different visits and in-between laboratory visits (verified by actigraphy and sleep diary). Participants with conditions that may have impacted circadian rhythms were not included, for instance any type of shift work during the preceding year of the inclusion or trans-meridian travels in the preceding 2 months. Inclusion and exclusion criteria were: normal sleep based on a polysomnographic screening and sleep questionnaires (sleep duration between 6 and 9 h, absence of sleep disorder, Pittsburgh Sleep Quality Index score <8, Insomnia Severity Index score <15), no extreme chronotype (Munich Chronotype Questionnaire’s midsleep on free days >02:00 h and <06:30 h; Morningness Eveningness Questionnaire score >30 or <70), and no pathological scores on sleepiness and fatigue questionnaires (Epworth Sleepiness Scale score <11 and Pichot’s fatigue scale score <11). Subjects had to be physically and psychologically healthy (clinical examination, ophthalmological examination, MINI, Short Form 36 Health Survey physical and mental scores >50, Beck Depression Inventory score <11). Women had to be on hormonal birth control since at least 1 month prior the inclusion visit, not pregnant nor breast-feeding. No blood donation was made during the 3 months prior to the study.
Study protocol
The study took place at the International Research Center for ChronoSomnology (CIRCSom) within the University Hospital of Strasbourg, France. This study is based on the results from a larger chronobiological protocol. All subjects (n = 62, 32 males and 30 females) underwent a baseline evaluation during night 1 consisting of a 6-hour dim light period followed by an 8-hour sleep opportunity. Then, 31 subjects (16 males and 15 females) were kept under constant routine and exposed to dim light during the rest of the protocol, either in the “sleep deprivation” group (n = 16) or the “nap” group (n = 15) described in Supplemental Figure S1. The other 31 subjects were not included in this study because they were not exposed to dim light after the baseline night. For subjects in the sleep deprivation group, night 1 was followed by a 40-hour period of sleep deprivation under constant dim light (<8 lux) and a recovery night (night 3) lasting at least 8 h. For subjects in the naps group, night 1 was followed by 40 h of alternating dim light exposure (<8 lux; 150 min) and total darkness (0 lux; 75 min) where they could take a nap, followed by a recovery night (night 3) of at least 8 h.
Blood samples were collected during 3 days (40 samples of 8 mL). Samples used in this study were those collected during the evening/night periods (10 samples each), hourly from 5 h before lights off (hour at which participants went to bed and turned the lights off during the protocol) to 1 h after lights off, then every 2 h from 1 h after lights off to 7 h after lights off. Light exposure before lights off was dim light (<8 lux) and samples from lights off to 8 h after were collected when the subjects were asleep in total darkness. The subjects kept a peripheral venous catheter and were perfused with heparin sodium diluted in 0.9% NaCl during the whole protocol to avoid blood coagulation in the peripheral venous catheter. A platelet count was made to confirm the absence of a heparin-induced thrombocytopenia. Blood samples were collected in EDTA tubes, centrifuged immediately after and the plasma volume was distributed in microtubes. All samples were frozen immediately at −20 °C and then stored at −80 °C until melatonin assessments.
Melatonin assessments
Plasma melatonin concentrations were measured using double-antibody radioimmunoassay including a prior extraction procedure with C18 reversed-phase columns (RK-MEL2 kits, Bühlmann Laboratories AG Schönenbuch, Switzerland). The test was performed following the Bühlmann procedure except for the plasma volume used which was 300 μL (instead of 1 mL) reconstituted in 1 mL of incubation buffer, to reduce the number of results higher than the upper standard range. Thus, the limit of detection was 0.9 pg/mL and the limit of quantification was 2.7 pg/mL. We also added calibrator points to get a higher precision in the lowest values since baseline values are usually nearly undetectable.
Data analysis
DLMO estimations
Dim light melatonin onset was calculated using a program developed by Danilenko et al. (Citation2014) which simultaneously determines the fixed threshold, dynamic threshold and hockey stick estimations of DLMO. In cases when baseline values were missing, baseline values from the same subject at the same hour from the preceding or following day were imputed to allow for dynamic threshold DLMO calculation.
The hockey stick (HS) algorithm calculates DLMO by fitting a linear-parabolic function to the melatonin profile. The switch point between the linear and parabolic curve is considered a reliable estimate of DLMO. The fixed threshold (FT) was set at 10 pg/mL (Lewy et al. Citation1999) and the upper limit of the area of interest was set at 5 pg/mL as advised (Danilenko et al. Citation2014). The dynamic threshold (DT) is calculated by computing the mean of three baseline (daytime) values + 2 SD.
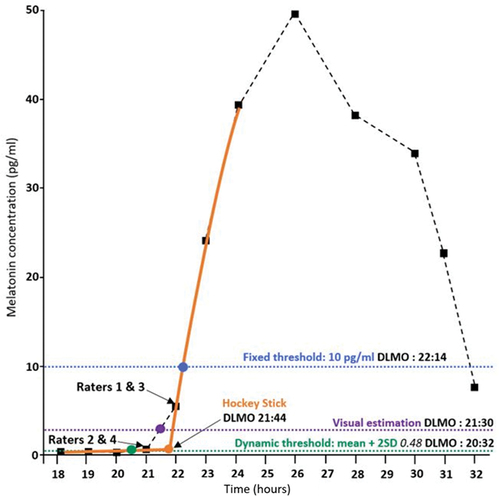
Since there is no consensus regarding the gold-standard method to estimate DLMO, we used a visual estimation (VE) as a reference for comparison with other methods. The VE was the mean of the values estimated by four independent and experienced chronobiologists and sleep physicians of CIRCSom (HC, UKH, ERu, and PAG). The melatonin profiles with the raw melatonin data points of each subject were provided to the raters, and they were asked to give the most probable DLMO estimate according to their experience. Raters were not aware of the results of the other methods beforehand. For illustrative purposes, an example of the different estimations made by each method and rater is shown in .
Figure 1. Illustration of DLMO estimation by each method on an individual profile. Reproduction of the Hockey Stick program (Danilenko et al. Citation2014) output window with annotation of the FT, VE, DT, HS DLMO estimations and each individual rater’s estimations. Black squares: raw data points; dashed black curve: linear interpolation between the data points; orange curve: fitted curve for the Hockey Stick method; orange dot: inflexion point of the linear – parabolic curve of the Hockey Stick method; blue point and blue dotted line: fixed threshold estimation; purple point and purple dotted line: mean of the visual estimations; green point and green dotted line: dynamic threshold estimation.
Statistical analysis
We tested the stability of the estimation given by each of the methods between two nights (night 1 and 3) in a repeatability study and we carried out an agreement study between FT, DT and HS methods compared to our VE of DLMO (night 1). For the repeatability study we pooled the data from the two groups exposed to dim light either under sleep deprivation or multiple naps after having verified beforehand that the sleep homeostatic pressure had no effect (mixed model analysis on the visual estimation with factors “Homeostatic pressure” and “Night”). All comparisons presented in this study were made with one-way (or Friedman test when the variables were not normally distributed) and two-way repeated-measure ANOVAs. Factors used in these analyses were within-subject factors “Night,” “Methods” and “Raters.” Post-hoc analyses were carried out with paired t-tests (or Wilcoxon test after Friedman test) and Bonferroni correction for multiple comparisons. All analyses were carried out with the R software (version 4.0.2).
Based on current recommendations (van Wieringen and Cribbie Citation2014; Watson and Petrie Citation2010; Yavuz-Kodat et al. Citation2019), the statistical analyses included the Intraclass Correlation Coefficient (ICC), Bland-Altman diagram and we also integrated the Yuen two one-sided paired equivalence test (TOST), which indicates if two measures are equivalent within a clinically relevant range of acceptability (van Wieringen and Cribbie Citation2014) for the agreement study. Unlike a Pearson correlation coefficient, the ICC calculates not only how well two variables are correlated but also if they are equal. An ICC of 0 would mean no agreement, ICC < 0.5 indicates poor agreement, 0.5 < ICC < 0.75 indicates moderate agreement, 0.75 < ICC < 0.9 indicates good agreement and 0.9 < ICC indicates perfect agreement (Koo and Li Citation2016).
The Bland-Altman diagram is a graphical method allowing the visual evaluation of the extent of the agreement (Bland and Altman Citation1986). The difference between a pair of measures is plotted against the mean of the measures. It also displays the individual points as well as the zero line, representing perfect agreement, and the upper and lower limits of agreement (LOA, ± 1.96 SD). The upper and lower LOA are expected to contain 95% of the differences between measures (assuming normal distribution of the differences) and are calculated as ± 1.96 standard deviations of the differences between the measures from the mean difference between the measures.
The TOST tests the clinical equivalence of two variables within a pre-determined and clinically meaningful interval. The acceptance interval of the comparison with VE was set at ± 30 min, given the sampling rate of 60 min. Since the statistical hypotheses are reversed for an equivalence test, a p < 0.05 indicates equivalence.
Results
Sixty-two subjects were included in the agreement study (night 1 only), while 31 were included in the repeatability study (night 1 and night 3). The mean age of the 62 subjects was 23.4 (± 0.5) years old, the mean lights off hour was 23:24 h (± 6 min), their mean corrected mid-sleep time from the Munich Chronotype Questionnaire was 04:05 h (± 5 min) and their mean Morningness-Eveningness Questionnaire score was 55.9 (± 1) (intermediate type).
The percentages of subjects for whom it was possible to calculate a DLMO for each method and study is shown in . The VE, HS, and FT provided DLMO estimations in more than 90% of the cases, and thus did not require imputation to be representative of our sample. Imputation consisted in replacing missing melatonin measures needed to calculate DLMO by melatonin measures from other daytime periods (preceding or following day). However, even though the blood samples began 5 h before the lights off hour on night 1, we were not able to calculate 45% of DLMOs of night 1 with DT due to a lack of baseline values (which was not the case for the following nights). As described in the materials and method section, we verified that DLMO estimations were not affected by sleep homeostatic pressure level and used baseline values of day 2 to impute either night 1 or night 3 values accordingly, which allowed us to increase the usable sample from 54.8% to 87.1% of the data during night 1, from 96.8% to 100% of the data during night 3 of the repeatability study, and from 56.5% to 91.9% for the agreement study.
Table 1. Calculability (%) of DLMO according to each estimation method and for the two studies. For the dynamic threshold, we reported the percentage of DLMO that could be calculated using the data of night 1 and 3 without imputation and the percentage of DLMO that could be calculated after imputing baseline values form day 2 if needed.
Repeatability study
The melatonin mean + 2 SD threshold was 0.85 (± 0.09) pg/mL during night 1 and 1.18 (± 0.16) pg/mL during night 3. Average estimations of DLMO were not different between night 1 and 3 () (“night” factor non-significant, “method” factor p < 0.001, interaction “method x night” p < 0.05). Comparisons of the differences between night 1 and 3 for each method was significant (p < 0.05, post hoc comparisons non-significant). The ICC indicated a perfect agreement between night 1 and 3 for the VE and the FT, and a good agreement for the HS and the DT.
Table 2. (A) DLMO during night 1 and 3 according to each of the four methods. The mean differences between night 3 and 1 for the different methods were not significantly different (n = 31). (B) DLMO during night 1 and difference between the visual estimation and the three other methods during night 1. Values are expressed as mean ± SEM.
The Bland-Altman diagrams showed that for all methods, the LOA (mean difference ± 1.96 SD) were inferior to ± 1 h30. However, the VE method was the only one to have LOA inferior to ± 1 h (). The bias (mean difference) was slightly positive for all methods, with a DLMO on the third night superior to the first night, ranging from less than a minute (FT) to 13 min (DT). Overall, the results from the different analyses showed satisfactory repeatability for all four methods and can thus be tested for agreement.
Figure 2. Bland-Altman diagrams for DLMO comparisons (n = 31) between night 3 and 1 determined by each method (decimal hours). The difference between night 3 and 1 measures are plotted against the mean of night 3 and 1. Each subject is represented by a dot, the zero-line represents the perfect agreement between night 1 and 3 measures and the dotted lines represent the upper and lower limits of agreement (± 1.96 SD). The bold dashed line represents the mean difference between night 3 and 1 for each method. The difference was night 3 – night 1, thus a negative difference means that DLMO during night 3 was estimated earlier than during night 1 and a positive difference means that DLMO during night 3 was estimated later than during night 1.
Agreement study
The mean of DLMO estimations of each rater fell in a 40-minute range and the mean SD of the visual estimations given for each subject was 25 min. Overall, DLMO estimations of the raters were different (p < 0.001). Raters usually chose either the last baseline sample time or the first ascending sample time. However, the sample mean DLMO falls by definition between those two points, thus the mean of these VE is a relatively close approximation of the real DLMO.
The mean + 2 SD melatonin concentration threshold was 1.16 (± 0.15) pg/mL during night 1. Mean DLMOs estimated by the four methods () during night 1 were different (p < 0.001, Friedman test, all post hoc p < 0.001 except between VE and HS non-significant). Mean differences between the VE and each of the three other methods were different (p < 0.001, Friedman test, all post hoc comparisons p < 0.001). The ICC highlighted a perfect agreement between the HS method and the VE, and a good agreement between both the FT and DT and the VE.
Only the HS method was equivalent to VE within ± 30 min (p < 0.001, ). To further investigate the equivalence of the HS method with VE, we carried out a second TOST analysis () including each of the different raters separately, with a clinically relevant interval fixed at ± 15 min. We found that the HS method can be considered as statistically equivalent to the mean of the four rater’s VE estimates in a ± 15 min interval (p < 0.001), which was not the case for the individual VEs.
Figure 3. Equivalence tests using the visual estimation as a reference. (a) Equivalence test (TOST) of mean DLMO estimated by the hockey stick, the fixed threshold and dynamic threshold methods compared to the visual estimation (zero line) within a ± 30 min interval (dashed lines). (b) Equivalence test (TOST) of mean DLMO estimated by the hockey stick and visually by each of the four raters with respect to the mean visual estimation (zero line) within a ± 15 min interval (dashed lines). If the mean difference of a given method with the visual estimation and its 95% CI falls between the dashed lines, then the method is considered as equivalent to the visual estimation within the pre-defined acceptability range. If they fall outside of the dashed lines or overlap them, the method is not considered as equivalent to the visual estimation.
The Bland-Altman diagrams showed that most of the individual points were located between the upper and lower LOA, indicating limited outliers in the difference between each method and the VE (). The bias (mean difference) was slightly negative for the difference between VE and HS, with HS displaying a 5-minute advance in DLMO estimation. The difference was however larger for FT with a 40-minute delay compared to VE, and an advance of 32 min for DT. Moreover, the difference between VE and HS displayed the narrowest LOA width. As shown by the ICC with VE, our results suggest FT and DT provide acceptable estimates of DLMO, but that the HS method is superior.
Figure 4. Bland-Altman diagram for the comparison (n = 62) between the hockey stick, the fixed threshold and the dynamic threshold with respect to the visual estimation (decimal hours). The difference between the pair of methods is plotted against the mean of the measures. Each subject is represented by a dot, the zero-line represents the equality between a given method and the visual estimation and the dashed lines represent the upper and lower limits of agreement (± 1.96 SD). The bold dashed line represents the mean difference between the pair of measures. The difference was visual estimation – each method, thus a negative difference means that DLMO was estimated earlier than the visual estimation and a positive difference means that DLMO was estimated later than the visual estimation.
Discussion
The melatonin rhythm is considered as the “hormonal fingerprint” of the circadian clock because of its high reproducibility from day to day in a given individual (Arendt Citation2005). However, although DLMO is considered the most reliable marker of the circadian phase, there is no current consensus on how it is optimally measured. To the best of our knowledge, the present study is the first one to compare DLMO calculation methods most commonly used through an agreement and repeatability study.
Notably, DLMO values were not always computable depending on data and calculation method. The hockey stick method allowed for DLMO determination in more participants than the two other methods. We could not get an estimation with the dynamic threshold method for almost half of the subjects due to a lack of baseline values. Indeed, collecting blood samples 5 h before lights off is not always enough to get three baseline values if melatonin secretion starts early. As expected, the fixed threshold method failed to calculate DLMO in low secretors (two participants).
Our results show a good repeatability of all methods between two nights. Voultsios et al. (Citation1997) previously studied repeatability of DLMO on salivary samples of six subjects across five consecutive nights with the dynamic threshold and a fixed threshold method. However, DLMO was computable for at least two nights with the two methods in only three subjects and DLMO values were not compared statistically. To our knowledge, no study of DLMO estimation repeatability has been published using blood samples, and the hockey stick method’s repeatability has never been assessed with blood samples nor saliva. Because there is no agreed consensual gold standard to estimate DLMO, the mean visual estimation of DLMO by four raters was chosen as the reference to compare with other methods (Danilenko et al. Citation2014), and to fit the usual practice in order to favor comparability with other studies. Our results indicated that the hockey stick method was significantly equivalent to the mean of the visual estimations given by our raters in a ± 15 min interval. The dynamic threshold method estimated DLMO significantly earlier than the fixed threshold estimation, as found in the literature (Voultsios et al. Citation1997), because melatonin levels are usually close to zero during daytime. In a previous article, the dynamic threshold method was judged to be closer to the visually identified physiological melatonin onset than the fixed threshold method (Molina and Burgess Citation2011), but it cannot always be estimated, which lowers its usefulness. Finally, the hockey stick method compared favorably to the others as it showed the highest ICC and because almost no difference in DLMO calculation was observed between the hockey stick and the visual estimation. Thus, the hockey stick method appears to provide an objective estimation of DLMO equivalent to the visual estimation of clinicians, avoiding biases, and reducing time and cost.
Our results indicate that the hockey stick method is superior to the visual estimation for several reasons. This estimation is made by a program, thus it has the advantage of being an objective and repeatable estimation. Furthermore, the hockey stick method is based on the modeling of the melatonin curve allowing estimations to fall between sample times and thus to be more precise, unlike visual estimations which depend on the sampling times. Indeed, each of the visual raters estimated DLMO at one sampling time point, i.e. before or after DLMO mean estimation, which, in absence of several raters, lowers the accuracy of the DLMO.
The estimation of the DLMO can be influenced by several parameters such as the fluid in which melatonin is measured (usually plasma or saliva), the sampling rate, as well as the setting in which the sampling is made (in-lab or at-home). Several teams have investigated the correlation between DLMO calculated in both fluids in diverse populations and overall found a good agreement between plasma and saliva (Gooneratne et al. Citation2003; Leibenluft et al. Citation1996; Voultsios et al. Citation1997). DLMO calculated from half-hourly and hourly saliva samples were found to be also well correlated (r = 0.89, p < 0.01) (Molina and Burgess Citation2011) with both fixed and dynamic thresholds, which is important for clinical applications because hourly samples are more practical and less expensive to collect. However, a study on adolescents provided a slightly different conclusion: both sampling rates appeared equivalent when DLMO was determined with a fixed threshold method, whereas the dynamic threshold method produced spurious results (Crowley et al. Citation2016). Finally, a study found that in-lab and at-home DLMO estimates were well correlated using both the fixed and dynamic thresholds, but the se methods were able to estimate DLMO in only 62.5% and 75% of the patients, respectively (Pullman et al. Citation2012). Therefore, it would be interesting to carry out the same study on hourly saliva samples which are much easier to collect, as well as a comparison study on both saliva and plasma DLMO estimated by the hockey stick method. Our study was carried out on healthy young adults. Thus, the reproducibility of our results needs to be assessed in other populations such as younger or older subjects, or in clinical populations.
This study is the first to present a full repeatability and agreement study with hourly blood samples collected in controlled conditions in a large sample of healthy young adults and using validated and appropriate methodology for method comparison. Good repeatability was found for all methods. Altogether, the results support the superiority of the hockey stick method for DLMO estimation compared to the dynamic threshold method, to the fixed threshold method, and to the visual estimation by a single rater. The hockey stick appears to be the most often computable method, and it performs as well on blood with hourly samples as on saliva with half-hourly samples (Danilenko et al. Citation2014). In conclusion, we suggest that the hockey stick method is superior to the other methods, given its objective nature, repeatability, and agreement with visual estimates.
Supplemental Material
Download PDF (45.8 KB)Acknowledgements
We thank Aline Schneider for her participation to the melatonin radioimmunoassays. We thank France Oxygène and the European Diabetes Study Center for their support. Finally, we thank Dr K.V. Danilenko for providing the Hockey Stick program.
Disclosure statement
No potential conflict of interest was reported by the author(s).
Data availability statement
Data are available upon request.
Supplementary material
Supplemental data for this article can be accessed online at https://doi.org/10.1080/07420528.2022.2150554
Additional information
Funding
References
- Arendt J. (2005). Melatonin: characteristics, concerns, and prospects. J Biol Rhythms. 20:291–303. doi:10.1177/0748730405277492
- Benloucif S, Burgess HJ, Klerman EB, Lewy AJ, Middleton B, Murphy PJ, Parry BL, Revell VL. (2008). Measuring melatonin in humans. J Clin Sleep Med JCSM Off Publ Am Acad Sleep Med. 4:66–69.
- Benloucif S, Guico MJ, Reid KJ, Wolfe LF, L’Hermite-Balériaux M, Zee PC. (2005). Stability of melatonin and temperature as circadian phase markers and their relation to sleep times in humans. J Biol Rhythms. 20:178–88. doi:10.1177/0748730404273983
- Bland JM, Altman D. (1986). Statistical methods for assessing agreement between two methods of clinical measurement. The Lancet. 327:307–10. doi:10.1016/S0140-6736(86)90837-8
- Crowley SJ, Suh C, Molina TA, Fogg LF, Sharkey KM, Carskadon MA. (2016). Estimating the dim light melatonin onset of adolescents within a 6-h sampling window: The impact of sampling rate and threshold method. Sleep Med. 20:59–66. doi:10.1016/j.sleep.2015.11.019
- Danilenko KV, Verevkin EG, Antyufeev VS, Wirz-Justice A, Cajochen C. (2014). The hockey-stick method to estimate evening dim light melatonin onset (DLMO) in humans. Chronobiol Int. 31:349–55. doi:10.3109/07420528.2013.855226
- Gooneratne NS, Metlay JP, Guo W, Pack FM, Kapoor S, Pack AI. (2003). The validity and feasibility of saliva melatonin assessment in the elderly. J Pineal Res. 34:88–94. doi:10.1034/j.1600-079x.2003.02945.x
- Horne JA, Östberg O. (1976). A self-assessment questionnaire to determine morningness-eveningness in human circadian rhythms. Int J Chronobiol. 4:97–110.
- Huck Ü K, Hugueny L, Choteau Robin L, Roy de Belleplaine V, Forfert P, Ruppert E, Comtet H, Bourgin P. (2019). Début de l’ascension de la sécrétion de mélatonine en lumière faible (DLMO). Modalités de recours à un outil d’analyse de la phase circadienne chez l’homme. Médecine Sommeil. 16:210–17. doi:10.1016/j.msom.2019.07.003
- Keijzer H, Smits MG, Duffy JF, Curfs LMG. (2014). Why the dim light melatonin onset (DLMO) should be measured before treatment of patients with circadian rhythm sleep disorders. Sleep Med Rev. 18:333–39. doi:10.1016/j.smrv.2013.12.001
- Koo TK, Li MY. (2016). A guideline of selecting and reporting intraclass correlation coefficients for reliability research. J Chiropr Med. 15:155–63. doi:10.1016/j.jcm.2016.02.012
- Leibenluft E, Feldman-Naim S, Turner EH, Schwartz PJ, Wehr TA. (1996). Salivary and plasma measures of dim light melatonin onset (DLMO) in patients with rapid cycling bipolar disorder. Biol Psychiatry. 40:731–35. doi:10.1016/0006-3223(95)00488-2
- Lewy AJ, Ahmed S, Jackson JM, Sack RL. (1992). Melatonin shifts human circadian rhythms according to a phase-response curve. Chronobiol Int. 9:380–92. doi:10.3109/07420529209064550
- Lewy AJ, Cutler NL, Sack RL. (1999). The endogenous melatonin profile as a marker for circadian phase position. J Biol Rhythms. 14:227–36. doi:10.1177/074873099129000641
- Lewy AJ, Sack RL. (1989). The dim light melatonin onset as a marker for orcadian phase position. Chronobiol Int. 6:93–102. doi:10.3109/07420528909059144
- Lewy AJ, Sack RL, Singer CM. (1985). Immediate and delayed effects of bright light on human melatonin production: Shifting “Dawn” and “dusk” shifts the dim light melatonin onset (DLMO). Ann N Y Acad Sci. 453:253–59. doi:10.1111/j.1749-6632.1985.tb11815.x
- Lewy AJ, Wehr TA, Goodwin FK, Newsome DA, Markey SP. (1980). Light suppresses melatonin secretion in humans. Science. 210:1267–69. doi:10.1126/science.7434030
- Molina TA, Burgess HJ. (2011). Calculating the dim light melatonin onset: The impact of threshold and sampling rate. Chronobiol Int. 28:714–18. doi:10.3109/07420528.2011.597531
- Nagtegaal JE, Kerkhof GA, Smits MG, Swart AC, Van Der Meer YG. (1998). Delayed sleep phase syndrome: A placebo-controlled cross-over study on the effects of melatonin administered five hours before the individual dim light melatonin onset. J Sleep Res. 7:135–43. doi:10.1046/j.1365-2869.1998.00102.x
- Pandi-Perumal SR, Smits M, Spence W, Srinivasan V, Cardinali DP, Lowe AD, Kayumov L. (2007). Dim light melatonin onset (DLMO): A tool for the analysis of circadian phase in human sleep and chronobiological disorders. Prog Neuropsychopharmacol Biol Psychiatry. 31:1–11. doi:10.1016/j.pnpbp.2006.06.020
- Pevet P, Challet E, Felder-Schmittbuhl M-P. (2021). Melatonin and the circadian system: Keys for health with a focus on sleep. Handb Clin Neurol. 179:331–43. doi:10.1016/B978-0-12-819975-6.00021-2
- Pullman RE, Roepke SE, Duffy JF. (2012). Laboratory validation of an in-home method for assessing circadian phase using dim light melatonin onset (DLMO). Sleep Med. 13:703–06. doi:10.1016/j.sleep.2011.11.008
- Roenneberg T, Kuehnle T, Juda M, Kantermann T, Allebrandt K, Gordijn M, Merrow M. (2007). Epidemiology of the human circadian clock. Sleep Med Rev. 11:429–38. doi:10.1016/j.smrv.2007.07.005
- van Wieringen K, Cribbie RA. (2014). Evaluating clinical significance: Incorporating robust statistics with normative comparison tests. Br J Math Stat Psychol. 67:213–30. doi:10.1111/bmsp.12015
- Voultsios A, Kennaway DJ, Dawson D. (1997). Salivary melatonin as a circadian phase marker: Validation and comparison to plasma melatonin. J Biol Rhythms. 12:457–66. doi:10.1177/074873049701200507
- Watson PF, Petrie A. (2010). Method agreement analysis: A review of correct methodology. Theriogenology. 73:1167–79. doi:10.1016/j.theriogenology.2010.01.003
- Yavuz-Kodat E, Reynaud E, Geoffray M-M, Limousin N, Franco P, Bourgin P, Schroder CM. (2019). Validity of actigraphy compared to polysomnography for sleep assessment in children with autism spectrum disorder. Front Psychiatry [Internet]. 10. doi:10.3389/fpsyt.2019.00551