
ABSTRACT
Sleep timing is an important output of the circadian system. The COVID-19-mandated social restrictions significantly altered commuting time and sleep duration regionally in Japan. This study aimed to elucidate sleep patterns, especially chronotype and social jetlag (SJL), due to changes in social time pressure through the social restrictions between the Metropolitan and Regional areas in Japan. As part of the Global Chrono Corona Survey 2020 (GCCS), the data were collected during social restrictions (SR), but pre-COVID-19 behaviours were also queried retrospectively. We analyzed a cohort of 729 respondents representing both the Metropolitan and the Regional areas separately for workdays and work-free days. While the areas showed no difference in SJL before SR, the differential decrease was larger in the Metropolitan area during SR, resulting in a significant difference in SJL between the areas. The outdoor light exposure before SR was 30 min longer in the Metropolitan areas than in the Regional; during SR both areas showed similarly low (below 1 h) outdoor light exposures. The variables associated with decreased SJL were the Metropolitan areas, work-from-home, a no-usage alarm clock on workdays, and chronotypes (mid-sleep time on free days corrected for sleep deficit accumulated over the workweek, MSFsc) during SR. The results suggest that relaxed social schedules, as reflected in the increased frequency of work-from-home and reduced alarm clock use, and moving towards earlier MSFsc during SR were linked to decreased SJL and were more prominent in the Metropolitan areas. This study provides insights into sleep patterns and the social time pressure markers, by comparison between residential groups in Japan.
Introduction
The regulation of human sleep is closely related to social schedules, which dictate the timing of activities such as work, school attendance, and meals (Roenneberg and Merrow Citation2016). Over the past few decades, there has been a significant decrease in sleep duration and an increase in insufficient sleep and eveningness circadian preference across all age groups and for both sexes (Bin et al. Citation2011; Hafner et al. Citation2017; Merikanto and Partonen Citation2020). In Japan, shorter sleep duration and later bedtimes have been increasingly reported among adolescents from 2004 to 2017 (Otsuka et al. Citation2021). Several health issues and an increased risk of mortality have been associated with evening chronotype, sleep debt, and circadian misalignment, which create a significant burden on public health (Cappuccio et al. Citation2010; Chaput et al. Citation2020; Merikanto and Partonen Citation2020; Wright et al. Citation2012). Social restrictions due to the COVID-19 pandemic affected the lifestyle and sleep behaviour of people around the world. Several studies indicated that mid-sleep time was delayed on workdays and sleep duration increased on workdays but shortened on free days (Blume et al. Citation2020; Gibson et al. Citation2022; Korman et al. Citation2020; Leone et al. Citation2020; Wright et al. Citation2020). COVID-19-mandated social restrictions unveiled the impact of social time pressure on sleep and body clock in society before that time (Korman et al. Citation2020). The effects of these social time pressures on sleep can be ascertained by quantifying the discrepancy between sleep patterns on workdays and work-free days. This discrepancy is commonly referred to as social jetlag (SJL) (Wittmann et al. Citation2006).
Light is the strongest synchronizing factor (zeitgeber) for the circadian system (Roenneberg et al. Citation2013). In addition, sleep behaviours such as sleep timing and sleep duration are influenced by geographical and social factors, i.e., a geographical difference (latitudes and longitudes (Fischer and Lombardi Citation2022)), country-wise socio-economical and cultural characteristics (Grandner et al. Citation2012; Lo et al. Citation2014; Ong et al. Citation2019) and area-wise differences in social/work schedules (Carvalho et al. Citation2014). A study in the US found sleep disturbance and daytime fatigue were more commonly reported in the South and less commonly in the West, indicating that sleep issues vary by state and region regardless of latitude (Grandner et al. Citation2012). Differences in sleep patterns between urban and rural areas have also been reported (Carvalho et al. Citation2014). The rural population in Brazil presented earlier mid-sleep time and less SJL than the urban one (Carvalho et al. Citation2014). The authors emphasize this difference may be influenced by exposure to light as well as social/work schedules in urban and rural areas with different population densities (Carvalho et al. Citation2014). Another study revealed the relationship between chronotype and longitudes was influenced by population size (Roenneberg et al. Citation2013). In the regions with low population density, people tend to spend more time outdoors (e.g. commuting by bike or by foot) and are exposed to lower artificial light levels at night compared to high population density regions (Roenneberg et al. Citation2013). In Japan, commuting time was reported to be a factor related to sleep debt (Takano et al. Citation2023).
However, there have been very few studies to compare sleep behaviours between the high (Metropolitan) and the low (Regional) population density areas within one country before or during the COVID-19 pandemic. The Japanese Metropolitan area is characterized by extensive commuting times and long working hours, together imposing high social time pressure (Korman et al. Citation2020) on the working population (Statistics Bureau of Japan Citation2018). Average commuting time was estimated at 45.9 minutes in the Metropolitan area, while the national average was 27.8 minutes (Statistics Bureau of Japan Citation2018). During social restrictions, commuting time was dramatically reduced and telework became ubiquitous, especially in the Metropolitan area (Ministry of Land Infrastructure Transport and Tourism Citation2021). The change in working style might reduce the need to use alarm clocks on workdays and, together with social distancing demands, change habitual exposure to outdoor daylight patterns. One important report investigating the regional difference in the effect of COVID-19 on physical activity and sedentary behaviours revealed that moderate-to-vigorous intensity physical activity decreased and lying/sleeping time increased in urban and urban-rural areas, but not in rural areas during the COVID-19 pandemic (Yamada et al. Citation2023). These results suggest the importance of examining sleep behaviours in detail, i.e. sleep timing on workdays and work-free days, the discrepancy of mid-sleep time as well as relevant factors with circadian timing. Therefore, the present study aimed to explore differences in sleep patterns and outdoor daylight exposure between the Metropolitan and Regional areas in Japan. We also aimed to elucidate the effect of social restrictions due to the first wave of COVID-19 on sleep behaviour in the two areas, using data from the Global Chrono Corona Survey (GCCS) (Korman et al. Citation2020).
Methods
Participants and ethics
The internet-based GCCS study was approved by the Ariel University Human Research Ethics Committee of the Faculty of Health Sciences (AU-HEA-MK-20200629). The GCCS was translated into nine languages including Japanese and conducted between April 15 and May 9, 2020. The Japanese government declared a state of emergency for the first wave of COVID-19 in seven prefectures (Tokyo, Saitama, Chiba, Kanagawa, Osaka, Hyogo, and Fukuoka) on April 7th 2020, and extended it to all 47 prefectures on April 16th. Schools across the country were closed from March to May. Governors asked for business closures and home stays, but there were no penalties for non-compliance. Recruitment methods included digital advertisements at universities, academic, and non-academic social networks, and email-based approaches. All participants were informed of the study objectives and gave their consent electronically. The survey was conducted voluntarily and anonymously with no personally identifiable information collected. Participants were asked 40–54 questions about daily behaviours and lifestyle in separate sections, respectively before social restrictions (pre-Social Restriction, preSR) and during the restrictions (in-Social Restriction, inSR) (Korman et al. Citation2020). The key items of the GCCS were modified from the micro MCTQ tool (Ghotbi et al. Citation2020) and questioned about the sleep times on work and work-free days. To avoid misunderstandings, participants were explicitly and repeatedly reminded to provide answers in the 24-hr time (and not the 12-hr AM/PM) format.
1,649 participants completed the Japanese version of GCCS for the first wave of COVID-19. shows the regional distribution of respondents in the survey. Responses were obtained from all over Japan. No participants were diagnosed with COVID-19 in this survey. Exclusions for this analysis were responders with no/nonsense zip codes (n = 536), those with missing or invalid data (n = 115), those working night shifts (n = 126), and those older than 65 years old (n = 19). 853 respondents were classified into two groups according to their residential areas: Metropolitan and Regional areas (). Metropolitan areas were defined as Tokyo and the surrounding 7 prefectures of Tokyo (Saitama, Chiba, Kanagawa, Ibaraki, Tochigi, Gunma, and Yamanashi prefectures), while the other areas were defined as the Regional area (). To correct for the overrepresentation of young (23–29 years old) participants in the Metropolitan area relative to the Regional area, 124 participants were excluded from the Metropolitan area using random procedures. In the stratified sampling methods, we split the population into strata (divided by age and regional area), and then randomly selected from the subgroup of 23–29 years old in the Metropolitan area to equalize the sample sizes among the subgroups. The final sample consisted of 729 respondents (66.4% females), the mean age of the sample was 38.1 ± 14.2 (standard deviation) years old and the mean body mass index was 22.0 ± 3.27 kg/m2. The Participants had on average spent 28.8 ± 8.32 days under SR, which we estimate allowed full adaptation to new (relaxed) social time pressure conditions.
Figure 1. Population density in Japan and the regional distribution of respondents.
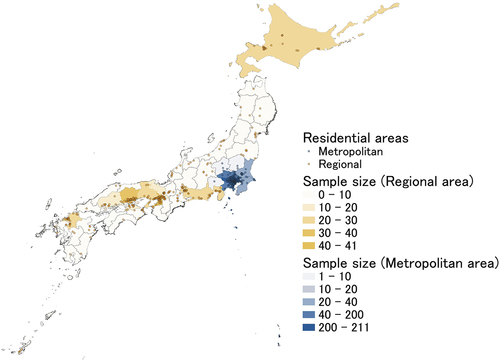
Figure 2. Study design flowchart.
The variables of the GCCS
The following variables of sleep patterns were calculated for each individual (Please, avoid possible confusion about the acronyms for SD [sleep duration] and SR [social restriction]. Sleep deprivation and sleep restriction were commonly used as the same abbreviations in the sleep field):
Individual mean sleep duration over the week (SD) was calculated as a weighted average of the sleep duration on workdays (SDw, assuming 5 workdays) and work-free days (SDf).
Individual mid-sleep time was defined as the mid-point of sleep on free days (MSf) corrected for sleep deficit accumulated over the workweek (usually abbreviated MSFsc). Mid-sleep time is an indicator of the phase of entrainment or chronotype (Roenneberg et al. Citation2019).
Individual social jetlag (SJL) was calculated as the difference between the mid-point of sleep on free (MSf) and workdays (MSw).
Outdoor daylight exposure (OLE) was calculated as a weighted average of the outdoor light exposure duration on workdays (OLEw, assuming 5 workdays) and work-free days (OLEf, assuming 2 days)
Delta sleep variables subtract variables preSR from the ones inSR. ΔOLE was subtracted OLE preSR from OLE inSR, and ΔSJL was subtracted SJL preSR from SJL inSR.
Habitual alarm clock use on workdays (user/non-user), work from home (yes/no)
Statistical analysis
In this study, non-parametric data analyses were used since none of the variables showed normal distribution and/or equal variances. Mann-Whitney U-tests were used to compare the sleep duration on weekdays/weekends, chronotype, and social jetlag of the Metropolitan and Regional population groups. The outlier of each variable was excluded as the value was outside the mean ±3 times by standard deviation. To provide a more comprehensive understanding of the tests’ results, the effect size r was calculated. Single regression was applied to each variable to compare the within-subject changes trends (of the Y (inSR) locally as a function of X (preSR)) per group, and between the Metropolitan and Regional groups. The multiple regression analysis was used to examine the associated variables with SJL inSR. Before the regression analysis, all variables (both predictors and the outcome) were standardized. This preprocessing step involved converting the variables to a common scale with a mean of zero and a standard deviation of one. To control possible confounding biases, hierarchical models from model 1 to model 5 were performed. Model 1 adjusted for sociodemographic variables including gender, age, and BMI. Model 2 adjusted for these variables and the residential area. Model 3 adjusted for these variables and MSFsc. Model 4 adjusted for these variables in addition to work from home inSR, and alarm clock use inSR. Model 5 adjusted for these variables and mean OLE inSR. Interaction effects were examined based on the suitable Model after comparing Models in multiple regression analysis. Model validity was considered from the changes in R2 value. Variance Inflation Factor (VIF) was used to check for multicollinearity. None of the VIF values were less than 3, which means no collinearity in all of the models. Statistical analyses were performed using R ver.4.2.1; statistical significance was set at p < 0.05. The effect size r was interpreted based on conventional benchmarks, where 0.1, 0.3, and 0.5 indicate small, moderate, and large effects, respectively (Cohen Citation1988). The effect size r was calculated using the R package “rcompanion” (version: 2.4.35).
Results
Demographics variables
The population sample distribution was 54.2% of respondents living in the Metropolitan (n = 395) and 45.8% in the Regional area (n = 334). Full demographic details are presented in . Note that the mean age and BMI were not significantly different between the two groups, while gender and days under SR were significantly different (more women in the Regional area). All of the respondents worked/studied regardless of SR. The ratio of working from home inSR was significantly different between in the Metropolitan (69%) and in the Regional area (51%), while the one preSR is not (Metropolitan: 16%, Regional: 15%). There was no significant difference in the proportion of alarm clock user on workdays between the two areas preSR, while that proportion in the Metropolitan area was significantly lower inSR (p = 0.018).
Table 1. Comparisons of demographic variables between Metropolitan and Regional areas.
Regional differences before social restrictions
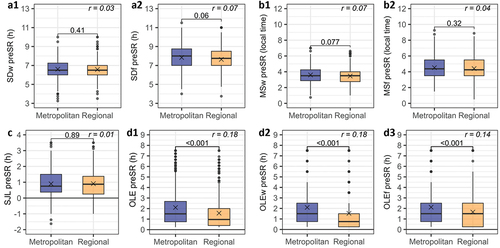
OLE were significantly different between the Metropolitan and the Regional areas preSR (). At baseline, the Metropolitan area tended to have later MSw (Metropolitan: 3.60 h ± 1.02, Regional: 3.46 h ± 1.03, p = 0.077, r = 0.07, ) and longer SDf (Metropolitan: 7.83 h ± 1.27, Regional: 7.64 h ± 1.31, p = 0.06, r = 0.07, ) compared to the Regional area. OLE was significantly longer by ~13 min in the Metropolitan than in the Regional area regardless of workdays or work-free days (Metropolitan: 2.10 h ± 1.92, Regional: 1.57 h ± 1.63, p < 0.001, r = 0.18, ). There was no significant difference between the two areas in SJL.
Figure 3. Comparisons of sleep variables between the Metropolitan and the Regional areas before social restrictions (preSR). The Mann-Whitney U-tests were used to compare between the groups, p-values are represented above the comparison lines. The effect sizes r are put in Italic letters.
Regional differences during social restrictions
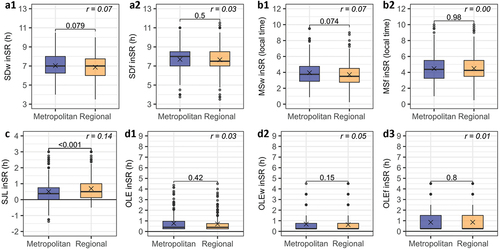
During social restrictions, all parameters of daily behaviours changed (). A trend of the Metropolitan area exhibiting later MSw has been preserved inSR (Metropolitan: 3.95 h ± 1.50, Regional: 3.71 h ± 1.38, p = 0.074, r = 0.07, ). Habitual sleep duration during workdays became longer, with the Metropolitan area showing a trend of reaching longer SDw (Metropolitan: 7.03 h ± 1.13, Regional: 6.87 h ± 1.19, p = 0.079, r = 0.07, ). Nevertheless, these differences between the areas were negligible in terms of the size effects. In contrast, SJL showed robust but uneven reductions inSR and became significantly smaller in the Metropolitan area than in the Regional area (Metropolitan: 0.50 h ± 0.68, Regional: 0.69 h ± 0.71, p < 0.001, r = 0.14, ). There were no significant differences between the two areas in SDf, MSf, and OLE.
Figure 4. Comparisons of sleep variables between the Metropolitan and the Regional areas during social restrictions (inSR). The Mann-Whitney U-tests were used to compare between the groups, p-values are represented above the comparison lines. The effect sizes r are put in Italic letters.
Social restriction-induced changes of sleep variables
Social restriction-induced changes in all daily behaviour variables (see for sleep duration and mid-sleep time, for SJL), and OLE (). During social restrictions, both areas delayed sleep timing on workdays, and the magnitude of change of MSw was larger in the Metropolitan area than in the Regional area. shows the scatterplots of MSw (a3) and MSf (a4), and boxplots of ΔMSw (b3) and ΔMSf (b4). The slope of the single regression line of MSw was 1.07 in the Metropolitan area and 1.06 in the Regional area. Both regression were significant, with regression lines were above the y = x line, indicating that MSw inSR was later than preSR (). ΔMSw in the Metropolitan area (0.40 h ±1.08 (23.9 min ± 64.8)) tended to be larger compared to the Regional area (0.23 h ± 0.85 (13.6 min ± 51.0), p = 0.077, r = 0.07, ). There was no significant difference in ΔMSf between the two areas (). SDw and SDf increased inSR in both the Metropolitan and the Regional areas, with the positive ΔSDw (). There were no significant differences in the magnitude of the change of SDw and SDf between the two areas ().
Figure 5. Social restriction-induced changes (preSR → inSR) of sleep duration (SD) in the Metropolitan and the Regional areas. The Mann-Whitney U-tests were used to compare between the groups in terms of the amount of change, p-values are represented above the comparison lines. The effect sizes r are put in Italic letters.
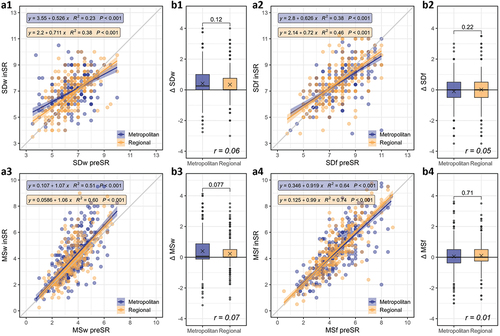
Figure 6. Social restriction-induced changes (preSR → inSR) of social jetlag (SJL) in the Metropolitan and the Regional areas. The Mann-Whitney U-tests were used to compare between the groups in terms of the amount of change, p-values are represented above the comparison lines. The effect sizes r are put in Italic letters.
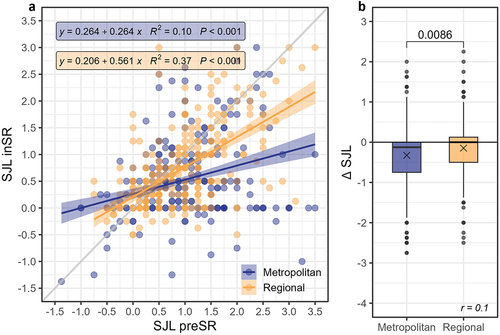
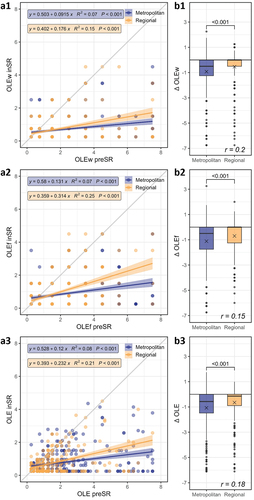
Figure 7. Social restriction-induced changes (preSR → inSR) of outdoor light exposure (OLE) in the Metropolitan and the Regional areas. The Mann-Whitney U-tests were used to compare between the groups in terms of the amount of change, p-values are represented above the comparison lines. The effect sizes r are put in Italic letters.
InSR, SJL in both areas decreased (). Moreover, SJL decreased significantly more in the Metropolitan area than in the Regional area (ΔSJL in Metropolitan: −0.33 h ± 0.79 (−19.8 min ± 47.4), ΔSJL in Regional: −0.15 h ± 0.65 (−9.0 min ± 39.0), p = 0.0086, r = 0.1, ).
OLE in both areas became lower inSR than preSR. shows the scatterplots and changes of OLE preSR and inSR. During the social restriction, OLE decreased significantly more in the Metropolitan area than in the Regional area (ΔOLE in Metropolitan: −1.07 h ± 1.51, ΔOLE in Regional: −0.65 h ± 1.20 (−39.0 min ± 72.0), p < 0.001, r = 0.18, ). The same tendency was observed in both OLEw and OLEf (OLEw: p < 0.001, r = 0.20, OLEf: p < 0.001, r = 0.15, ).
The comparisons of all sleep variables between the Metropolitan and the Regional areas preSR and inSR are summarized in Supplementary Information Table S1.
Associated variables with SJL inSR
The above results show a significant reduction in SJL during social restrictions, especially in the Metropolitan area. Therefore, we next examined what variables were associated with the value of SJL during social restriction, using multiple regression analysis (). Model 1, adjusted for gender, age, and BMI, revealed that lower SJL was associated with gender (male) (β = −0.20, CI = −0.36 to −0.05) and larger age (β = −0.09, CI = −0.09 to −0.01). Model 2, adjusted for residential area, revealed advancing age was significantly associated with lower SJL (β = −0.09, CI = −0.16 to −0.01), whereas living in the Regional areas was significantly associated with higher SJL (β = 0.29, CI = 0.15 to 0.44). Model 3 adjusted for MSFsc inSR, revealed that living in the Regional areas (β = 0.29, CI = 0.15 to 0.44) and later MSFsc (β = 0.35, CI = 0.28 to 0.43) were significantly associated with higher SJL. Model 4 adjusted for work from home and alarm clock on workdays, revealed that living in the Regional areas (β = 0.21, CI = 0.08 to 0.34), later MSFsc (β = 0.37, CI = 0.29 to 0.44), and work from home inSR (β = 0.24, CI = 0.09 to 0.39) were associated with higher SJL, while alarm clock usage on workdays inSR (β = −0.59, CI = −0.74 to −0.45) was significantly associated with lower SJL. In all adjusted models, OLE inSR was not associated with SJL (β = 0.03, CI = −0.06 to 0.12). Therefore, Model 4 was selected as a suitable one, compared to Model 5 including OLE inSR. This model described 22% of the variance in SJL inSR.
Table 2. Associated factors with SJL inSR by multiple regression analysis reporting standardized coefficients (β) and confidence intervals (95% CI).
Discussion
The present study set out to explore the differences in sleep patterns and outdoor light exposure between different residential areas in Japan, as well as to elucidate the impact of COVID‑19‑mandated social restrictions (SR) on sleep patterns. We used data collected during the first wave of the COVID-19 restrictions in Japan within a Global Chrono Corona Survey (GCCS) (Korman et al. Citation2020, Citation2022). The GCCS queried sleep-wake times and outdoor light exposure (OLE) duration times before and during SR (preSR and inSR) and also collected postal zip codes as geographical identifiers, that enabled comparisons between the respondents from the Metropolitan and the Regional areas in Japan. PreSR, the Metropolitan area showed only a negligible 8 min difference (for later) in mid-sleep times on workdays (MSw) and a significantly longer (30 min more) exposure to outdoor light than those in the Regional area (). Social restrictions led to a relaxed social time pressure, as reflected in the increased frequency of work-from-home and decrease in alarm clock use on workdays (). InSR, sleep patterns improved in terms of sleep duration and SJL, but OLE reduced below 1 hour a day and mid-sleep time on workdays was delayed (). These tendencies were more pronounced in the Metropolitan than in the Regional area (ΔMSw: 0.40 h ± 1.08, 0.23 h ± 0.85, the Metropolitan area and the Regional area, respectively) (-7). Multiple regression analysis revealed that SJL reduced with non-usage of an alarm clock on workdays and work-from-home inSR. The later chronotype (mid-sleep time on free days corrected for sleep debt, MSFsc) inSR was associated with higher SJL inSR, regardless of including work-from-home and alarm clock usage variables ().
It has been reported that sleep and circadian patterns differ by geographical and social factors (Carvalho et al. Citation2014; Fischer and Lombardi Citation2022). These differences between the urban and rural areas, or residential areas were suggested to be influenced by the amount of outdoor light exposure (Carvalho et al. Citation2014) and the sunrise time (Fischer and Lombardi Citation2022), as well as, social and work schedules (Hebl et al. Citation2022). One possible mechanism suggested is that the greater the difference between light and darkness, the stronger the zeitgeber and, accordingly, the earlier the phase of entrainment (Roenneberg et al. Citation2013). The present study revealed that participants living in the Regional area preSR reported somewhat reduced exposure to outdoor daylight on workdays and work-free days (mean difference ~30 minutes) in comparison to the participants from the Metropolitan area () preSR, whereas there were no significant differences in habitual sleep duration on workdays between the two areas. Thus, in Japan, the differences in daily behaviours of residents of the Regional and Metropolitan areas are not in line with the patterns observed in the previous studies (Carvalho et al. Citation2014; Fischer and Lombardi Citation2022). These discrepancies may be related to the fact that lifestyle in the Regional areas of Japan is not necessarily rural, as well as, to cultural, socio-economic and/or climate differences between the countries.
COVID-19-mandated social restrictions affected social times worldwide. Several studies indicated that social restrictions led to robust changes: mid-sleep time on workdays was delayed; sleep duration increased on workdays but shortened on work-free days; and SJL decreased (Blume et al. Citation2020; Gibson et al. Citation2022; Korman et al. Citation2020; Leone et al. Citation2020; Wright et al. Citation2020). This study observed that in Japan, preSR, the proportion of the people who work from home was low and the majority used alarm clock on workdays (work from home − 15% and 16%; use alarm clock on workdays 83% and 86%, respectively); with no significant differences between the Metropolitan and in the Regional areas. However, the proportion of people working from home in the Metropolitan area inSR became significantly larger than in the Regional area (p < 0.001, ), while the proportion of alarm clock users on workdays became significantly lower (p = 0.018, ). Together, these results indicated that social time pressure became more relaxed in the Metropolitan than in the Regional areas inSR and as a consequence, inSR sleep patterns in the Metropolitan were more positively affected than in the Regional area. These results support the notion that the use of alarm clocks is related to sleep debts and mismatches between sleep-wake timing and work schedules (Cajochen et al. Citation2010).
Insufficient sleep duration, irregular and late sleep timing, and large SJL have been common in modern society. These poor sleep health behaviours have been suggested to worsen major health problems, including cardiovascular disease, obesity, diabetes, mood disorders, and immune disorders (Wright et al. Citation2020). It is also reported that sleep debt is associated with reduced functionality and well-being in the context of work-related social factors, suggesting the importance of considering work-related social factors (Takano et al. Citation2023). The relaxation of social time pressure can potentially relieve sleep problems in modern society. Social time pressure should not conflict with our biology, although it has a structural and functional purpose and cannot be eliminated. When people follow their preferred sleep patterns, they often experience a “synchrony effect,” where they perform better when their activities align with their natural chronotypes – late chronotypes in the evening and early chronotypes in the morning (Taillard et al. Citation2021). We need to shape social time pressures in a way that minimizes sleep health risks, considering chronotypes. This study provides insights into the impact of residential areas and social time pressures on sleep patterns and changes induced in them by social restrictions. Reduced social time pressure may contribute to decreasing SJL and strategies to prevent disease (Korman et al. Citation2020; Roenneberg Citation2023).
This study has some limitations. First, we used cross-sectional data, and hence, we cannot provide information on the causality of the observed associations. Second, the retrospective self-reports of sleep behaviours bear an inherent risk of recall bias. Nevertheless, collecting retrospective data using the Munich Chronotype Questionnaire (MCTQ) has been widely used as a method to reveal human sleep behaviour in the real world and has revealed many important findings (Roenneberg et al. Citation2013). Third, we did not obtain many other relevant variables that may impact daily behaviours and could also affect the response to social restrictions, such as general health, marital status, small children, socio-economic status, living in an apartment vs. private house, commuting time, and many others. However, the large and wide distribution of ages allowed us to evaluate the impact of social restrictions on sleep patterns in the general population. Fourth, respondents were classified into two groups in this study. The regional divisions were different from the definition of areas and regions in the Ministry of Land Infrastructure, Transport and Tourism. Therefore, in future studies, with larger samples, regional differences may need to be classified in more detail.
In conclusion, sleep patterns on workdays under social restrictions approached those on work-free days before social restrictions, and the tendency was more pronounced in the Metropolitan area than in the Regional area. The impact of relaxed social time pressure during social restrictions was more striking in the Metropolitan area, presumably because of larger savings in commuting time and more frequent/more opportunities for teleworking. This study provides insights into sleep patterns in Japan, highlighting the contributions of chronotype and social time pressure estimated via social jetlag and the use of alarm clocks, to sleep patterns through comparison between different residential areas.
Author contributions
M.K. and T.R. designed research; M.K., V.T. and T.R. performed research; Y.K. and S.K. contributed translations of the GCCS into Japanese and advertised the study in Japan; K.K., Y.K., S.K., M.K., V.T. and T.R. analyzed data; K.K., Y.K., S.K., M.K., V.T. and T.R. wrote the paper.
Supplementary Material
Download PDF (353.4 KB)Acknowledgments
This work is supported by Ariel University (M.K.) and Tokyo Institute of Technology (K.K., Y.K.). We thank members of VITE (Virtual Institute for Temporal Ethology) for their valuable comments on the manuscript. We thank Japanese Society for Chronobiology (JSC) and Japanese Society of Sleep Research (JSSR) for their help in advertisement.
Disclosure statement
No potential conflict of interest was reported by the author(s).
Data availability statement
The data underlying this article will be shared on reasonable request to the corresponding author.
Supplementary material
Supplemental data for this article can be accessed online at https://doi.org/10.1080/07420528.2024.2340719.
Additional information
Funding
References
- Bin YS, Marshall NS, Glozier N. 2011. Secular trends in adult sleep duration: a systematic review. Sleep Med Rev. 16:223–230. doi: 10.1016/j.smrv.2011.07.003.
- Blume C, Schmidt MH, Cajochen C. 2020. Effects of the COVID-19 lockdown on human sleep and rest-activity rhythms. Curr Biol [Internet]. 30:R795. doi:10.1016/J.CUB.2020.06.021.
- Cajochen C, Chellappa S, Schmidt C. 2010. What keeps us awake? The role of clocks and hourglasses, light, and melatonin. Int Rev Neurobiol [Internet]. 93:57–90. doi:10.1016/S0074-7742(10)93003-1.
- Cappuccio FP, D’elia L, Strazzullo P, Miller MA. 2010. Sleep duration and all-cause mortality: a systematic review and meta-analysis of prospective studies. Sleep [Internet]. 33:585–592. https://academic.oup.com/sleep/article/33/5/585/2454478.
- Carvalho FG, Hidalgo MP, Levandovski R. 2014. Differences in circadian patterns between rural and urban populations: an epidemiological study in countryside. Chronobiol Int [Internet]. 31:442–449. doi:10.3109/07420528.2013.846350.
- Chaput J-P, Dutil C, Featherstone R, Ross R, Giangregorio L, Saunders TJ, Janssen I, Poitras VJ, Kho ME, Ross-White A, et al. 2020. Sleep timing, sleep consistency, and health in adults: a systematic review. Appl Physiol Nutr Metab [Internet]. 45:S232–S247. doi:10.1139/apnm-2020-0032.
- Cohen J. 1988. Statistical power analysis for the behavioral sciences. 2nd ed.; Hillsdale, NJ: Lawrence Erlbaum Associates.
- Fischer D, Lombardi DA. 2022. Chronotypes in the US: influence of longitude position in a time zone. Chronobiol Int [Internet]. 39:460–464. doi:10.1080/07420528.2021.2002889.
- Ghotbi N, Pilz LK, Winnebeck EC, Vetter C, Zerbini G, Lenssen D, Frighetto G, Salamanca M, Costa R, Montagnese S, et al. 2020. The µMCTQ: an ultra-short version of the Munich chronoType questionnaire. J Biol Rhythms. 35:98–110. doi: 10.1177/0748730419886986.
- Gibson R, Shetty H, Carter M, Münch M. 2022. Sleeping in a bubble: Factors affecting sleep during New Zealand’s COVID-19 lockdown. Sleep Adv [Internet]. 3. doi:10.1093/SLEEPADVANCES/ZPAC017.
- Grandner MA, Jackson NJ, Pigeon WR, Gooneratne NS, Patel NP. 2012. State and regional prevalence of sleep disturbance and daytime fatigue. J Clin Sleep Med [Internet]. 8:77–86. doi:10.5664/jcsm.1668.
- Hafner M, Stepanek M, Taylor J, Troxel WM, van Stolk C. 2017. Why sleep matters—the economic costs of insufficient sleep: a cross-country comparative analysis. Rand Health Q [Internet]. 6. doi:10.7249/rr1791.
- Hebl JT, Velasco J, McHill AW. 2022. Work around the clock: how work hours induce social jetlag and sleep deficiency. Clin Chest Med [Internet]. 43:249. doi:10.1016/J.CCM.2022.02.003.
- Korman M, Tkachev V, Reis C, Komada Y, Kitamura S, Gubin D, Kumar V, Roenneberg T. 2020. COVID-19-mandated social restrictions unveil the impact of social time pressure on sleep and body clock. Sci Rep [Internet]. 10:1–10. doi:10.1038/s41598-020-79299-7.
- Korman M, Tkachev V, Reis C, Komada Y, Kitamura S, Gubin D, Kumar V, Roenneberg T. 2022. Outdoor daylight exposure and longer sleep promote wellbeing under COVID-19 mandated restrictions. J Sleep Res. 31. doi: 10.1111/jsr.13471.
- Leone MJ, Sigman M, Golombek DA. 2020. Effects of lockdown on human sleep and chronotype during the COVID-19 pandemic. Curr Biol. 30:R930–R931. doi: 10.1016/J.CUB.2020.07.015.
- Lo JC, Leong RLF, Loh KK, Dijk DJ, Chee MWL. 2014. Young adults’ sleep duration on work days: differences between East and West. Front Neurol [Internet]. 5:81. doi:10.3389/fneur.2014.00081.
- Merikanto I, Partonen T. 2020. Increase in eveningness and insufficient sleep among adults in population-based cross-sections from 2007 to 2017. Sleep Med [Internet]. 75:368–379. doi:10.1016/J.SLEEP.2020.07.046.
- Ministry of Land Infrastructure Transport and Tourism. 2021. Telework population survey. Tokyo (Japan): urban policy division, urban affairs bureau, ministry of land, infrastructure, transport and tourism [Internet]. [accessed 2023 Sep 23]. https://www.mlit.go.jp/report/press/toshi03_hh_000085.html.
- Ong JL, Tandi J, Patanaik A, Lo JC, Chee MWL. 2019. Large-scale data from wearables reveal regional disparities in sleep patterns that persist across age and sex. Sci Rep [Internet]. 9:1–8. doi:10.1038/s41598-019-40156-x.
- Otsuka Y, Kaneita Y, Spira AP, Mojtabai R, Itani O, Jike M, Higuchi S, Kanda H, Kuwabara Y, Kinjo A, et al. 2021. Trends in sleep problems and patterns among Japanese adolescents: 2004 to 2017. Lancet Reg Health West Pac [Internet]. 9. doi:10.1016/J.LANWPC.2021.100107.
- Roenneberg T. 2023. How can social jetlag affect health? Nat Rev Endocrinol [Internet]. 19:384. doi:10.1038/S41574-023-00851-2.
- Roenneberg T, Kantermann T, Juda M, Vetter C, Allebrandt KV. 2013. Light and the human circadian clock. Circadian Clocks. 311–331. doi:10.1007/978-3-642-25950-0_13.
- Roenneberg T, Merrow M. 2016. The circadian clock and human health. Curr Biol [Internet]. 26:R432–R443. doi:10.1016/J.CUB.2016.04.011.
- Roenneberg T, Pilz LK, Zerbini G, Winnebeck EC. 2019. Chronotype and social jetlag: a (self-) critical review. Biology (Basel) [Internet]. 8:54. doi:10.3390/BIOLOGY8030054.
- Statistics Bureau of Japan. 2018. Statistics bureau, Ministry of Internal Affairs and Communications [Internet]. [accessed 2023 Sep 23]. https://www.stat.go.jp/english/data/index.html.
- Taillard J, Sagaspe P, Philip P, Bioulac S. 2021. Sleep timing, chronotype and social jetlag: Impact on cognitive abilities and psychiatric disorders. Biochem Pharmacol [Internet]. 191:114438. doi:10.1016/j.bcp.2021.114438.
- Takano Y, Iwano S, Ando T, Okajima I. 2023. Sleep debt mediates the relationship between work-related social factors, presenteeism, and well-being in Japanese workers. Int J Environ Res Public Health. 20:5310. doi: 10.3390/ijerph20075310.
- Wittmann M, Dinich J, Merrow M, Roenneberg T. 2006. Social jetlag: misalignment of biological and social time. Chronobiol Int [Internet]. 23:497–509. doi:10.1080/07420520500545979.
- Wright KP, Linton SK, Withrow D, Casiraghi L, Lanza SM, de la Iglesia H, Vetter C, Depner CM. 2020. Sleep in university students prior to and during COVID-19 stay-at-home orders. Curr Biol. 30:R797–R798. doi: 10.1016/J.CUB.2020.06.022.
- Wright KP, Lowry CA, leBourgeois MK. 2012. Circadian and wakefulness-sleep modulation of cognition in humans. Front Mol Neurosci [Internet]. 5:50. doi:10.3389/FNMOL.2012.00050.
- Yamada Y, Namba H, Date H, Kitayama S, Nakayama Y, Kimura M, Fujita H, Miyachi M. 2023. Regional difference in the impact of covid-19 pandemic on domain-specific physical activity, sedentary behavior, sleeping time, and step count: web-based cross-sectional nationwide survey and accelerometer-based observational study. JMIR Public Health Surveill. 9:e39992. doi: 10.2196/39992.