
ABSTRACT
Informed by theoretical perspectives on working memory demands and devices’ potential to “prime” different types of cognitive processing, this paper investigates whether we tend to think “faster” and more intuitively, with less reflection when we use a smartphone instead of a personal computer (PC) or notebook. Three complementary experimental studies with a total of 823 participants reveal that the results of using such devices surface only when participants can select the smartphone as their preferred device. Controlling for potential confounding variables reveals no evidence of general differences between devices. Our findings caution against overemphasizing the importance of the type of device in thinking slow or fast and establish self-selection bias as an important factor in explaining such differences. This study contributes to clarifying the psychology of smartphone screens and how humans make choices when they are using these devices.
Introduction
In the digital world, the primary medium for information retrieval and decision-making has changed from the physical to the digital sphere. Recent years have witnessed a rapid “shift-to-mobile” [Citation142, p.1], driven by advancing miniaturization, broad area coverage, and high Internet speeds. Smartphones connect us with the digitalized world and our social networks and extend our cognitive capabilities, as these devices are constantly available as external stores of knowledge and information [Citation53]. Since people already spend half of their online time on smartphones, and smartphones have surpassed computers as the most commonly used devices [Citation117], businesses and organizations will benefit from more insight into users’ cognitive processing when it comes to understanding how the decisions they make differ depending on the type of device they use. Put simply, do we think differently when we use a smartphone instead of a personal computer (PC)?
Despite smartphones’ near omnipresence, only a few studies have examined their effects on cognition [Citation111, Citation153], particularly decision-making, an important sub-field of cognition [Citation123]. Research on decision-making has reported device-dependent differences in various areas, such as in online reviews [e.g., Citation86, Citation104, Citation106, Citation157], consumer decisions [e.g., Citation61, Citation107, Citation117], social media posts [e.g., Citation85], and interactions with fake news [e.g., Citation93]. Evidence has also shown that information-seeking [Citation22, Citation53] and information-processing [Citation31, Citation64] as the bases for rational decision-making are complicated by smartphones’ small screens.
While research on cognitive performance based on the type of device used is inconclusive, even less is known about whether different types of devices “prime” different types of cognitive processing. In other words, we do not know whether smartphones systematically predispose users to think faster and more intuitively and to be less reflective. This type of cognitive processing is commonly known as “Type 1,” as compared to the reflective, slow, and deliberate “Type 2.” While Type 1 processing requires minimal attention or cognitive effort, such as that required in adding 2 and 2 or reading a simple sentence, reflective Type 2 processing is required, for example, to fill out a tax form or compare multiple products in making a consumer decision [Citation62]. Other authors have referred to “System 1” and “System 2” processing [e.g., Citation28, Citation67, Citation89, Citation90], but we follow Evans and Stanovich’s [Citation36] suggestion to use “Type 1” and “Type 2” processing because “System 1” and “System 2” could be misinterpreted as two separate areas of the brain.
A review of the extant research reveals three particularly noteworthy gaps. First, even though research has indicated that more cognitive reflection is used when one uses a computer than when one works on paper [Citation14], priming effects for Type 1 versus Type 2 processing when one uses a smartphone versus a PC have not been investigated systematically. In priming, an environmental stimulus has an unintended and non-aware influence on thoughts, feelings and behaviors [Citation9]. The prime, in this case, a particular device, would activate a related associated cognitive processing type based on previous experience without conscious effort. Since the omnipresence of smartphones indicates that decision processes are increasingly affected by the use of such devices, it would be beneficial to know whether mere using a smartphone would motivate the type of cognitive processing.
The second gap in the research that has compared devices refers to its foci on cognitive performance when one uses reflective Type 2 processing [Citation24, Citation140, Citation142] and on subjective thinking styles. However, these measures are less well suited to predicting rational decision-making when smartphones are used, such as when the decision is particularly or less risky or the user prefers larger rewards over smaller but immediate benefits [Citation38]. As a result, current research should focus on measuring cognitive reflection vs. intuition [Citation105, Citation136], which goes “beyond measures of cognitive ability by examining the depth of processing that is actually used” [Citation133, p. 99].
The third gap is that research has not made clear the role that self-selection plays in decisions or specific user behaviors on the smartphone. Research in survey science [Citation78], e-commerce [Citation74], and personal testing [Citation5, Citation140] has argued that the experimental setup (self-selection versus randomization of participants to devices) may account for contradictory study results on differences in the device used. Addressing such selection bias is necessary to clarify the causal relationship between the type of device and decision-making.
These shortcomings point to the need to address the following research question: Does using a smartphone systematically prime more or less use of intuitive “Type 1” processing versus reflective “Type 2” processing when compared to using a PC? We address this research question in three experiments in which subjects performed domain-independent cognitive tasks (adapted verbal and numerical cognitive reflection test items in a multiple-choice format) on a smartphone or a PC. An experimental investigation can tease out the effect of using a particular type of device on cognitive reflection and rule out alternative explanations. For example, differences in how devices are used could also stem from higher search costs on smartphones compared to PCs because of changes in navigation [Citation41, Citation107] and mobile-adapted applications [Citation97]. In addition, research on device differences has suffered from a variety of limitations, such as the fact that individuals often work in distracting surroundings when completing assessments on a mobile device, and failure to optimize assessment webpages for display on a mobile device [Citation57], leading to longer completion times and lower-rated user satisfaction with the device. Furthermore, user interface design options may not be predictable if not planned for (e.g., drop-down buttons rendered as spinner lists on Android but as picker wheels on Apple devices) [Citation3]. Thus, prior research has often not isolated only those features that are indispensable and essential for the perception of a smartphone as a holistic concept, such as a touching interface or small screen size [Citation117], but also allowed many context factors to confound results, making it more difficult to separate the pure device effect. Finally, when participants are not assigned to either a smartphone or a PC, selection bias is likely to emerge, and observed differences might stem from a third variable. To disentangle the effect of self-selection and shed light on contradictory findings, the present study examines the effect of smartphones in a between-subjects design with self-selection, a randomized between-subjects design without self-selection, and a within-subjects design to control for a large variety of confounding variables. In our study design, we aim to separate most typical smartphone features that distinguish smartphones from PCs such as the touch-sensitive user interface or the smaller screen size, from other contextual factors that may be more common in combination with smartphones, but are not inseparably linked to them, such as screen clutter or distraction.
Our research results extend current theories on smartphones and cognition and contribute to our understanding of what influences our ability to think effectively and make good decisions on smartphones. The results also have implications for areas like online reviews [e.g., Citation86, Citation104, Citation106, Citation157], consumer decisions [e.g., Citation61, Citation107, Citation117], posting on social media [e.g., Citation85], and interaction with fake news [e.g., Citation93]. Finally, they will also be of high practical relevance to designers of mobile applications.
Theoretical background
Smartphones and cognition
The popular media portray smartphones as a threat to our cognition, and evidence shows that multitasking with devices has adverse effects on attention [Citation153], particularly in situations in which individuals seek immediate gratification, such as receiving a new “like” on social media and when performing tasks they do not find rewarding. Mobile phones can interfere with everyday behaviors like walking and real-life social interactions, as smartphones occupy valuable attention resources. Research has also found that the addictive nature of phone-related “self-interruptions” may lower work and study performance [Citation81].
Research on using smartphones as a form of “extended cognition” has suggested that “more frequent smartphone usage would lead to less reliance on higher cognition” [Citation39, p. 1057]. Even the mere presence of a smartphone can have cognitive costs, reduce cognitive capacity, and impair task performance [Citation39, Citation134, Citation146]. Hartmann et al. [Citation54] explained this smartphone effect using the “affordances” for interaction that a smartphone offers and reported smartphone dependency as a moderator of the effect of a smartphone’s presence but found no overall effect of smartphone presence on memory performance. Recent experimental studies have also demonstrated adverse long-term effects of smartphones on cognition, although these effects are not stable over time. Heavy smartphone use (over 5 hours a day) leads to a “diminished ability to interpret and analyze the deeper meaning of information” [Citation39, p. 1], although this effect disappeared after a few weeks.
Despite the prevalence of smartphone use in everyday life, we know little about how they influence cognitive information-processing and decision-making [Citation111, Citation153]. Users worldwide spend an average of about three hours a day with their smartphones [Citation127]. Half of the time people spend on the Internet is already spent on smartphones—as much as they spend on desktops/PCs [Citation45]—during which time, users make decision after decision. In the context of information acquisition and related decision-making, people under age 35 use smartphones to read news more often than desktop devices and traditional news sources such as print, radio, and TV [Citation94], a trend that has progressed quickly since news apps began to gain acceptance in 2015 [Citation13]. In addition, the rate of online reviews written on smartphones has risen sharply compared to those written on PCs [Citation80]. These changing patterns in device use suggest the value in determining whether users make the same informed decisions using smartphones as when they use PCs.
Type 1 and Type 2 cognitive processing and their measurement
Cognition is defined as the “mental activity of processing information and using that information in judgment” [Citation59], whereas decision-making can entail both choices that depend on taste and preference and inference decisions that are based on decision criteria [Citation43]. Research on human decision-making has long recognized that normative models of decision-making—that is, how rational decision-makers should decide based on reasoning and weighting of decision options to achieve maximum expected utility—do not match descriptive accounts of which decisions are made in reality [Citation123]. Bounded rationality, a term Simon [Citation118] coined to acknowledge the cognitive limitations of decision-makers, is also reflected in “satisficing” [Citation119], which occurs when individuals “make a decision that satisfies and suffices for the purpose” [Citation18, p. 1241], but which may not be optimal or fully rational.
Dual-process theories distinguish two types of cognitive processing in decision-making [Citation98]: Type 1 processing (“intuitive” processing), which humans often use when deciding spontaneously and intuitively in everyday life, is fast, automatic, and efficient in routine, repetitive decisions and is associated with systematic cognitive biases and heuristics (rules of thumb), as it is executed without much reflection. Gigerenzer and Brighton [Citation42] and Hertwig and Gigerenzer [Citation55] further refined Type 1 processing in investigating which heuristics people use and in which cases such heuristics are useful, may even be ecologically rational, and might have a better accuracy-effort trade-off.
In contrast, Type 2 processing (“reflective” processing) is rational, slow, and deliberate. Dual-process theories were discussed as early as the 1970s [Citation147] and, following popular works by Kahneman [Citation62] and Stanovich and West [Citation126], have been applied extensively in research more recently. People are cognitive misers by nature [Citation125], as they tend to prefer Type 1 intuitive processing, which is comparatively effortless, over the cognitive effort required in Type 2 processing, as it requires conscious thought, effort, and costly analytical reflection. Type 2 processing is characterized by “cognitive decoupling and hypothetical thinking—and by its strong loading on the working memory resources that this requires” [Citation36, p. 226]. Recently, neuropsychological tests with electroencephalography [Citation90] also revealed evidence for dual processing and distinguished Type 1 and Type 2 processing during problem-solving tasks involving cognitive biases [Citation8] and while reading social media posts of fake news [Citation90].
In general, cognitive reflection, or lack thereof, is predictive of many decisions and beliefs in every aspect of life, from falling for conspiracy theories to moral decisions [Citation100] to problematic use of social networks [Citation141]. As a result, increasing attention has been paid to the measurement of cognitive reflection. For broad use on large samples, the cognitive reflection test provides an objective measure of cognitive reflection; Frederick’s [Citation38] classic version has three items. Cognitive reflection tests require respondents to “override intuitively appealing but incorrect answers” [Citation88, p. 246] as the following, example question from Sirota et al. [Citation120, p. 327] demonstrates: “If you were running a race, and you passed the person in second place, what place would you be in now?” The incorrect, “intuitive” Type 1 response is first place, but the correct, “reflective” Type 2 response is second place. The performance on cognitive reflection tests cannot be accounted for entirely by numerical or cognitive capabilities, but cognitive reflection tests can measure miserly cognitive processing [Citation137]. Recent mouse movement analyses show that intuitive responses are initially activated in such tests and must be suppressed to arrive at a correct answer [Citation139]. Moreover, stimulation of the brain areas that are responsible for inhibitory control has been shown to lower participants’ ability to suppress incorrect intuitive responses in cognitive reflection tests [Citation32, Citation96]. Because of its established validity and ability to anticipate people’s reasoning and decision-making skills in other situations [Citation120], the cognitive reflection test has been used in hundreds of studies. In fact, a meta-study of the cognitive reflection test in 2015 [Citation14] drew on 118 publications using the original cognitive reflection test. More recent research has shown, for instance, that performance on the cognitive reflection test is negatively correlated with the perceived accuracy of fake news and positively correlated with the ability to distinguish fake news from real news, even for headlines that align with the individual’s political ideology [Citation101].
Following Novak and Hoffman [Citation95], we conceptualize cognitive processing types as a situation-specific state instead of as an individual characteristic or trait. In other words, we posit that any person’s use of Type 1 or 2 processing may depend on the device and the specific situation.
Literature review
Although research has not directly investigated whether Type 1 or Type 2 processing occurs on smartphones more often than on PCs, many of the findings on differences between devices point to an answer. Work on such differences is scattered across domains like online and mobile shopping [e.g., Citation76, Citation97, Citation107], online reviews, respondents’ behavior in online surveys [e.g., Citation24, Citation70, Citation83], psychological testing (e.g., for personal assessment [e.g., Citation6, Citation17, Citation57]), user behavior on social media [e.g., Citation22, Citation64, Citation86] and news consumption [e.g., Citation30, Citation31]. To get a clearer picture of agreement and disagreement in these studies’ results, we carried out a systematic literature analysis based on 79 studies and coded the major results according to determinants of rational decision-making and their relationships to intuitive Type 1 versus reflective Type 2 processing. (For details on the 79 studies, see online Appendix A.)
To contextualize research on differences between devices, we built and refined a model of human information-processing [Citation150, Citation151], which has been applied successfully in the context of device differences [Citation5]. We refined the model presented in to include concepts that are relevant to our literature review: information-seeking, thinking styles, and Type 1 versus Type 2 processing, which, together with perception, are the main foci of our literature review. The conceptual visual model is a simplified abstraction of cognitive processes and does not include, for instance, cognitive control mechanisms. As illustrated in our model, recent neuropsychological studies have shown that the mechanisms of attention, working memory and long-term memory play roles in Type 1 and Type 2 processing, albeit to different degrees [Citation152].
Figure 1. Contextualization of the determinants of rational decision-making, adapted from [Citation150, Citation151]. Newly included concepts in the information-processing model by [Citation150, Citation151] are printed in bold, and the main foci of the literature review are highlighted in light gray.
![Figure 1. Contextualization of the determinants of rational decision-making, adapted from [Citation150, Citation151]. Newly included concepts in the information-processing model by [Citation150, Citation151] are printed in bold, and the main foci of the literature review are highlighted in light gray.](/cms/asset/31d1cc06-3f94-4c05-b3ea-744993e5e0a2/mmis_a_2196769_f0001_b.gif)
In the literature review, five concepts emerged: information-seeking about decision alternatives, which is a phase in many models of decision phases [Citation124]; device-dependent attention and perception of information; thinking styles as a predisposition for Type 1 and Type 2 processing; cognitive performance of reflective Type 2 processing; and indicators of cognitive effort invested in decision-making and the use of Type 1 vs. 2 processing. Variables like time taken and the characteristics of written texts could indicate the decision process used and the cognitive effort invested in using different devices from a motivational perspective. Such process variables could also be associated with less effortful elaboration in the context of Type 1 and 2 processing. However, apart from these indirect measurements, research has not directly measured Type 1 and Type 2 processing in the use of devices, which is a clear research gap.
Information search and information acquisition on decision alternatives
Numerous studies have indicated that users search for additional information on a smartphone less often than they search on a PC. In the context of multichannel customer management, Sohn and Groß [Citation122] described factors on the customer side that prevent customers from shopping on mobile devices, such as the perceived effort required to evaluate and select products. These results are in line with Raphaeli et al. [Citation107], who showed that consumer behavior differs on smartphones and PCs, as smartphone users show more task-orientated browsing than exploration behavior. Session duration in online shopping is reported to be shorter on smartphones than PCs [Citation107], and customer journeys on smartphones include fewer clicks [Citation61]. These results are consistent with observations that have indicated that casual browsing for products prompted by newsletters or social media is more prevalent on PCs, whereas smartphone users are more likely to click sponsored search results or visit familiar online stores, neither of which require extensive information search [Citation61]. In addition, in the domain of news-reading, findings have indicated that, when consumers use smartphones to read news on social media, they are less likely to click on related links than they are when they read news on PCs, reducing in-depth engagement [Citation22].
As a consequence of the greater search costs associated with mobile devices, smartphone users tend to be more receptive to recommendations, which has been demonstrated by, for instance, more clicks and views of recommended products on smartphones than on PCs [Citation74]. While the evidence of a stronger ranking bias—that is, whether users click on the search results displayed first—when users use smartphones than when they use PCs is still debated [Citation155], research has demonstrated that top-ranked links are more likely to be clicked on mobile devices than they are on PCs [Citation41]. Lower levels of information acquisition on smartphones have also been demonstrated by less switching of windows [Citation49] and lower performance when study participants are asked to search online for answers to a quiz [Citation53] or to identify relevant documents for a search query [Citation130].
Perception and cognitive elaboration of information
Smartphones impact how users perceive and process information [Citation111]. Ross and Campbell’s [Citation111, p. 150] review on smartphones’ effects on cognition and emotion argued that smartphones “appear to suppress deeper information processing in favor of quick and convenient extractions of information” and that “mobile interfaces and usage contexts generally favor shallower levels of information processing” [Citation111, p. 156]. For example, an eye-tracking study showed that social media news posts on smartphones acquire less visual attention to both images and text and less cognitive engagement than when they appear on PCs [Citation64]. Users also invest less time when reading news on a smartphone than when they read it on a PC [Citation30]. Dunaway and Soroka [Citation31] also reported a lower level of cognitive attention to news in the video format on smartphones, measured by psychophysiological responses. High amounts of information (e.g., as measured by excessive numbers of consumer reviews) are more likely to induce cognitive overload (i.e., “higher load imposed on an individual’s working memory” [Citation143]) when viewed on smartphones than when viewed on PCs and lowers purchase intention [Citation40].
Thinking styles and decision-making in preferential choices
Outcomes of consumer decisions can indicate how consumers evaluated decision alternatives on different devices and whether Type 1 or Type 2 processing was involved. When discussing smartphone and PC differences, some authors have referred to theories from various research streams that can be subsumed under the umbrella term of dual processing [Citation113], even if they do not directly refer to Type 1 and 2 processing [Citation36]. While thinking styles or dispositions should not be confused with Type 1 and Type 2 processing, such dispositions can “determine the probability that a response primed by Type 1 processing will be expressed” [Citation36, p. 230].
For instance, Liu and Wang [Citation76] investigated whether devices trigger different “consumer decision systems” in the context of choosing a hotel on a smartphone or a PC. They concluded that PCs and laptops evoke a logic-based (related to Type 2 processing) instead of a feeling-based (related to Type 1 processing) decision system, the latter of which is more likely to be used on smartphones. These results were supported by Kaatz et al. [Citation61], who reported, based on clickstream data from a fashion retailer, that cognitive components of the customer experience (related to Type 2 processing) are more relevant to purchase decisions made on PCs, while affective components (related to Type 1 processing) have more influence on decisions made on smartphones. Regarding thinking styles in purchase decisions, research has also reported that smartphones evoke an intuitive-experiential (related to Type 1 processing) thinking style, while PCs evoke an analytical-rational (related to Type 2 processing) style.
Indicators of the cognitive effort invested in decision-making and the use of Type 1 versus Type 2 processing
Time spent
Authors have argued that a number of dependent variables that differ across devices, such as time spent on similar decisions or tasks in general, can be explained by lower cognitive effort invested when smartphones are used than when PCs are used. In the context of survey science and studies that have compared devices for psychological measurement, the impact of smartphones on completion time for web surveys [Citation2, Citation23], for example, has long been debated; however, overall, research has provided a minimal amount of evidence that respondents devote more time to filling out questionnaires on smartphones than PCs. Both a meta-study in the field of survey science [Citation23] and one in the field of personnel testing [Citation5], for instance, found that most studies reported longer completion times on smartphones. However, some of the earlier studies might be outdated. As Schlosser and Mays [Citation116] noted in 2017, answer times are reduced if a fast internet connection and a current smartphone device are used. More recent studies [Citation50, Citation83, Citation108, Citation148] found similar completion times for closed-ended questions on smartphones and PCs and shorter completion times on smartphones than on PCs, which might indicate less cognitive effort expended when using smartphones, are rarely reported [Citation50].
Satisficing and response bias, break-off rates
Peytchev and Hill [Citation103] were among the first to argue that responding to a survey on a smartphone in a distracting situation can lead to “peripheral” processing (related to Type 1 processing) instead of “central processing” (related to Type 2 processing) of questions and to investing less attention and effort to the task at hand than would responding on a PC. While the distinction between the central and peripheral routes is based on the elaboration likelihood model [Citation102] and has typically been used in literature that has focused on persuasion and attitude change, it has also been characterized as a dual-processing theory [Citation113]. Response patterns in online surveys like straight-lining, which refers to selecting the same answer option to a series of questions or choosing the first answer option (primacy effect), may indicate satisficing when answering questionnaires to “shortcut the cognitive processes necessary for generating optimal answers” [Citation71, p. 29]. Mixed results were found for the difference in the incidence of straight-lining between using a smartphone or a PC [Citation66, Citation78, Citation138]. Another study showed that using smartphones did not lead to more motivation for underreporting (by selecting certain answers on filter questions that would reduce effort) than using PCs did [Citation25]. Some authors reported higher break-off rates [Citation66, Citation73] or more missing items [Citation50, Citation66, Citation78, Citation108] for participants who used smartphones, but others found no noticeable differences [Citation116]. Neither was a higher acquiescence rate [Citation66, Citation75] or midpoint bias [Citation66] found for smartphones. In addition, results that showed stronger primacy effects on smartphones [Citation78, Citation108] were contrasted by studies that presented contradicting results [Citation84, Citation138, Citation149]. In areas beyond surveys, where real-world emotions play a role, research findings have suggested that using smartphones may have polarization effects, that is, more comments on the extreme poles of opinion. Online reviews made on smartphones have more variance and tend to be more extreme than those written on desktops [Citation19, Citation80, Citation85]. Moreover, smartphones may amplify negative emotions, increasing the intensity of online complaints [Citation156].
Shorter user-generated texts
Several authors concluded from empirical data that user-generated answers to open-ended survey questions that are created on smartphones are shorter than those created on PCs [Citation78, Citation109, Citation149] or in online review forms [Citation19, Citation80, Citation85, Citation157], which is explained by the greater effort required to write longer texts [Citation85, Citation157]. These results alone could not be clearly linked to lower cognitive effort, as they could be directly related to more effort required to write on a smartphone because of the absence of a keyboard. However, linguistic analyses of texts written by users on different devices have indicated that Type 2 processing is more common on PCs than it is on smartphones. Ransbotham et al. [Citation106] found that restaurant reviews written on smartphones contain less “cognitive content” than those written on PCs, where cognitive content was measured “through words reflecting insight, causation, and discrepancy.” Melumad and Meyer [Citation86] reported that tweets written on smartphones have a less “analytical” style than those written on a PC [Citation34, Citation158].
Cognitive performance of reflective Type 2 processing
Studies on device-dependent performance in cognitive decision-making tasks, for which the use of Type 2 thinking is typically necessary [Citation125], have included reports that scores on general mental ability tests, such as IQ tests, are lower when participants were using a smartphone to fill out the test [Citation4, Citation69]. However, conflicting results were also published from studies that did not find differences in which device was used in the results of general mental ability tests [Citation6, Citation17, Citation140]. Tzur and Fink [Citation142] found evidence that users perform better on cognitive tasks when they use PCs than when they use smartphones but only when the experimental setting imposes a high cognitive load. The interaction effect between differences between devices and additional cognitive load was evident for both intrinsic cognitive load, measured by tasks with varying difficulty in a within-subjects design, and the extrinsic cognitive load, which was manipulated by presenting the information repetitively with more sentences in the specifications of the test items.
Other studies that have examined deductive reasoning performance (e.g., using tasks that resembled work-related activities and that required the application of rules) also revealed both differences in the device used [Citation114] and no differences in the device used [Citation47]. Small screen size lowers investors’ judgment when they read firm disclosures on a smartphone screen instead of a larger PC screen or on a smartphone-adapted version that requires less scrolling [Citation46].
Another observation was that fake news leads to more engagement and user interaction on a smartphone than on a PC [Citation93]. Whether a user believes fake news has been clearly linked to whether readers use Type 1 or Type 2 processing in other studies [Citation91, Citation101].
Explanations for differences between devices and hypotheses building
Having laid out empirically identified differences between the results of using a smartphone and using a PC, we turn to the underlying reasons for differences in information-processing and decision-making on devices as a basis on which to advance our hypotheses on the effects of devices on Type 1 and Type 2 processing.
One widely accepted theory that explains cognitive performance in the context of differences between devices is the structural characteristics/information processing framework for “psychologically conceptualizing the effect of UIT [unproctored Internet-based testing] device type on assessment scores” [Citation5, p. 1]. The framework explains why scores on Internet-based personality tests are similar for participants who use smartphones and those who use PCs, but performance on IQ tests is significantly lower when smartphones are used, with various authors also reporting high effect sizes for the difference [Citation4]. Arthur et al. [Citation5] argue that desktops add the lowest cognitive load to the task itself, while the cognitive load in using notebooks and tablets lies in the middle, and smartphones have the highest additional cognitive load.
When we compare smartphones and PCs, several differences stand out. A small screen size heightens the demand for working memory, while a higher perceptual speed and acuity are needed to deal with high screen clutter (a high amount of visual information relative to the screen size). A larger cognitive load because of small screen size and visual clutter in a mobile display lowers, for instance, the accuracy of consumers’ decisions, measured by its consistency with users’ preferences [Citation97]. Another structural characteristic of a device is its interface (e.g., touchscreens and virtual keyboards vs. physical keyboards), which relates to psychomotor skills. Users have smartphones with them at almost all times, so smartphones can be used in more diverse situations (higher situation variability) than desktop PCs and laptops can [Citation115]. Arthur et al. [Citation5] labeled that factor “permissibility” in the context of personnel assessment tests in their framework because it reflects test-takers’ freedom to take a test anytime and anywhere, which increases the potential for distraction and therefore requires greater selective attention to focus on the task [Citation5].
Several studies have used the structural characteristics/information-processing framework to examine the effect of smaller screen size on the demand for working memory [Citation6] and to test the role of distracting environments [Citation140]. In an experimental study with random assignment of the test subjects to a device in a laboratory environment, however, not all predictions of the model could be confirmed because the experimental setting offered no differences in general mental ability scores between the devices [Citation6]. However, the results suggested that smartphones place higher demands on working memory (e.g., because of the smaller screen size) than PCs do [Citation6]. Arthur et al. [Citation5] argued that distractions when participants had a free choice of location play a particularly important role as a determinant of lower cognitive performance in using smartphones, as studies in a laboratory context, which eliminated the higher demands on selective attention, were less likely to show differences in cognitive performance between smartphones and PCs. Given the finding that cognitive performance differences based on the device used occurred primarily when people were allowed to choose their own test environment, Traylor et al. [Citation140] investigated the interaction effect between the device and the environment in which a cognitive test is completed. The underlying hypothesis was that, when a quiet test environment is not predetermined, participants often choose situations for testing that involve the potential for distraction.
Following the line of reasoning presented in the structural characteristics/information-processing framework [Citation5], we conclude that distraction and higher cognitive load because of smaller screens and screen clutter would lead to a higher degree of intuitive Type 1 processing since Type 2 processing depends in part on working memory [Citation35, Citation99]. However, such an effect should disappear if apps optimized for display on a mobile device (making the elements more readable, reducing scrolling) are used and the participant is dedicated to completing a task on the smartphone without distractions or multitasking.
Beyond the structural characteristics/information-processing framework [Citation5] are additional aspects of differences between devices that are relevant to a discussion of the effects of smartphones on cognitive intuition and reflection that have been discussed in other literature streams. Our research focus is on the reasons (other than demands on working memory) for differences in the results of using one or another device: the priming effects based on typical use patterns of devices, and the touchscreen interaction with smartphones, and self-selection effects.
Priming effect of smartphones and associations with smartphones
In a distracting environment, such as that which occurs when one uses a smartphone in public or while walking, the user is aware that his or her full concentration is not available, but smartphones may also influence cognition in more subtle ways. The possibility that the mere use of a smartphone puts a user in a different mood or lowers his or her motivation for cognitive effort, in the sense of a priming effect, is likely to be far less transparent to the user than the environment is. Research has not yet addressed a priming effect due to the device on which one worked or with which a cognitive reflection test was administered, although a meta-review of 118 cognitive reflection studies revealed without further theorizing that solving cognitive reflection tasks on a computer leads to more reflective scores than completing them on paper [Citation14]. Moreover, a priming effect of smartphones for Type 1 processing may also be “ecologically” rational and provide a better accuracy-effort trade-off [Citation42, Citation55] since, for example, further search for information is more cumbersome on smartphones than it is on PCs.
Use-based priming effects of smartphones
Liu and Wang [Citation76, p. 447] stated that “one potentially underestimated factor is the nature of the device and the concepts the device represents.” Research has studied users’ associations with smartphones to find out which concepts a smartphone represents [Citation63, Citation117] by, for example, asking participants to complete word fragments or by using implicit associations tests. Kardos et al. [Citation63, p. 84] argued that smartphones can induce different user behaviors in the form of priming in observing that “as an important personal and cultural object, the mobile phone may carry meanings that can be activated by its presence or mere concept, which in turn influences behavior.”
For example, smartphones are often characterized as being used mainly for leisure activities and are often associated with fun, evoking a for-fun mindset. Smartphone users have faster responses to such fun-related words as “entertain” in combination with pictures of a smartphone than to non-fun-related words like “study” and “task” [Citation117]. We also associate smartphones with relationship-related concepts [Citation63], as smartphones are likely to prime the notion of close personal relationships that people cultivate with their smartphones’ help. Users’ most frequent activities on smartphones reflect this notion, as users spend most of their time on their smartphones engaging in social networking, texting, and telephoning [Citation39]. Furthermore, automated linguistic analyses of large Twitter corpora and TripAdvisor reviews reveal that users refer more often to friends and family when they tweet or review using smartphones than when they use a PC [Citation86]. Online reviews made on smartphones are more emotional and disclose more personal information than those made on PCs [Citation82, Citation85, Citation86, Citation106]. Therefore, smartphones are likely to induce intuitive Type 1 cognitive processing because social sharing and empathy are positively related to intuitive thinking but negatively related to reflective, deliberative Type 2 processing [Citation16, Citation129].
Conversely, because of their typical work context, PCs and laptops may trigger utilitarian, instrumental, and functional (shopping) associations and a logic-based thinking system that relies less on feelings and impulses [Citation76]. The associations of smartphones with fun and PCs with work heighten the probability that a smartphone user will choose hedonic products over utilitarian products and rate them more positively than a PC user will [Citation117]. At the same time, PCs and laptops are perceived more as utilitarian objects from the work context and should be more readily associated with deeper and more reflective Type 2 thinking. In addition, smartphones have been reported to have a more calming and pacifying effect than PCs due to properties such as being a personal possession and promoting a sense of privacy [Citation87]. Since positive mood is related to intuitive processing, while negative mood leads to reflective processing [Citation27], this characteristic of smartphones may also induce Type 1 processing to a higher extent than PCs.
Smartphones’ touchscreen-based priming effects
Another stream of literature discusses the differences between the use of smartphones and PCs based on their interface modalities, with a focus on touch. The influence of sensorimotor experiences and touch on cognition can be explained in the context of embodied cognition since “the mind must be understood in the context of its relationship to a physical body that interacts with the world” [Citation51, p. 343]. For example, Halali et al. [Citation51] demonstrated that the positive “priming” effect on cognitive control evoked by touching cold objects is similar to that from viewing icy, snowy landscape images.
Research in consumer psychology has focused on the differences in interactions with a smartphone’s touchscreen vs. those with the mouse on PCs [Citation21, Citation145, Citation158]. Brasel and Gips [Citation15, p. 537] posited that customers might be “especially susceptible to biases in their online search and purchasing behavior” on touchscreen devices and are likely to exhibit a “bias toward sensory information over abstract information” and to focus on tangible product attributes in product-related decisions [Citation15, p. 535]. In a study on hotel selection, customers rated their “gut feel and instinct” as more relevant to their decisions than information in user reviews when they used a touchscreen device than when they used a mouse [Citation15]. Wang et al. [Citation145] observed that the touch surface could reinforce existing opinions about products in the sense of polarization, in both in positive and negative directions.
Hypothesis on priming effect
Since we associate smartphones, which are primarily communication devices, with relational concepts [Citation63, Citation117], we contend that they are more likely to appeal to intuitive Type 1 processing than PCs are because of the relationship between social sharing and empathy and intuitive thinking [Citation16, Citation129]. Our central hypothesis is that smartphones activate Type 1 cognitive processing, not only because of distractions or small screens, but also based on a priming effect that is related to their typical use patterns and associations and the touch-interaction involved [Citation15, Citation21, Citation145, Citation158]. Therefore, we state the following general hypothesis:
Hypothesis 1 (H1): Using a smartphone primes for intuitive Type 1 processing, while using a PC primes for reflective Type 2 processing.
Self-selection effects
Frequent use of smartphones and the greater proportion of daily computing time spent on smartphones than on PCs positively correlate with intuitive thinking, measured with the cognitive reflection test [Citation11, Citation144]. This correlation could occur because increased use of smartphones leads to higher use of intuitive Type 1 thinking, or because people who are inclined to Type 1 thinking use the smartphone to reduce their cognitive effort by, for example, using it to look up information in the calendar or ask questions whose answers they could easily remember or learn [Citation11]. In the same vein, previously reported correlations, such as those between frequent smartphone use and various measures of key cognitive abilities like attention, memory, and executive functioning [Citation153], are not likely to be causal relationships but are caused by some people’s inclination toward immediate gratification. Thus, self-selection may explain why “cognitive misers” who tend to think intuitively in cognitive tasks (i.e., use Type 1 processing more often than Type 2) also tend to be dependent on their smartphones’ everyday use [Citation11]. As Pennycook et al. [Citation100, p. 430] pointed out, “smartphones may serve as a ‘second brain’ to which those inclined to avoid analytic thought offload their thinking.”
Users who score high in smartphone addiction have also been found to be impulsive and to choose immediate monetary rewards over later rewards, which Tang et al. characterized as a “higher tendency to make irrational decisions” [Citation132, p. 3]. Impulsive individuals have also been found to use the mobile Internet frequently for work and leisure activities and to exhibit attentional patterns that are consistent with making risky security decisions by choosing public WI-FI-networks and considering fewer security-related details on their smartphones, as measured via eye-tracking [Citation58]. Various application domains, such as online shopping, have also found that the mobile smartphone channel attracts different customers or user groups than the PC channel. Field data on omni-channel use in e-commerce has shown that “impulsive individuals use relatively more mobile devices compared to online devices than do low impulsive individuals” [Citation110, p. 469]. Customers who tend to make spontaneous impulse purchases expect to have more fun using smartphones for shopping, while customers who value convenience and want to spend less time shopping do not expect to enjoy shopping on a smartphone, probably because searching for products on a smartphone is more challenging and, therefore, more time-consuming than it is on a PC [Citation48].
Survey research has identified a number of demographic characteristics in which participants typically differ when they select a device to use [see, e.g., Citation66]. Lugtig and Toepoel [Citation78, p. 92] argued in relation to research on survey science that yielded contradictory results on differences between devices that “the measurement error differences that we find between the devices should not be attributed to the device being used, but rather to the respondents. Those respondents who are likely to respond with more measurement error in surveys are also more likely to use tablets or smartphones to complete questionnaires.” Researchers in the area of personal testing have noticed that, while some comparison studies have shown apparently clear results that indicate lower cognitive performance scores on mobile smartphone devices than on non-mobile desktops, other lab-based studies have repeatedly shown that such differences do not exist [Citation5, Citation140]. Traylor et al. [Citation140] suggested self-selection versus random assignment to devices as a likely reason for this inconsistency in results, and Brown and Grossenbacher [Citation17, p. 68] observed that “once selection bias is eliminated as a threat to validity, we expect that differences between mobile and non-mobile test scores will be much weaker, if not equivalent.”
Field data on the differences between the use of smartphones and PCs in e-commerce is rare because of the difficulty in obtaining data (e.g., by cooperating with analytics companies) and because real data sets typically lack the opportunity to randomize the device treatment [Citation74], relying instead predominantly on users’ choosing their device. In this context, Lee et al. [Citation74, p. 894] noted that “it is possible that mobile users are fundamentally ‘different’ from PC users, and therefore any results … could be attributable to these unobserved differences.” Our literature review revealed that only 3 out of 63 research articles contained both research data in which participants selected their devices and a randomized between-subjects design [Citation85, Citation86, Citation156], thus allowing the role of self-selection to be assessed. However, this research gap remains because comparing multiple studies, some with and some without self-selection, from multiple papers mentioned in literature reviews [e.g., Citation5, 23] makes it exceedingly difficult to assess the role of self-selection using extant research.
Hypothesis on self-selection effects
Self-selection may play a large role in many of the differences between devices that have been identified based on empirical datasets [Citation153], so possible device effects should be investigated independent of the choice of a device. Studies have suggested clear associations between smartphone use and more intuitive cognitive processing when a user chooses the device [Citation11, Citation144]. Moreover, demographic variables like gender, for which meta-studies have identified robust performance differences in cognitive reflection [Citation14], typically differ when participants select a device [Citation66]. Therefore, we posit:
Hypothesis 2 (H2): Self-selection of the device (smartphone vs. PC) increases the difference between the amount of intuitive Type 1 and reflective Type 2 processing used between smartphones and PCs more than when participants are randomly assigned their devices.
Research method
Research design
To account for the typical limitations in prior experimental settings, we conducted three consecutive online experiments that differed in their research designs: (1) a between-subjects design with self-selection to groups, (2) a between-subjects design with randomized groups, and (3) a within-subjects design. The studies’ underlying rationale was to have participants answer a cognitive reflection test using either a smartphone or a PC so as to measure the Type 1 and Type 2 processing that occurs when using these devices.
The first between-subjects study used a quasi-experimental design to assess the effect of the device so we could investigate the effects of self-selection of a smartphone or a PC. We did not force the participants to use either a smartphone or a desktop computer; instead, the questionnaire was designed to record the device the participants chose to use to complete it.
In the second between-subjects study, participants were randomly assigned to use a smartphone or a PC via an email invitation.
In the third study, the device served as a within-subjects factor to allow for more robust comparisons “because each test-taker completes the assessment on both device types and thus can make an intrasubject comparison” [Citation5, p. 6]. The research design was similar to that used in Brown and Grossenbacher [Citation17], who used parallel versions of the Worderlic Test, first testing all participants on the PC and then randomizing PC, smartphone, and tab for the administration of a second, parallel version of the test. In contrast, we used a fully-factorial design that featured a device order sequence and a parallel test version sequence as two counter-balanced between-subjects factors, resulting in four between-subjects experimental groups (). This means that one participant answered half of the questions on one device and the other half on the other device.
Figure 2. Within-subjects design.
Because of the many differences between PCs and smartphones, we designed the studies to focus on particular differences between the devices used while keeping the influence of other factors low or constant ().
Table 1. Focus of the studies.
Measurement of constructs
Measurement of the dependent variable: Development of a cognitive reflection test
We needed a larger number of cognitive reflection tasks than the traditional 3-item test [Citation38] to measure Type 1 and Type 2 cognitive processing reliably [see, e.g., Citation137] and to fulfill the assumptions of the statistical tests for comparing the devices. We adapted 6 of the 7 items from the cognitive reflection test’s multiple-choice version [Citation121] and 12 items from the verbal cognitive reflection test [Citation120], whose questions were inspired by quizzes and brainteasers from the Internet. Instead of the traditional open-text format used in the original cognitive reflection test [Citation38], we chose a multiple-choice format that could be answered via radio buttons. Doing so lowered the influence of psychomotor abilities on the results of using a PC versus a smartphone because of the effect of using a virtual versus a physical keyboard [Citation68]. Thus, we created multiple-choice response options for the set of verbal cognitive reflection tasks. To align the response format of the verbal and numerical parts of the questionnaire, we added the response option “Other, please specify” to the multiple-choice response options of each numerical cognitive reflection test item, resulting in five response options for each cognitive reflection task. An example of a verbal cognitive reflection task adapted from Sirota et al. [Citation120] was “How many of each animal did Moses put on the ark?” The incorrect “intuitive” Type 1 response is 2, while the correct “reflective” Type 2 response is “Other: None/It was Noah”; Wrong, distracting options were answers 1 and 7. An example of a numerical task is “Jerry received both the 15th highest and the 15th lowest mark in the class. How many students are in the class?” The incorrect, “intuitive” Type 1 response is 30 students, while the correct, “reflective” Type 2 response is 29 students. The wrong distracting options were 1 student and 15 students.
To measure Type 2 processing, we employed the standard scoring technique based on the number of correct (reflective) responses, although we use the percentage value from the total of 18 items for ease of interpretation [Citation99]. We measured intuitive (Type 2) processing using the percentage of intuitive responses, which is also a common approach when scoring cognitive reflection tests [e.g., Citation16, Citation121].
The test items were translated into German, the country’s native language, and proofread by two study assistants. We constructed two parallel test versions A and B, each with half of the 18 items, for the within-subjects design of the cognitive reflection test based on 467 data points for each cognitive reflection item. Each parallel test included three adapted items from the numerical multiple-choice question version of the cognitive reflection test [Citation121, p. 2511] and six items from the verbal cognitive reflection test [Citation120], resulting in a total of nine items. We ensured that item difficulty was approximately the same for reflective responses (version A: 25 percent, version B: 27 percent) and intuitive responses (version A: 58 percent, version B: 60 percent). The internal consistency of the 18 cognitive reflection test items used, shown in , demonstrates adequate reliability [Citation44].
Table 2. Cronbach’s alpha coefficient for the cognitive reflection tasks.
Visual design of the cognitive reflection tasks
In choosing the questionnaire’s visual design, an important goal was that the choice tasks in the online questionnaire look the same on both devices, regardless of screen size. We chose a survey layout for smartphones and mobile devices by soscisurvey.com, which is optimized for the presentation of questionnaires on small screens and displays questions with appropriately large and easy-to-read fonts. This layout reduces the questionnaire’s width to 310 px on each device, so the screen is not fully utilized on larger screens but resembles a smartphone screen when shown on a PC. Choosing this design made the visual displays more comparable and reduced the influence of confounding variables regarding readability (). Because the layout may influence information processing and readers’ attitudes toward the material [Citation31, Citation46, Citation64, Citation79, Citation92, Citation97], this decision to keep the design stable among experimental groups is necessary to avoid confounding such additional effects with the pure priming effect of the device.
Figure 3. Visualization of a cognitive reflection task on both devices: Desktop (left) and smartphone (right).
Since the questionnaire was optimized for mobile phones, all information was visible on one screen; as a result, the participant did not have to hold several screens in working memory or scroll to answer a question. We ensured that the short text of the question stem and the answers were easily readable even on small devices and that the font size was nearly identical for typical default screen resolution.
Procedure
The cognitive reflection test was not proctored, but participants were asked to read and sign a consent form before answering the questionnaire. Before and after the cognitive reflection tasks and between parallel test versions, we used filler tasks that were unrelated to the cognitive reflection tasks. To lower the influence of order effects, participants could not jump back and forth between cognitive reflection tasks but had to answer them one after the other in a pre-specified order, which was the same for all participants. Thus, the participants all answered the same 18 cognitive reflection tasks in the same sequence, alternating between verbal and numerical tasks. However, the response options’ order was individually randomized to be used as a control variable.
Measurement of the independent variable: Device
As the primary independent variable in our study was the type of device, we recorded the device that participants used when they completed the online questionnaires. In the between-subjects study with randomization, the questionnaire first checked the assigned device based on the link used when the participant opened it, and the survey could be continued only when the participant answered it on the correct device. In the within-subjects study, controlling whether the participants were following the procedure and answering the questionnaire on the correct devices was essential.
All three studies accessed device-specific information stored by the questionnaire platform, SoSci Survey, such as the type of device (computer, TV device, tablet, mobile phone, unknown) and display information (width × height), as presented in .
Table 3. Display size of smartphone and PC screens.
In line with Arthur et al. [Citation5], we argue that desktops’ characteristics are so similar to those of laptops and notebooks that similar results can be expected in cognitive testing. Therefore, we used a binary variable (PC vs. smartphone) to distinguish between devices. The section “Sample description” details how we used data on the interaction mode each user employed to distinguish the various types of devices in the PC category.
Measurement of control variables in the questionnaire
User interaction mode with device
In addition to device-specific variables stored by the questionnaire platform, the survey included self-reported questions about which input device(s) participants used to answer the questionnaire: mouse, touchscreen, touchpad, pen, keyboard, and a blank to fill in other input devices in an open-text field. As we could not prevent the participants’ switching to landscape orientation, we asked them whether they had rotated their screens to complete the questionnaire to interpret the variables related to screen size.
Environmental context and distraction
Our research design kept the effects of distraction similar among device groups, so we also asked participants to report possible distractions caused by the environment when they completed the questionnaire. Whether participants completed the questionnaire in a public or private environment could affect their responses, so we asked participants to select “at home” or enter a different location using a free text box [Citation135, Citation142]. We also asked participants to report the number of activities they carried out while answering the questionnaire, such as checking emails, watching TV, or eating and drinking.
Device usability
In the within-subjects study, we measured comfort with device interaction twice, once for the smartphone and once for the PC. We used 7 of the original 13 items of the device assessment questionnaire from Douglas et al. [Citation29], which was designed to evaluate subjective perceptions of comfort and the ease of a device’s interaction with input devices like a touchpad, a mouse, or a touchscreen. All items were measured on 5-point scales with various verbal anchors (e.g., “The physical effort required for operation was (1: too low - 5: too high).”) We recoded three items so higher scores for all items represented more comfort, and we calculated an average score for comfort with the device’s interaction with the input device. The Cronbach’s alpha for the instrument was .86 for smartphones and .83 for PCs.
Typing test
To control for ease of typing on the devices, we developed a typing test for the within-subjects study that was executed twice, once for the smartphone and once for the PC. We asked participants to enter a selection of ten words as quickly and as accurately as possible. We used the five most common nouns and verbs in the German language, the participants’ native language [Citation29].
Demographics
We collected the participants’ demographic data for gender, age, level of education, current field of study (as all participants were students), and, if applicable, current employment area, working hours, and job title.
Rational and intuitive decision styles
To measure participants’ predisposition toward using Type 1 or Type 2 processing, we used the rational and intuitive decision styles scale [Citation52], with five items for each decision style, answered on a 5-point Likert scale (from “strongly disagree” to “strongly agree”). For example, for the rational scale, we used the item “Investigating the facts is an important part of my decision-making process,” and for the intuitive scale, we used the item “When making decisions, I rely mainly on my gut feelings.” Reliability analysis demonstrated internal consistency for the rational and intuitive decision styles scales in our dataset (Cronbach’s α = 0.86 and α = 0.82 in the between-subjects sample with self-selection; α = 0.82 and α = 0.78 in the randomized between-subjects sample; and α = 0.88 and α = 0.85 in the within-subjects sample).
Online Appendices B and C provide additional analyses with the control variables.
Operational hypotheses
Operational hypothesis: Choice between intuitive and reflective answers
We derived operational hypotheses from our general hypothesis, H1. Since we used a cognitive reflection test in our study, our operational hypotheses reflect that we rely on two typical scoring techniques for cognitive reflection tasks: the number of intuitive (incorrect) responses and the number of reflective (correct) responses [Citation100]. The intuitive score primarily measures the “lack of willingness or ability to engage in analytic reasoning to question the default answer” [Citation100, p. 346] and the “trust or faith that a person has in his or her ‘gut feelings,’” while the reflective scores serve as a proxy for the “ability to reflect upon and ultimately override the intuitive responses” [Citation100, p. 342]. Although the intuitive and the reflective score are structurally interdependent, as the answer options are mutually exclusive and, therefore, negatively correlated [Citation16, Citation99], we consider it relevant to report the results for both measures as dependent variables, as the reflective score does not in itself distinguish between intuitive and other incorrect responses. Our first operational hypothesis proposes that, if smartphones lead to (intuitive) Type 1 thinking, intuitive responses should increase sharply relative to other responses, and intuitive responses should be chosen significantly more often on a smartphone than they are on a PC (H1a). In contrast, using a PC is expected to trigger more (reflective) Type 2 processing than using a smartphone does (H1b).
H1a/boperational: Using a smartphone leads to more intuitive answers (1a) and fewer reflective answers (1b) than using a PC.
Operational hypothesis: Response times for intuitive answers
In the time before an answer for a cognitive reflection task is chosen and submitted in an online test, several information processing steps take place: perceiving the stimulus, making the decision, choosing an answer option, and entering the answer [Citation5].
Although the dichotomy of dual processing types is often described as thinking “fast or slow” [Citation26, Citation62], Type 2 processing cannot be measured directly in terms of longer response times [Citation7, Citation128, Citation139]. Still, response times can offer valuable insights in interpreting answer choices. Additionally, using speeded tasks is a typical experimental manipulation to disable Type 2 processing and ensure that decisions are based on Type 1 processing [Citation36]. Evans and Stanovich [Citation36, p. 225] describe the dichotomy of being “fast” versus “slow” as a “typical correlate” of Type 1 versus Type 2 processing but not as a “defining feature.” Therefore, we expand our H1a in proposing that more “intuitive” answers will be given when one uses a PC by considering the response times of such intuitive responses in H1c. Shorter response times for incorrect answers in cognitive reflection tests are due to either a “detection failure” or the lack of “mindware” like mathematical skills [Citation125]. If options are available for responses other than the intuitive and reflective responses, we believe it is more likely that participants will select another incorrect response than that they will stick with an intuitive response. Thus, fast, intuitive responses should primarily reflect a “recognition failure” and an absence of Type 2 processing.
Although Type 1 processing does not inevitably lead to an intuitive answer [Citation131], as when the answer to a task on a cognitive reflection test is already known and can be retrieved only from memory, without cognitive effort, we argue that fast, intuitive answers indicate miserly processing better than the choice of answer on its own. Since the response time for an intuitive response can indicate whether it was actually caused by Type 1 thinking, we hypothesize that:
H1coperational: Using a smartphone leads to shorter response times for intuitive answers than using a PC.
We do not posit a device-dependent hypothesis about the response time for reflective responses because longer answer times are likely to involve factors that are not directly related to smartphone use. A very short time to answer could be related to guessing or prior knowledge about a reflective task, and a very long response time could be related to task interruption or greater effort, depending on the individual mindware [Citation125].
Operational hypothesis: Self-selection
H2 proposes that the difference in using Type 1 intuitive processing and Type 2 reflective processing between smartphones and PCs is more pronounced when participants choose the device to use. To test this hypothesis, we compared the results of the between-subjects design with self-selection with the results of the other two research designs we used in the study, as summarized in operational H2:
Hypothesis 2operational: The difference in the use of Type 1 and Type 2 processing between smartphones and PCs is more pronounced in the between-subjects design with self-selection than it is in the between-subjects design with randomization and the within-subjects design.
Sample selection and study invitation
In line with other studies, such as Tzur and Fink [Citation142, p. 6], we use student participants to increase “control over individual differences in cognitive expertise.” Three relatively homogeneous samples drawn from the same population of students in a German-speaking university facilitate the comparison of cognitive test scores. For the between-subjects study with self-selection, we used the university’s internal email service for study invitations, and those who participated were entered into a prize drawing with five chances to win €50. To ensure sufficient motivation for the between-subjects study with randomization and the within-subjects study, we recruited undergraduate business students by offering 5 percent course credit in an information systems course for participating. Potential participants were informed that their performance in the study would not affect their course credit because questionnaire responses would be anonymous. No further actions were taken to incentivize correct answers in the cognitive reflection test because such interventions were reported to lead to cheating in cognitive reflection tests in online unproctored tests [Citation77] and distortion in answer times [Citation33].
We asked participants to avoid turning the smartphone and using it in the horizontal position to avoid confounding variations of screens. (See, e.g., Sanchez and Branaghan [Citation114] for the effect of screen orientation on reasoning performance.)
We used a block-structured randomization procedure for the second between-subjects study. We used email to invite 297 students who were enrolled in an introduction to information systems course to participate in the study. We crafted two emails, one with the instruction to answer the questionnaire on a smartphone (in vertical format), the other one to answer it on a PC (or laptop/notebook). The two emails each had a unique link to the questionnaire, based on the device the participants were to use. To ensure that each device condition would be answered by an equal proportion of men and women, we grouped the students’ email-addresses by gender prior to randomization.
In the within-subjects design, we provided two links to the questionnaire and asked participants to open one questionnaire link on a computer and the other one on a smartphone. To link the two questionnaires, random numbers were generated for each questionnaire web page call, and the respondents entered these numbers on the opposite device. The procedure worked well, as demonstrated by the low number of questionnaires that we had to exclude because instructions were not followed (3 cases).
Sample description
We excluded nine participants from the between-subjects dataset with self-selection and four from the randomized between-subjects dataset because they did not complete the questionnaire in a quiet environment (at home or in a learning facility at the university) but did so on a bus or train or while walking. In the randomized between-subjects design, we excluded thirteen participants because they indicated that they had taken part in the study in an earlier semester. In the within-subjects data-set, we also excluded 22 questionnaires that were completed on only one device, on which participants did not enter correct identification numbers, or that were both completed on a PC (3 cases). We excluded all questionnaires that were completed using end-devices in the PC category if the recorded height was larger than the width (7 in the between-subjects design with self-selection, 6 in the randomized between-subjects design, 3 in the within-subjects design), as using such a rare device blurred the line between a smartphone and a PC. Similarly, we discarded questionnaires from participants who indicated that they had rotated the screen (3 in the between-subjects design with self-selection, 2 in the randomized between-subjects design, 1 in the within-subjects design). Thus, we ensured that all smartphone screens were used vertically positioned and all PC screens were horizontally positioned. The final between-subjects sample with self-selection consisted of 342 students (125 men, 215 women, and 2 other, with a mean age of 22.79 years, ranging from 18 to 39 years), while the randomized between-subjects sample consisted of 171 students (90 men and 81 women, with a mean age of 22.36 years, ranging from 18 to 32 years), and the within-subjects sample had 310 students (146 men and 159 women, and 5 unknown, with a mean age of 21.77 years, ranging from 19 to 43 years), as summarized in . shows that, in the within-subjects sample, the order in which the devices were used and the order of the parallel test versions were balanced.
Table 4. Sample size and place of execution.
Table 5. Sample distribution of experimental groups in the within-subjects design.
We conducted an outlier analysis prior to analyzing the relationships between device and response time because it was apparent that some time values (e.g., 6,219 seconds) could have been caused only by a prolonged interruption, not by extended contemplation of the task. Based on the standardized z-values of the individual recorded values and the strict criterion [-1.96 ≤ z ≤ 1.96], 135 outliers among 6,457 time recordings (2 percent) in the between-subjects design with self-selection, 91 of 2,990 time recordings (3 percent) in the randomized between-subjects design, and 148 of 5,480 time recordings (3 percent) in the within-subjects design were excluded. We identified outliers separately for wrong, reflective, and intuitive answers because their answer times differ systematically.
Results
Choice between reflective and intuitive answers
We used analysis of variance (ANOVA) and linear mixed models to analyze data on the item level to examine the data collected on the participant level.
Within-subjects dataset
Data for the within-subjects sample were analyzed with mixed-design ANOVAs using the GLM module of SPSS 25 with the within-subjects factor device (PC, smartphone) and two between-subjects factors as control factors with two levels each (parallel test version: test version A on the PC and version B on the smartphone versus test version B on the PC and version B on the smartphone; device order: PC first and smartphone second vs. smartphone first and PC second). The percentage of intuitive answers and the percentage of reflective answers were used as dependent variables and ANOVAs were conducted for both separately. Participants solved 59.50 percent (SD = 24.46) of tasks correctly on the PC and 59.18 percent (SD = 24.40) correctly on the smartphone, while the incorrect intuitive answer option was chosen 28.42 percent (SD = 20.21) of the time on the PC and 28.71 percent (SD = 24.40) of the time on the smartphone. The strikingly similar solution percentages demonstrate that the test’s parallel versions were of comparable difficulty. presents the mean choice of answer options across devices separately for each parallel test version per device, while controlling for gender.
Figure 4. Distribution of answer options in the within-subjects design dataset.
Both the within-subjects effect of device for intuitive answers, F(1,307) = .92, p = 761, and the within-subjects effect of device for reflective answers, F(1,307) = .077, p = .782 were non-significant. , which provides detailed statistics, shows that neither a between-subjects effect nor any interaction effect was significant (all p > .162). However, the intuitive decision style was a significant predictor of the percentage of reflective answers and a marginally significant predictor of the percentage of intuitive answers and gender was a significant predictor of the percentage of intuitive answers.
Table 6. ANOVA results of the within-subjects design dataset.
Between-subjects dataset (self-selection)
In the first model that analyzed the between-subjects sample, two between-subjects ANOVAs were calculated, one using the percentage of intuitive answers and the other using the percentage of reflective answers as the dependent variable and both using the device (PC, smartphone) as the independent variable. shows that, without including any control variables, the devices’ effect on reflective responses was significant, F(1,340) = 8.46, p = .004, with a medium effect size (η2 = .024). The participants in the smartphone group correctly solved an average of 52.74 percent (SD = 24.95) of the tasks, while those in the PC group solved 60.36 percent (SD = 22.83). In addition, the participants in the smartphone group selected the intuitive response options more often (34.16 percent, SD = 19.35) than participants in the PC group did (28.58 percent, SD = 18.21), yielding a small-to-medium effect size F(1,340) = 7.30, p = .007, η2 = .021.
Table 7. ANOVA results of the between-subjects design with self-selection dataset.
When the participants’ gender (female, male) was included as a between-subjects factor (which itself was highly significant), the difference in results based on the device used was still significant for reflective answers (F(1,37) = 3.97, p = .047, η2 = .012) and marginally significant for intuitive answers (F(1,337) = 2.93, p = .09, η2 = .009). , which provides participants’ mean choice of response options based on the device used, shows that participants’ performance in terms of reflective responses was higher in the PC group than it was in the smartphone group, while the likelihood of an intuitive response from the PC group was lower than it was in the smartphone group.
Figure 5. Distribution of response options in the between-subjects design with self-selection dataset.
Figure 6. Distribution of response options in the randomized between-subjects design dataset.
When we include the intuitive decision style (which reduced the sample size by 10 because not all participants had answered the last part of the questionnaire), the difference in results based on the device used was rendered insignificant, which provides a convincing argument for differences’ being found in the between-subjects dataset but not in the within-subjects dataset. The intuitive decision style was a significant influencing factor for both the percentage of intuitive answers, F(1,327) = 4.55, p = .03, and reflective answers, F(1,327) = 12.90, p < .001.
Between-subjects dataset (fully randomized)
In the randomized between-subjects dataset, participants correctly solved 59.37 percent (SD = 23.06) of the tasks when they used a PC and 58.95 percent (SD = 22.34) when they used a smartphone, while they chose the intuitive response option 29.59 percent (SD = 18.09) of the time with the PC and 28.69 percent (SD = 17.18) of the time with the smartphone (see ). Between-subjects ANOVAs with the device (PC, smartphone) as the only independent variable revealed no difference for the scores for either reflective answers or intuitive answers (). This result remained unchanged when the additional variable of gender was added in model 2 and when gender and intuitive decision style were added in model 3. Participants’ gender (female, male) as a between-subjects factor in the analyses was the only significant influencing factor (F(1,167-168) ≥ 7.12, p ≤ .008).
Table 8. ANOVA results of the randomized between-subjects design dataset.
Answer time for reflective and intuitive answers
We used linear mixed models provided by the packages lme4 [Citation12] and lmerTest [Citation72] in R (www.r-project.org) to analyze the influence of the device (smartphone as the baseline, PC) and the response type (intuitive response as the baseline, reflective response, wrong response), as well as the effect of the interaction between device and response type on the response time. (See for full results.) For the within-subjects study, we also included whether the question was asked in the first or second part of the questionnaire as an additional predictor (cognitive reflection task order: first part as the baseline, second part). Instead of using average values, the mixed model can take into account random variations in participants’ cognitive reflection, differences in individual time investment, variations in the difficulty of cognitive reflection tasks, and the persuasive power of intuitive response options in a single model [Citation154]. We added a random effect for the participant and a random effect for the cognitive reflection item with slopes for different response types (and the order of cognitive reflection tasks in the within-data sample); thus, the model assigns a specific intercept for each participant and item. We first added crossed random effects for participants and items, using all intercepts and random participant and item slopes for all the predictor variables, but we removed terms that were close to zero to achieve convergence and a non-singular fit of the final model [Citation10]. By excluding the random slope for the crossed random effect for the participant and the device used, we have to assume that the device effect is invariant across the population.
Table 9. Results of linear mixed models analyses for response time.
As hypothesized, shorter response times for intuitive responses were associated with using a smartphone (b = 3.77, p = .012) in the within-subjects sample; in other words, intuitive answers were given faster on the smartphone than they were on the PC. The significant interaction (b = -4.60, p = .013) between the type of device and the type of response (reflective instead of intuitive) indicates that the PC’s influence on response speed was weaker/non-existent when the user gave correct answers, as shown in . (When interpreting , keep in mind that, in the between-subjects designs, other participants completed the tasks on the PC and smartphone.) No main effect of the choice of device on response time was observed in the between-subjects samples. shows the distribution of the response times for the two types of responses on the PC and the smartphone (within-subjects sample) and that the distribution of intuitive responses on smartphones was more left-skewed for short response times, while it was flatter for PCs.
Figure 7. Mean response time for intuitive, reflective and wrong responses on smartphones and on the PC.
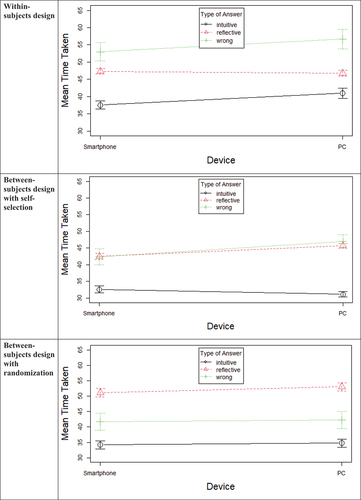
Figure 8. Response times for different response types on the PC and the smartphone (within-subjects sample).
In all three samples, reflective responses (within-subjects sample: b = 8.20, p = .005; between-subjects sample with self-selection: b = 9.01, p = .001; between-subjects sample with randomization: b = 14.71, p < 0.001) and wrong responses (within-subjects sample: b = 14.84, p < .001; between-subjects sample with self-selection: b = 12.74, p = .001; between-subjects sample with randomization: b = 8.50, p = .002) were associated with longer response times than intuitive responses were. Participants also took less time for cognitive reflection tasks in the second half of the questionnaire (within-subjects sample: b = -6.42, p < .001). The significance of the shorter response times for intuitive answers on smartphones versus PCs and the interaction effect of the type of response (intuitive vs. reflective) and device are robust against several modifications:
comparing the smartphone group only with a PC subset group that used mouse and keyboard only, as touchpad use heightened overall response time values. (See for response times with various interaction modes; response times for reflective responses on smartphones were 27 percent longer than they were for intuitive responses, while they were only 10 percent longer on a PC operated with a mouse.)
using only time values <200 seconds as a stricter outlier criterion, as most answers required less than 200 seconds
using the logarithmized time values to correct for the left-skewed distribution of response time.
In addition, the mean times per response type were similar when only those responses where no text was entered (i.e., the response was selected only by clicking a radio button) were considered.
Figure 9. Response times for different response types when using different input devices (within-subjects sample).
We also re-examined the research question using a traditional paired t-test for the within-subjects sample by first aggregating mean response times for each participant, type of device, and type of answer. The results were not significant for differences in the response time for wrong and reflective answers, but intuitive answers tended to be given faster on smartphones (MSM = 39.09, SDSM = 27.90) than on the PC (MPC = 43.18, SDPC = 35.28; tdf=245 = 1.72; p = .09; dCohen = -0.26). Therefore, major insights from the mixed models analysis were replicated with these paired t-tests.
Discussion
The research presented in this paper set out to determine the influence of smartphones on cognitive reflection and intuition, as summarized in . We found no support for H1, which proposed a general effect of the type of device on the choice between intuitive (H1a) and reflective (H1b) responses. Although “absence of evidence is not evidence of absence” [Citation1, p. 485], we consider device-dependent differences in cognitive reflection to be highly unlikely based on the data collected in the within-subjects design. We controlled for various factors. For example, influence factors that we suspected would lead to a priming effect of smartphones for intuitive processing—touchscreen interaction and a device-specific use pattern favoring social media use on smartphones—were present in our samples, but they did not trigger significant device-related effects on cognitive reflection. The within-subjects design also controlled for other factors, such as distractions, that could increase demands on working memory according to the structural characteristics/information-processing framework [Citation5].
Table 10. Support for hypotheses.
The absence of differences in the choice of device for Type 1 and 2 processing contradicts reported significant differences in cognitive performance favoring PCs [Citation4, Citation69]. Likewise, they challenge the general impression that smartphones might induce Type 1 processing [Citation142]. It is possible that this impression is created by users’ being likely to use smartphones more often for tasks to which heuristics and Type 1 processing can be successfully applied, so they are a good choice from an ecological fit perspective [Citation42, Citation55]. However, this preconception does not hold when the same tasks, all of which require reflective Type 2 processing to be solved correctly, are tested on both devices, as was the case in our study.
Our findings also help to clarify the contextual subtleties that are at play for Type 1 and 2 processing based on the type of device used. While studies have focused on cognitive ability measures that reflect the performance of Type 2 processing, they do not focus on the important question concerning when users employ Type 1 or Type 2 processing. Thus, prior results can only partly be compared to our findings. For example, Tzur and Fink’s [Citation142] choice of cognitive tasks had only “random” wrong answers. In typical mental ability tasks, participants are not tricked into accepting an answer that sounds correct at first sight if they are not reflecting deeply. However, our findings are in line with studies that have challenged the view that smartphones lower cognitive performance [Citation140]. For example, studies that have tested participants’ numerical and deductive reasoning performance when they used a PC or a smartphone did not find relevant differences [Citation17, Citation47]. Our findings also confirm research findings on lower reasoning performance, interpreted as being due to smaller screen size or scrolling [Citation46, Citation114], as our study held these factors constant.
Concerning H1c, which looks at whether Type 1 processing leads to intuitive answers, our results show that intuitive responses are “faster” responses. This finding corresponds with observations that “fast,” and “slow” thinking can be measured in terms of time spent [Citation60]. This finding, which is much in line with the general assumptions of dual-process theories [Citation36], supports previous empirical findings on time measures [Citation60, Citation139]. Although users did not choose intuitive responses more often on the smartphone than they did on the PC (thus rejecting H1a), when they did choose these responses, they did so faster on a smartphone than they did on a PC. This result suggests that smartphone users react too quickly before inhibitory control can suppress the intuitive decision choice made through Type 1 processing [Citation32, Citation96, Citation139]. However, the finding was limited to the within-subjects data set (as the only dataset in which one user solved cognitive reflection tasks on both devices). The effect is likely not large enough to be measurable in a between-subjects design across different users on different devices.
The faster Type 1 response did not necessarily translate into an efficiency advantage, as correct reflective responses were not answered faster on the smartphone. Since the effect occurred only with intuitive responses, an underlying priming effect for “faster” intuitive processing is more likely than other explanations. We can also rule out three other interpretations. First, according to Fitts’ [Citation37] law of human motion, the proximity of fingers to input devices could result in different speeds on a smartphone, a touchpad, or a PC used with a mouse [Citation20], but in our dataset, both the typing test and interaction comfort favored PCs over smartphones. Second, there is no evidence that questionnaires are generally completed faster on smartphones than they are on PCs [Citation2, Citation23]. Third, users might focus more closely on the task when they use smartphones than when they use PCs, as Melumad and Meyer [Citation86] proposed, but, if true, this effect should have led to faster correct answers, which it did not.
Overall, our results related to the notion of faster intuitive responses on smartphones are much in line with findings that mobile devices are related to impulsive user behavior [Citation110, Citation153]. Our results are also in line with the results of Wang et al. [Citation145], who reported touchscreens’ polarizing and opinion-amplifying effect on consumer attitudes. In this respect, a shorter reaction time could also indicate reinforcement of the intuitive reaction. Although Wang et al. [Citation145] attributed the polarization effect to a mediating influence of vividness (because participants could imagine the evaluation objects more vividly on the touchscreen), we argue that polarizing effects could also be due to other aspects of the device, such as amplification of emotional content, which have also been observed in the context of online textual reviews [Citation19, Citation80, Citation85] and online complaints [Citation156]. Therefore, smartphones may have a general “reinforcing” effect on underlying intuitive or impulsive responses.
Finally, both the within-subjects and the two between-subjects studies indicate that only when participants are able to choose the smartphone as their preferred device do they also think more intuitively when they use it, supporting H2. This result is also supported by the absence of differences in cognitive reflection between the devices when we controlled for demographic variables such as gender and cognitive style in the between-subjects study with self-selection, when we randomized devices in the second between-subjects study, and when we held individual differences in cognitive abilities and the situation constant in the within-subjects study. Our results are in line with Brown and Grossenbacher [Citation17], who tested general mental ability with the Wonderlic Personnel Test randomized on smartphones and PCs and found no difference in the device used, concluding that a self-selection bias might explain many of the earlier significant results on the differences between smartphone and PC use. Our results are also consistent with research that has argued that intensive smartphone use attracts “people of a certain cognitive profile” [Citation39, p. 1066] and with the argument of researchers in survey science [Citation78], e-commerce [Citation74], and personal testing [Citation5, Citation140] that the use of quasi-experimental designs with participants’ choosing the device to use versus randomization of participants to devices may account for the contradictory study results. Indeed, our results show that participants who chose to fill out the questionnaire on a smartphone considered themselves significantly more intuitive and less reflective than those who completed it on PCs. These results are in line not only with the hypothesized self-selection effect and previously identified correlations between variables related to smartphone use and higher impulsivity [Citation58, Citation110, Citation132] and higher scores in intuitive Type 1 processing [Citation11, Citation144], but also with prior findings that subjective ratings of cognitive performance on a device do not necessarily correspond to objective measurement. For instance, users tend to overestimate their cognitive performance on smartphones and actually perform better on laptops [Citation53].
Limitations
Our study has several limitations. One limitation is the minimalistic setting of cognitive reflection tasks, including the artificially constrained selection of information in the cognitive reflection tasks, as in Tzur and Fink [Citation142]. Even though this setup facilitated experimental comparison, differences between smartphones and PCs may become more pronounced when tasks are loaded with more detail, increasing extraneous cognitive load, lowering performance on cognitive tasks [Citation142], and leaving open the possibility that some of the observed effects might have been stronger had we used longer text or more graphics. Another limitation is that explorative search for supplemental information to make a reflective decision is less prevalent on smartphones than it is on PCs because the search effort involved is greater [Citation41, Citation107], which could also lead to stronger differences between devices when used on real-life tasks. Still, we believe that structuring the design of the cognitive reflection tasks in this manner is consistent with the study’s goals and provides a reasonable test of our hypotheses without adding extraneous cognitive load. We did not vary the extrinsic cognitive load but tried to hold it constant to focus on the device used as a major factor in extrinsic cognitive load.
Finally, using a student sample could result in underestimating the differences between the devices since students are predisposed to solving such tests correctly because, for example, working memory decreases with age [Citation112] and because this generation is highly proficient in the use of smartphones. In the context of our research questions, eliminating potentially confounding demographic factors by using a homogenous sample was more critical than ensuring generalizability because of the high inter-individual variance in cognitive reflection test scores caused by, for example, differing levels of motivation to complete the tasks correctly.
Future research could identify groups of people who might be vulnerable to switching to Type 1 processing since smartphone use is not “monolithic” and users use various functionalities [Citation111, p. 157].
Contributions
The work presented in this paper provides insights on the impact of the choice of device in cognitive performance [Citation6, Citation140], particularly as the study is the first experimental study on a potential “priming” effect of smartphones on Type 1 and 2 cognitive processing. Our work extends the structural characteristics/information-processing framework [Citation6, Citation140]. While general mental-ability tests measure individual competence in Type 2 processing, they neither differentiate between Type 1 and 2 processing nor take into account potential priming effects. Therefore, we connect the recent research stream on the cognitive effects of smartphone use, specifically the research stream of smartphones’ cognitive costs [Citation146], with dual-process theories of cognition.
We could not confirm a general priming effect for intuitive Type 1 processing on smartphones. We found that, although people are less inhibited about intuitive Type 1 decisions when they use a smartphone and such decisions are made faster on smartphones, average decisions outcomes do not differ. Therefore, we conclude that smartphones do not prime for intuitive Type 1 processing.
We did not observe other indicators of poor processing that might affect the quality of a decision, such as susceptibility to position bias, in our data sets. Therefore, biases that are based on the order of decision options do not appear to be greater on smartphones than they are on desktops, confirming earlier research that has questioned strong primacy effects on smartphones [Citation84, Citation138, Citation149].
The lack of differences between devices for priming Type 1 processing also suggests that previous studies’ results on Type 1 and 2 processing are valid for both devices independently. This finding is significant for the field of information systems. For example, research has linked Type 1 processing to greater susceptibility to priming effects in e-commerce, such as when higher anchor prices increase the willingness to pay in online auctions [Citation28]. Moreover, adoption of apps and decisions about usage are influenced by Type 1 heuristics that are based on experience [Citation67], and marketers may need to emphasize past successful technology adoptions to increase future successful adoption and use of apps. Moreover, to curb the spread of fake news, fake news flags can be used to create cognitive dissonance, triggering Type 2 processing [Citation90], which should be equally effective on all devices.
Our findings also contribute substantially to the theoretical understanding of reaction time in the context of cognitive theories of dual processing. By using a multiple-choice test with low psychomotoric demands [Citation121] and a high number of tasks (as opposed to Frederick’s [Citation38] original three items) that focus not only on numerical abilities but also on verbal tasks [Citation120], we provide evidence that intuitive responses are made faster than either wrong or reflective responses, regardless of the device used to respond. In terms of research methodology, our study also provides a new, more comprehensive version of a multiple-choice cognitive reflection test that other researchers can use.
One of our findings’ most important implications is related to self-selection. Accounting for self-selection seems to be a missing piece of the puzzle related to resolving the many contradictory and inconclusive findings on differences between devices that have been presented to date. Our data from a robust experimental design presents evidence that identifying differences between devices might be the result only of self-selection bias, as when participants are free to choose their device, it is likely that decisions on smartphones would, on average, be less reflective and more intuitive. However, this effect is not due to the general processing of decisions using smartphones but to users’ preference for one or the other type of device. We urge researchers to pay attention to self-selection bias when they use data sets, such as web-scraping data sets, that are based on participants’ selecting the device to use. Such findings should be interpreted with caution, and causal interpretations should be made only when they are supplemented by experimental data.
Our findings also make valuable practical contributions. The insights from this study will lead to a better understanding of the role of the device used on cognitive reflection. Differences in the use of Type 1 and Type 2 processing could explain user behaviors across devices in various application contexts, from consumer decisions in mobile shopping, online reviews, and completing online forms to user behavior in social media, and may have useful implications for the design of online decision environments.
As such differences show up only when users select their preferred devices, online decision environments should be designed with this selection bias in mind. For example, even far-ranging decision-making on smartphones, such as online voting, need not be discouraged just because the use of smartphones is apparently not be suitable for Type 2 decision-making. Our study uses a smartphone-optimized layout with an amount of information that did not require scrolling; therefore, these requirements would still need to be met. Designers of online environments would still need to acknowledge that the effort required to seek additional information [Citation41, Citation107] is higher with reflective decisions and processing information [Citation111] is more difficult on smartphones, which could cause differences in the device used in real-world tasks that depend on Type 1 and Type 2 processing. To address the greater external demands on working memory when a smartphone is used, sensor data from the smartphone could be used to provide feedback to individuals about whether the current environment is likely to compromise their ability to make a considered, reflective decision using Type 2 processing. Such interventions have already been proposed by, for example, using acceleration data to identify the movement of users on smartphones [Citation56, Citation65] and could include location-based information or sound to identify, for example, a busy and noisy outdoor location.
Moreover, since times required in making reflective answers were generally longer than those required for intuitive answers, individual feedback could be provided when designing online decision environments, especially when users make particularly fast decisions. For example, users could be prompted to answer additional questions to interrupt them from making mindless decisions using a quick click and to encourage Type 2 processing.
Conclusion
This paper reports on three experiments conducted to clarify the conditions under which smartphones may or may not “prime” for intuitive Type 1 processing. It contributes to the question concerning whether we tend to think “faster,” more intuitively, and less reflectively when using these ubiquitous devices. The study’s findings highlight that it is the individual’s preference for selecting his or her own device that explains differences in the type of cognitive processing used. Our findings provide a much-needed nuanced explanation for the contextual subtleties that are at play in Type 1 and 2 processing when different devices are used and cautions researchers against neglecting self-selection bias as an important factor in explaining differences between results when different devices are used. Still, with the increasing shift of decision tasks to the mobile context, much remains to be learned about cognitive performance using such devices.
Supplemental Material
Download MS Word (57.9 KB)Disclosure statement
The authors have no conflicts of interest to disclose.
Supplemental material
Supplemental data for this article can be accessed online at https://doi.org/10.1080/07421222.2023.2196769.
Additional information
Notes on contributors
Kathrin Figl
Kathrin Figl ([email protected]; corresponding author) is Associate Professor for Information Systems at the University of Innsbruck, Austria. Her research focuses on human-centric development and design of information systems, and she has published over 80 research papers and articles in Journal of the Association for Information Systems, Decision Support Systems, and Information & Management, among others. Dr. Figl served as track chair for the track “Cognition and Human Behavior in Information Systems” at ECIS 2019-2023 and for the track “HCI and Human-Robot Interaction” at ICIS 2022.
Ulrich Remus
Ulrich Remus ([email protected]) is Professor and Head of the Department of Information Systems, Production and Logistics Management at the University of Innsbruck. His research focuses on IS project management and control, algorithmic management, and negative consequences of IS, and has appeared in such journals as MIS Quarterly, Information Systems Research, European Journal of Information Systems, Information Systems Journal, and Journal of Information Technology. Dr. Remus regularly serves as a track chair and associate editor for major IS conferences and is on the editorial board of Information & Management.
References
- Altman, D.G.; and Bland, J.M. Statistics notes: Absence of evidence is not evidence of absence. British Medical Journal, 311, 7003 (1995), 485.
- Antoun, C.; and Cernat, A. Factors affecting completion times: A comparative analysis of smartphone and PC web surveys. Social Science Computer Review, 38, 4 (2020), 477–489.
- Antoun, C.; Katz, J.; Argueta, J.; and Wang, L. Design heuristics for effective smartphone questionnaires. Social Science Computer Review, 36, 5 (2018), 557–574.
- Arthur Jr., W.; Doverspike, D.; Muñoz, G.J.; Taylor, J.E.; and Carr, A.E. The use of mobile devices in high-stakes remotely delivered assessments and testing. International Journal of Selection and Assessment, 22, 2 (2014), 113–123.
- Arthur, W.; Keiser, N.L., and Doverspike, D. An information-processing-based conceptual fframework of the effects of unproctored internet-based testing devices on scores on employment-related assessments and tests. Human Performance, 31, 1 (2018), 1–32.
- Arthur, W.; Keiser, N.L.; Hagen, E.; and Traylor, Z. Unproctored internet-based device-type effects on test scores: The role of working memory. Intelligence, 67 (2018), 67–75.
- Bago, B.; and De Neys, W. Fast logic?: Examining the time course assumption of dual process theory. Cognition; 158 (2017), 90–109.
- Bago, B.; Frey, D.; Vidal, J.; Houdé, O.; Borst, G.; and De Neys, W. Fast and slow thinking: electrophysiological evidence for early conflict sensitivity. Neuropsychologia, 117 (2018), 483–490.
- Bargh, J.A.; and Chartrand, T.L. Studying the mind in the middle: A practical guide to priming and automaticity research. In H. Reis and C. Judd (eds.), Handbook of Research Methods in Social and Personality Psychology. New York: Cambridge University Press, 2000, pp. 253–285.
- Barr, D.J.; Levy, R.; Scheepers, C.; and Tily, H.J. Random effects structure for confirmatory hypothesis testing: Keep it maximal. Journal of Memory and Language, 68, 3 (2013), 255–278.
- Barr, N.; Pennycook, G.; Stolz, J.A.; and Fugelsang, J.A. The brain in your pocket: Evidence that smartphones are used to supplant thinking. Computers in Human Behavior, 48 (2015), 473–480.
- Bates, D.; Maechler, M.; Bolker, B.; Walker, S.; Christensen, R.H.B.; Singmann, H.; Dai, B.; Scheipl, F.; Grothendieck, G.; Green, P., and Fox, J. Lme4: Linear mixed-effects models using ‘Eigen’ and S4. Version 1.1-23. Series Lme4: Linear Mixed-Effects Models Using ‘Eigen’ and S4. Version 1.1-23, 2020.
- Berger, B.; Matt, C.; Steininger, D.M.; and Hess, T. It is not just about competition with “free”: Differences between content formats in consumer preferences and willingness to pay. Journal of Management Information Systems, 32, 3 (2015), 105–128.
- Brañas-Garza, P.; Kujal, P.; and Lenkei, B. Cognitive Reflection Test: Whom, how, when. Journal of Behavioral and Experimental Economics, 82, 101455 (2019).
- Brasel, S.A.; and Gips, J. Interface psychology: Touchscreens change attribute importance, decision criteria, and behavior in online choice. Cyberpsychology, Behavior, and Social Networking, 18, 9 (2015), 534–538.
- Brosnan, M.; Hollinworth, M.; Antoniadou, K.; and Lewton, M. Is empathizing intuitive and systemizing deliberative? Personality and Individual Differences, 66 (2014), 39–43.
- Brown, M.I.; and Grossenbacher, M.A. Can you test me now? Equivalence of GMA tests on mobile and non-mobile devices. International Journal of Selection and Assessment, 25, 1 (2017), 61–71.
- Brown, R. Consideration of the origin of Herbert Simon’s Theory of “satisficing” (1933‐1947). Management Decision, 42, 10 (2004), 1240–1256.
- Burtch, G., and Hong, Y. What happens when word of mouth goes mobile?, In International Conference on Information Systems, ICIS 2014 Proceedings. Auckland, New Zealand, 2014. https://aisel.aisnet.org/icis2014/proceedings/EBusiness/49
- Buskirk, T.; and Andrus, C. Making mobile browser surveys smarter: Results from a randomized experiment comparing online surveys completed via computer or smartphone. Field Methods, 26 (2014), 322–342.
- Chung, S.; Kramer, T.; and Wong, E.M. Do touch interface users feel more engaged? The impact of input device type on online shoppers’ engagement, affect, and purchase decisions. Psychology & Marketing, 35, 11 (2018), 795–806.
- Collier, J.R.; Dunaway, J.; and Stroud, N.J. Pathways to deeper news engagement: Factors influencing click behaviors on news sites. Journal of Computer-Mediated Communication, 26, 5 (2021), 265–283.
- Couper, M.P.; and Peterson, G.J. Why do web surveys take longer on smartphones? Social Science Computer Review, 35, 3 (2017), 357–377.
- Dadey, N.; Lyons, S.; and DePascale, C. The comparability of scores from different digital devices: A literature review and synthesis with recommendations for practice. Applied Measurement in Education, 31, 1 (2018), 30–50.
- Daikeler, J.; Bach, R.L.; Silber, H.; and Eckman, S. Motivated misreporting in smartphone surveys. Social Science Computer Review, 40, 1 (2020).
- De Neys, W.; and Pennycook, G. Logic, fast and slow: Advances in dual-process theorizing. Current Directions in Psychological Science, 28, 5 (2019), 503–509.
- De Vries, M.; Holland, R.W.; and Witteman, C.L. Fitting decisions: Mood and intuitive versus deliberative decision strategies. Cognition and Emotion, 22, 5 (2008), 931–943.
- Dennis, A.R.; Yuan, L.; Feng, X.; Webb, E.; and Hsieh, C.J. Digital nudging: Numeric and semantic priming in e-commerce. Journal of Management Information Systems, 37, 1 (2020), 39–65.
- Douglas, S.A.; Kirkpatrick, A.E.; and MacKenzie, I.S. Testing pointing device performance and user assessment with the ISO 9241, Part 9 Standard. In SIGCHI Conference on Human Factors in Computing Systems, 1999, pp. 215–222.
- Dunaway, J.; Searles, K.; Sui, M.; and Paul, N. News attention in a mobile era. Journal of Computer-Mediated Communication, 23, 2 (2018), 107–124.
- Dunaway, J.; and Soroka, S. Smartphone-size screens constrain cognitive access to video news stories. Information, Communication & Society, 24, 1 (2021), 69–84.
- Edgcumbe, D.R.; Thoma, V.; Rivolta, D.; Nitsche, M.A.; and Fu, C.H.Y. Anodal transcranial direct current stimulation over the right dorsolateral prefrontal cortex enhances reflective judgment and decision-making. Brain Stimulation, 12, 3 (2019), 652–658.
- Enke, B.; Gneezy, U.; Hall, B.; Martin, D.; Nelidov, V.; Offerman, T.; and van de Ven, J. Cognitive biases: Mistakes or missing stakes? The Review of Economics and Statistics (2021), 1–45.
- Epstein, S.; Pacini, R.; Denes-Raj, V.; and Heier, H. Individual differences in intuitive–experiential and analytical–rational thinking styles. Journal of Personality and Social Psychology, 71, 2 (1996), 390–405.
- Evans, J.S.B.T. Dual-processing accounts of reasoning, judgment, and social cognition. Annual Review of Psychology, 59 (2008), 255–278.
- Evans, J.S.B.T.; and Stanovich, K.E. Dual-process theories of higher cognition: Advancing the debate. Perspectives on Psychological Science, 8, 3 (2013), 223–241.
- Fitts, P.M. The information capacity of the human motor system in controlling the amplitude of movement. Journal of Experimental Psychology, 47, 6 (1954), 381.
- Frederick, S. Cognitive reflection and decision making. The Journal of Economic Perspectives, 19, 4 (2005), 25–42.
- Frost, P., Donahue, P., Goeben, K., Connor, M., Cheong, H.S., and Schroeder, A. An Examination of the Potential Lingering Effects of Smartphone Use on Cognition. Applied Cognitive Psychology, 33, 6 (2019), 1055–1067.
- Furner, C.P.; and Zinko, R.A. The influence of information overload on the development of trust and purchase intention based on online product reviews in a mobile vs. web environment: An empirical investigation. Electronic Markets, 27, 3 (2017), 211–224.
- Ghose, A.; Goldfarb, A.; and Han, S.P. How is the mobile internet different? Search costs and local activities. Information Systems Research, 24, 3 (2013), 613–631.
- Gigerenzer, G.; and Brighton, H. Homo heuristicus: Why biased minds make better inferences. Topics in Cognitive Science, 1, 1 (2009), 107–143.
- Gigerenzer, G.; and Gaissmaier, W. Heuristic decision making. Annual Review of Psychology, 62 (2011), 451–482.
- Gliem, J.A., and Gliem, R.R. Calculating, interpreting, and reporting Cronbach’s Alpha reliability coefficient for likert-type scales. In Midwest Research to Practice Conference in Adult, Continuing, and Community Education, 2003. pp. 82–88. https://scholarworks.iupui.edu/handle/1805/344
- GlobalWebIndex. Distribution of daily time spent online via mobile and PC by internet users worldwide from 2013 to 2019. Statistica, 2019, https://www.statista.com/statistics/428441/share-daily-time-spent-online-mobile-pc/.
- Grant, S.M. How does using a mobile device change investors’ reactions to firm disclosures? Journal of Accounting Research, 58, 3 (2020), 741–775.
- Grelle, D.M.; and Gutierrez, S.L. Developing device-equivalent and effective measures of complex thinking with an information processing framework and mobile first design principles. Personnel Assessment and Decisions, 5, 3 (2019), 4.
- Groß, M.; and Sohn, S. Understanding the consumer acceptance of mobile shopping: The role of consumer shopping orientations and mobile shopping touchpoints. The International Review of Retail, Distribution and Consumer Research, 31, 1 (2021), 36–58.
- Gummer, T.; and Kunz, T. Relying on external information sources when answering knowledge questions in web surveys. Sociological Methods & Research, 51, 2 (2019), 816–836.
- Ha, L.; Zhang, C.; and Jiang, W. Data quality comparison between computers and smartphones in different web survey modes and question formats. Internet Research, 30, 6 (2020), 1763–1781.
- Halali, E.; Meiran, N.; and Shalev, I. Keep it cool: Temperature priming effect on cognitive control. Psychological Research, 81, 2 (2017), 343–354.
- Hamilton, K.; Shih, S.-I.; and Mohammed, S. The development and validation of the rational and intuitive decision styles scale. Journal of Personality Assessment, 98, 5 (2016), 523–535.
- Hamilton, K.A.; and Yao, M.Z. Blurring boundaries: Effects of device features on metacognitive evaluations. Computers in Human Behavior, 89 (2018), 213–220.
- Hartmann, M.; Martarelli, C.S.; Reber, T.P.; and Rothen, N. Does a smartphone on the desk drain our brain? No evidence of cognitive costs due to smartphone presence in a short-term and prospective memory task. Consciousness and Cognition, 86 (2020), 103033.
- Hertwig, R.; and Gigerenzer, G. The “Conjunction Fallacy” revisited: how intelligent inferences look like reasoning errors. Journal of Behavioral Decision Making, 12, 4 (1999), 275–305.
- Höhne, J.K.; and Schlosser, S. Surveymotion: What can we learn from sensor data about respondents’ completion and response behavior in mobile web surveys? International Journal of Social Research Methodology, 22, 4 (2019), 379–391.
- Huff, K.C. The comparison of mobile devices to computers for web-based assessments. Computers in Human Behavior, 49 (2015), 208–212.
- Jeske, D.; Briggs, P.; and Coventry, L. Exploring the relationship between impulsivity and decision-making on mobile devices. Personal Ubiquitous Comput., 20, 4 (2016), 545–557.
- Jhangiani, R.; and Tarry, H. Principles of Social Psychology-1st International Edition. Victoria, B.C.: BCcampus. 2014. Retrieved from: https://opentextbc.ca/socialpsychology/
- Jimenez, N.; Rodriguez-Lara, I.; Tyran, J.-R.; and Wengström, E. Thinking fast, thinking badly. Economics Letters, 162 (2018), 41–44.
- Kaatz, C.; Brock, C.; and Figura, L. Are you still online or are you already mobile? – Predicting the path to successful conversions across different devices. Journal of Retailing and Consumer Services, 50 (2019), 10–21.
- Kahneman, D. Thinking, Fast and Slow. New York: Farrar, Straus and Giroux, 2011.
- Kardos, P.; Unoka, Z.; Pléh, C.; and Soltész, P. Your mobile phone indeed means your social network: Priming mobile phone activates relationship related concepts. Computers in Human Behavior, 88 (2018), 84–88.
- Keib, K.; Wojdynski, B.W.; Espina, C.; Malson, J.; Jefferson, B.; and Lee, Y.-I. Living at the speed of mobile: How users evaluate social media news posts on smartphones. Communication Research (2021), 1–17.
- Kern, C.; Höhne, J.K.; Schlosser, S.; and Revilla, M. Completion conditions and response behavior in smartphone surveys: A prediction approach using acceleration data. Social Science Computer Review, 39, 6 (2020), 1253–1271.
- Keusch, F.; and Yan, T. Web versus mobile web: An experimental study of device effects and self-selection effects. Social Science Computer Review, 35, 6 (2017), 751–769.
- Khatri, V.; Samuel, B.M.; and Dennis, A.R. System 1 and System 2 cognition in the decision to adopt and use a new technology. Information & Management, 55, 6 (2018), 709–724.
- Kim, J.H.; Aulck, L.; Bartha, M.C.; Harper, C.A.; and Johnson, P.W. Are there differences in force exposures and typing productivity between touchscreen and conventional keyboard? Human Factors and Ergonomics Society Annual Meeting, 56, 1 (2012), 1104–1108.
- King, D.D.; Ryan, A.M.; Kantrowitz, T.; Grelle, D.; and Dainis, A. Mobile internet testing: An analysis of equivalence, individual differences, and reactions. International Journal of Selection and Assessment, 23, 4 (2015), 382–394.
- Krebs, D.; and Höhne, J.K. Exploring scale direction effects and response behavior across PC and smartphone surveys. Journal of Survey Statistics and Methodology, 9, 3 (2020), 477–495.
- Krosnick, J.A.; Narayan, S.; and Smith, W.R. Satisficing in surveys: Initial evidence. New Directions for Evaluation, 1996, 70 ( 1996), 29–44.
- Kuznetsova, A.; Brockhoff, P.B.; and Christensen, R.H. Lmertest Package: Tests in linear mixed effects models. Journal of Statistical Software, 82, 13 (2017), 1–26.
- Lambert, A.D.; and Miller, A.L. Living with smartphones: Does completion device affect survey responses? Research in Higher Education, 56, 2 (2015), 166–177.
- Lee, D.; Gopal, A.; and Park, S.-H. Different but equal? A field experiment on the impact of recommendation systems on mobile and personal computer channels in retail. Information Systems Research, 31, 3 (2020), 892–912.
- Liebe, U.; Glenk, K.; Oehlmann, M.; and Meyerhoff, J. Does the use of mobile devices (tablets and smartphones) affect survey quality and choice behaviour in web surveys? Journal of Choice Modelling, 14 (2015), 17–31.
- Liu, Y.; and Wang, D. How does the device change your choice: A goal-activation perspective. In F.F.-H. Nah and C.-H. Tan (eds.), HCI in Business, Government, and Organizations: eCommerce and Innovation. Toronto, Canada: Springer International Publishing, 2016, pp. 446–456.
- Ludwig, J.; and Achtziger, A. Cognitive misers on the web: An online-experiment of incentives, cheating, and cognitive reflection. Journal of Behavioral and Experimental Economics, 94 (2021), 101731.
- Lugtig, P.; and Toepoel, V. The use of PCs, smartphones, and tablets in a probability-based panel survey: Effects on survey measurement error. Social Science Computer Review, 34, 1 (2016), 78–94.
- Maniar, N.; Bennett, E.; Hand, S.; and Allan, G. The effect of mobile phone screen size on video based learning. Journal of Software, 3, 4 (2008), 51–61.
- Mariani, M.M.; Borghi, M.; and Gretzel, U. Online reviews: Differences by submission device. Tourism Management, 70 (2019), 295–298.
- Marty-Dugas, J.; Ralph, B.C.; Oakman, J.M.; and Smilek, D. The relation between smartphone use and everyday inattention. Psychology of Consciousness: Theory, Research, and Practice, 5, 1 (2018), 46.
- März, A.; Schubach, S., and Schumann, J.H. “Why would I read a mobile review?” Device compatibility perceptions and effects on perceived helpfulness. Psychology & Marketing, 34, 2 (2017), 119–137.
- Mason, R.; and Huff, K. The effect of format and device on the performance and usability of web-based questionnaires. International Journal of Social Research Methodology, 22, 3 (2019), 271–280.
- Mavletova, A. Data quality in PC and mobile web surveys. Social Science Computer Review, 31, 6 (2013), 725–743.
- Melumad, S.; Inman, J.; and Pham, M. Selectively emotional: How smartphone use changes user-generated content. Journal of Marketing Research, 56 (2019), 259–275.
- Melumad, S.; and Meyer, R. Full disclosure: How smartphones enhance consumer self-disclosure. Journal of Marketing, 84, 3 (2020), 28–45.
- Melumad, S.; and Pham, M.T. The smartphone as a pacifying technology. Journal of Consumer Research, 47, 2 (2020), 237–255.
- Meyer, A.; Zhou, E.; and Shane, F. The non-effects of repeated exposure to the cognitive reflection test. Judgment and Decision Making, 13, 3 (2018), 246.
- Moravec, P.L.; Kim, A.; and Dennis, A.R. Appealing to sense and sensibility: System 1 and System 2 interventions for fake news on social media. Information Systems Research, 31, 3 (2020), 987–1006.
- Moravec, P.L.; Minas, R.K.; and Dennis, A.R. Fake news on social media: People believe what they want to believe when it makes no sense at all. MIS Quarterly, 43, 4 (2019), 1343–1360.
- Mosleh, M.; Arechar, A.; Pennycook, G.; and Rand, D. Cognitive reflection correlates with behavior on Twitter. Nature Communications, 12 (2021).
- Naylor, J.S.; and Sanchez, C.A. Smartphone display size influences attitudes toward information consumed on small devices. Social Science Computer Review, 36, 2 (2017), 251–260.
- Nelson, J.L.; and Taneja, H. The small, disloyal fake news audience: The role of audience availability in fake news consumption. New Media & Society, 20, 10 (2018), 3720–3737.
- Newman, N.; Fletcher, R.; Kalogeropoulos, A.; and Nielsen, R. Reuters Institute Digital News Report 2019. Series Reuters Institute Digital News Report 2019, Reuters Institute for the Study of Journalism, 2019, https://ssrn.com/abstract=3414941.
- Novak, T.P., and Hoffman, D.L. The fit of thinking style and situation: New measures of situation-specific experiential and rational cognition. Journal of Consumer Research, 36, 1 (2008), 56–72.
- Oldrati, V.; Patricelli, J.; Colombo, B.; and Antonietti, A. The role of dorsolateral prefrontal cortex in inhibition mechanism: A study on cognitive reflection test and similar tasks through neuromodulation. Neuropsychologia, 91 (2016), 499–508.
- Papismedov, D., and Fink, L. Do Consumers make less accurate decisions when they use mobiles? (2019). ICIS 2019 Proceedings. 16. https://aisel.aisnet.org/icis2019/behavior_is/behavior_is/16
- Pennycook, G. A Perspective on the theoretical foundation of dual process models. Dual Process Theory 2.0: Routledge, 2017, pp. 13–35.
- Pennycook, G.; Cheyne, J.A.; Koehler, D.J.; and Fugelsang, J.A. Is the cognitive reflection test a measure of both reflection and intuition? Behavior Research Methods, 48, 1 (2016), 341–348.
- Pennycook, G., Fugelsang, J.A., & Koehler, D.J. (2015). Everyday consequences of analytic thinking. Current Directions in Psychological Science, 24(6),425–432. https://doi.org/10.1177/0963721415604610
- Pennycook, G.; and Rand, D.G. Lazy, not biased: Susceptibility to partisan fake news is better explained by lack of reasoning than by motivated reasoning. Cognition, 188 (2018), 39–50.
- Petty, R.E., and Cacioppo, J.T. The elaboration likelihood model of persuasion. Communication and Persuasion. Springer, New York, NY.: Springer Series in Social Psychology, 1986, pp. 1–24. https://doi.org/10.1007/978-1-4612-4964-1_1
- Peytchev, A.; and Hill, C.A. Experiments in mobile web survey design: Similarities to other modes and unique considerations. Social Science Computer Review, 28, 3 (2009), 319–335.
- Piccoli, G.; and Ott, M. Impact of mobility and timing on user-generated content. MIS Quarterly, 13, 3 (2014).
- Primi, C.; Morsanyi, K.; Chiesi, F.; Donati, M.A.; and Hamilton, J. The development and testing of a new version of the cognitive reflection test applying Item Response Theory (IRT). Journal of Behavioral Decision Making, 29, 5 (2016), 453–469.
- Ransbotham, S.; Lurie, N.H.; and Liu, H. Creation and consumption of mobile word of mouth: how are mobile reviews different? Marketing Science, 38, 5 (2019), 773–792.
- Raphaeli, O.; Goldstein, A.; and Fink, L. Analyzing online consumer behavior in mobile and PC devices: A novel web usage mining approach. Electronic Commerce Research and Applications, 26 (2017), 1–12.
- Revilla, M.; and Couper, M.P. Testing different rank order question layouts for PC and smartphone respondents. International Journal of Social Research Methodology, 21, 6 (2018), 695–712.
- Revilla, M.; and Ochoa, C. Open narrative questions in PC and smartphones: Is the device playing a role? Quality & Quantity, 50, 6 (2016), 2495–2513.
- Rodríguez-Torrico, P.; San José Cabezudo, R.; and San-Martín, S. Tell me what they are like and i will tell you where they buy. An analysis of omnichannel consumer behavior. Computers in Human Behavior, 68 (2017), 465–471.
- Ross, M.Q.; and Campbell, S.W. Thinking and feeling through mobile media and communication: A review of cognitive and affective implications. Review of Communication Research, 9 (2021), 147–166.
- Salthouse, T.A.; and Babcock, R.L. Decomposing adult age differences in working memory. Developmental Psychology, 27, 5 (1991), 763.
- Samson, A.; and Voyer, B.G. Two minds, three ways: Dual system and dual process models in consumer psychology. AMS Review, 2, 2 (2012), 48–71.
- Sanchez, C.A.; and Branaghan, R.J. Turning to learn: Screen orientation and reasoning with small devices. Computers in Human Behavior, 27, 2 (2011), 793–797.
- Saunders, C.; Wiener, M.; Klett, S., and Sprenger, S. The impact of mental representations on ICT-related overload in the use of mobile phones. Journal of Management Information Systems, 34, 3 (2017), 803–825.
- Schlosser, S.; and Mays, A. Mobile and dirty: Does using mobile devices affect the data quality and the response process of online surveys? Social Science Computer Review, 36, 2 (2017), 212–230.
- Shen, L.; Wang, L.; and Zhang, X. Why and when consumers indulge in smartphones: The mental association between smartphones and fun. Cyberpsychology, Behavior, and Social Networking, 22, 6 (2019), 381–387.
- Simon, H.A. A behavioral model of rational choice. The Quarterly Journal of Economics, 69, 1 (1955), 99–118.
- Simon, H.A. Rationality as process and as product of thought. The American Economic Review, 68, 2 (1978), 1–16.
- Sirota, M.; Dewberry, C.; Juanchich, M.; Valuš, L.; and Marshall, A.C. Measuring cognitive reflection without maths: Development and validation of the Verbal Cognitive Reflection Test. Journal of Behavioral Decision Making, 34, 3 (2020), 322–343.
- Sirota, M.; and Juanchich, M. Effect of response format on cognitive reflection: Validating a two- and four-option multiple choice question version of the Cognitive Reflection Test. Behavior Research Methods, 50, 6 (2018), 2511–2522.
- Sohn, S.; and Groß, M. Understanding the inhibitors to consumer mobile purchasing intentions. Journal of Retailing and Consumer Services, 55 (2020), 102129.
- Speekenbrink, M.; and Shanks, D.R. Decision making. In D. Reisberg (ed.), The Oxford Handbook of Cognitive Psychology. Oxford, UK: Oxford University Press, 2013.
- Stankevich, A. Explaining the consumer decision-making process: Critical literature review. Journal of International Business Research and Marketing, 2, 6 (2017), 7–14.
- Stanovich, K.E. Miserliness in human cognition: the interaction of detection, override and mindware. Thinking & Reasoning, 24, 4 (2018), 423–444.
- Stanovich, K.E.; and West, R.F. Individual differences in rational thought. Journal of Experimental Psychology: General, 127, 2 (1998), 161.
- Statistica. Time spent on mobile devices every day in the United States from 2014 to 2021(in minutes). Series Time Spent on Mobile Devices Every Day in the United States from 2014 to 2021(in Minutes), 2020, https://www.statista.com/statistics/1045353/mobile-device-daily-usage-time-in-the-us/.
- Stupple, E.J.N.; Pitchford, M.; Ball, L.J.; Hunt, T.E.; and Steel, R. Slower is not always better: response-time evidence clarifies the limited role of miserly information processing in the Cognitive Reflection Test. PLOS ONE, 12, 11 (2017).
- Svedholm‐Häkkinen, A.M.; and Lindeman, M. Intuitive and deliberative empathizers and systemizers. Journal of Personality, 85, 5 (2017), 593–602.
- Sweeney, S.; and Crestani, F. Effective search results summary size and device screen size: Is there a relationship? Information Processing & Management, 42, 4 (2006), 1056–1074.
- Szaszi, B.; Szollosi, A.; Palfi, B.; and Aczel, B. The Cognitive Reflection Test revisited: Exploring the ways individuals solve the test. Thinking & Reasoning, 23, 3 (2017), 207–234.
- Tang, Z.; Zhang, H.; Yan, A., and Qu, C. Time is money: The decision making of smartphone high users in gain and loss intertemporal choice. Frontiers in Psychology, 8, (2017), 363. https://www.frontiersin.org/articles/10.3389/fpsyg.2017.00363/full
- Thomson, K.S.; and Oppenheimer, D.M. Investigating an alternate form of the Cognitive Reflection Test. Judgment and Decision Making, 11, 1 (2016), 99–113.
- Thornton, B.; Faires, A.; Robbins, M.; and Rollins, E. The mere presence of a cell phone may be distracting. Social Psychology, 45, 6 (2014), 479–488.
- Toninelli, D.; and Revilla, M.A. Smartphones vs PCs: Does the device affect the web survey experience and the measurement error for sensitive topics? A Replication of the Mavletova & Couper’s 2013 Experiment. Survey Research Methods, 10, 2 (2016), 153–169.
- Toplak, M.E.; West, R.F.; and Stanovich, K.E. The Cognitive Reflection Test as a predictor of performance on heuristics-and-biases tasks. Memory & Cognition, 39, 7 (2011), 1275.
- Toplak, M.E.; West, R.F.; and Stanovich, K.E. Assessing miserly information processing: An expansion of the Cognitive Reflection Test. Thinking & Reasoning, 20, 2 (2014), 147–168.
- Tourangeau, R.; Sun, H.; Yan, T.; Maitland, A.; Rivero, G.; and Williams, D. Web surveys by smartphones and tablets: Effects on data quality. Social Science Computer Review, 36, 5 (2017), 542–556.
- Travers, E.; Rolison, J.J.; and Feeney, A. The time course of conflict on the Cognitive Reflection Test. Cognition, 150 (2016), 109–118.
- Traylor, Z.; Hagen, E.; Williams, A.; and Arthur Jr., W. The testing environment as an explanation for unproctored internet-based testing device-type effects. International Journal of Selection and Assessment, 29, 1 (2021), 65–80.
- Turel, O.; and Qahri-Saremi, H. Problematic use of social networking sites: Antecedents and consequence from a dual-system theory perspective. Journal of Management Information Systems, 33, 4 (2017), 1087–1116.
- Tzur, N.I.; and Fink, L. Mobile state of mind: The effect of cognitive load on mobile users’ cognitive performance. In International Conference on Information Systems, Munich, Germany, 2019. https://aisel.aisnet.org/icis2019/mobile_iot/mobile_iot/7/
- van Gog, T.; and Paas, F. Cognitive load measurement. In N.M. Seel (ed.), Encyclopedia of the Sciences of Learning. Boston: Springer, 2012, pp. 599–601.
- Vujic, A. Switching on or switching off? Everyday computer use as a predictor of sustained attention and cognitive reflection. Computers in Human Behavior, 72 (2017), 152–162.
- Wang, X.; Keh, H.T.; Zhao, H.; and Ai, Y. Touch vs. click: How computer interfaces polarize consumers’ evaluations. Marketing Letters, 31 (2020), 265–277.
- Ward, A.F.; Duke, K.; Gneezy, A.; and Bos, M.W. Brain drain: The mere presence of one’s own smartphone reduces available cognitive capacity. Journal of the Association for Consumer Research, 2, 2 (2017), 140–154.
- Wason, P.C.; and Evans, J.S.B. Dual processes in reasoning? Cognition, 3, 2 (1974), 141–154.
- Weigold, A.; Weigold, I.K.; Dykema, S.A.; Drakeford, N.M.; and Martin-Wagar, C.A. Computerized device equivalence: A comparison of surveys completed using a smartphone, tablet, desktop computer, and paper-and-pencil. International Journal of Human–Computer Interaction, 37, 8 (2020), 803–814.
- Wells, T.; Bailey, J.T.; and Link, M.W. Comparison of smartphone and online computer survey administration. Social Science Computer Review, 32, 2 (2014), 238–255.
- Wickens, C.D., and Carswell, C.M. Information Processing. In Salvendy, G., (ed.), Handbook of Human Factors and Ergonomics, Hoboken, New Jersey: John Wiley & Sons, Inc., 2012, pp. 117–161.
- Wickens, C.D.; Hollands, J.G.; Banbury, S.; and Parasuraman, R. Engineering Psychology and Human Performance. Boston: Pearson, 2013.
- Williams, C.C.; Kappen, M.; Hassall, C.D.; Wright, B.; and Krigolson, O.E. Thinking Theta and Alpha: Mechanisms of intuitive and analytical reasoning. NeuroImage, 189 (2019), 574–580.
- Wilmer, H.H.; Sherman, L.E.; and Chein, J.M. Smartphones and cognition: A review of research exploring the links between mobile technology habits and cognitive functioning. Frontiers in Psychology, 8, 605 (2017).
- Winter, B. A very basic tutorial for performing linear mixed effects analyses. arXiv preprint:1308.5499 (2013).
- Zheng, Z.A.; Li, T., and Pavlou, P. Does position matter more on mobile? Ranking effects across devices. International Conference on Information Systems, Dublin, 2016.
- Zhou, Y.; Tian, B.; Mo, T.; and Fei, Z. Consumers complain more fiercely through small-screen devices: The role of spatial crowding perception. Journal of Service Research, 23, 3 (2020), 353–367.
- Zhu, D.H.; Deng, Z.Z.; and Chang, Y.P. Understanding the influence of submission devices on online consumer reviews: A comparison between smartphones and PCs. Journal of Retailing and Consumer Services, 54 (2020), 102028.
- Zhu, Y.; and Meyer, J. Getting in touch with your thinking style: How touchscreens influence purchase. Journal of Retailing and Consumer Services, 38 (2017), 51–58.