
Abstract
Eye tracking research technologies are often used to study how individuals attend visually to different types of AAC displays (e.g. visual scene displays, grid displays). The assumption is that efficiency of visual search may relate to efficiency of motor selection necessary for communication via aided AAC; however, this assumption has not received direct empirical study. We examined the relation between speed of visual search and speed of motor selection of symbols. Ten individuals on the autism spectrum (AS; Study 1) and nine with Down syndrome (DS; Study 2) participated in a search task using simulated AAC displays with a main visual scene display (VSD) and a navigation bar of thumbnail VSDs. Participants were given an auditory prompt to find one of four thumbnail VSDs in the navigation bar. Eye tracking technologies measured how long it took participants to fixate visually on the thumbnail VSD, and recorded how long it took participants to select the thumbnail VSD with a finger. A statistically significant relationship emerged between visual fixation and selection latencies, confirming the positive relationship between visual processing and motor selection for both groups of participants. Eye tracking data may serve as a useful proxy measure for evaluating how display design influences selection of AAC symbols, especially when individuals are unwilling or unable to comply with traditional behaviorally-based assessment tasks.
Augmentative and alternative communication (AAC) consists of a broad set of interventions that effectively support communication for individuals whose speech is not meeting all of their communication needs (Beukelman & Light, Citation2020). AAC can include both gestures and other signals (unaided AAC) as well as low- or high-technology devices (aided AAC), including communication books as well as tablets or devices with speech-output capacities. AAC can be beneficial for supporting communication by individuals with Down syndrome (DS; Wilkinson & Finestack, Citation2021) or individuals on the autism spectrumFootnote1 (AS; Ganz & Simpson, Citation2019), who may have substantive difficulties with expression via speech, understanding of speech, or both. For these individuals, AAC can support for effective communication.
A survey of clinicians (Johnson et al., Citation2006) suggested that the “fit” of the AAC system to the user’s needs, skills, and preferences is an important determinant in successful adoption and use of AAC, in addition to other factors such as partner training and environmental supports. Determining the fit of the AAC system requires consideration of a wide array of factors related to the physical design. Wilkinson and Jagaroo (Citation2004) as well as Light et al. (Citation2019) argued that this logic extends to the fit of the visual-perceptual characteristics of AAC displays to the visual processing skills of their users. Aided AAC most often presents symbols visually, laid out on an external display. This is quite different from the aural/oral nature of spoken communication, both in terms of the channel (vision vs. audition) and in terms of where the vocabulary is stored for access (internal or external to the individual). Consequently, individuals who rely on aided AAC must be able to process the visual information that serves as the communication channel. Effective and efficient use of aided AAC for communication depends, in part, on the accuracy and speed with which users can visually locate and select items from the display.
Examination of the fit of AAC display characteristics with the visual-processing skills of individuals who use them has increasingly incorporated eye tracking research technologies that measure specifically how individuals visually engage with and search within different types of AAC displays (Wilkinson & Mitchell, Citation2014). This research often utilizes simulated displays, ones that resemble AAC displays used in clinical practice, but whose contents are deliberately chosen for the purposes of the research and whose effects may be tested outside of a communication context to determine how visual-perceptual characteristics influence search behaviors. Eye tracking research technologies use infrared light to detect the location and orientation of the eye at very high sampling rates (in our case, every 16 ms), resulting in a detailed record of gaze fixations during engagement with visual stimuli (Wilkinson & Mitchell, Citation2014, or Venker & Kover, Citation2015; details of the technologies used in the current study are provided in the Methods sections, below). Efficiency of visual search is indexed by a variety of methods, including how rapidly an individual can locate a target symbol (speed or latency of fixation) and/or how many non-target symbols are fixated during the search process (e.g. Wilkinson & Mitchell, Citation2014; Wilkinson & Finestack, Citation2021).
To date, several studies have examined visual search and/or attention by individuals with developmental or acquired disabilities to simulated AAC displays with various organizational layouts (e.g. Light et al., Citation2019 for a summary). Results of these studies are beginning to inform design of actual AAC displays by allowing evaluation of what kinds of display features attract attention or distract attention. For instance, the research has suggested that human figures in visual scene displays attract attention irrespective of their placement in the image or what kinds of other distracters are present, in individuals with Down syndrome or intellectual disabilities of other origins, individuals on the autism spectrum, or those with neurotypical development (O’Neill et al., Citation2019; Wilkinson & Light, Citation2011, Citation2014). In grid-based displays, arrangement of symbols by internal color and/or into spatially discrete groups facilitates visual search in individuals with Down syndrome, individuals on the autism spectrum, or those with neurotypical development (Wilkinson & Madel, Citation2019; Wilkinson et al., Citation2014; Wilkinson et al., Citation2022). Preliminary evidence suggests that these small changes in the design of AAC displays influence not just visual search and attention, but also important communication outcomes such as communication rate during authentic social interactions for individuals with Down syndrome (Wilkinson & Bennett, Citation2021).
Although the emerging evidence regarding the influence of AAC display design on visual attention is compelling, ultimately efficiency of communication via aided AAC is determined not just by the latency of visual fixation to the target item on the display, but also the efficiency of the motor selection of this item. Efficiency of motor selection reflects how quickly an individual can produce the selection behavior, and can be measured as the latency between the presentation of a stimulus and the selection behavior. There are indirect hints in the literature to support the premise that latency of visual fixation is associated with latency of direct motor selection. For instance, Wilkinson et al. (Citation2014) and Wilkinson and Madel (Citation2019) noted that for children with typical development, individuals with Down syndrome, or individuals on the autism spectrum, clustering symbols by internal color on a grid increased the overall average speed of visual fixation as well as the overall average speed of response selection with a mouse relative to displays where symbols of shared color were distributed across the display. Wilkinson and Bennett (Citation2021) reported that for three individuals with Down syndrome, spatial arrangement of symbols affected both the gaze behavior and the rate of communication during authentic social interactions. However, neither study conducted analyses to specifically investigate the correlation between latencies of visual fixation and motor selection response (rather, each set of latencies was reported separately). Furthermore, neither study considered the latency to direct selection of a target symbol with a finger as is the typical selection technique in interactions using AAC for individuals on the autism spectrum or those with Down syndrome; rather these studies required participants to use a mouse to make selections.
If a strong relationship is established between latency of visual fixation and latency of motor selection, there may be some interesting implications for clinical practice. Using latency of visual fixation as a proxy to assess the goodness of fit of AAC displays may be faster and less demanding than requiring repeated motor selections, but this assessment approach is only viable if latency of fixation is strongly associated with motor selection latency. Therefore, the research question addressed in the current study was: What is the relationship between the latency to fixate visually on a target and the latency to select that target using a finger, across multiple trials, by individuals with Down syndrome or individuals on the autism spectrum, on simulated AAC displays with a main VSD and a navigation bar? The population of people who benefit from AAC is a diverse one including individuals with a wide range of developmental or acquired conditions who use a wide variety of selection techniques to access aided AAC. Given the varied intrinsic characteristics of these different disability groups and the wide range of access techniques, ultimately this research question should be explored across conditions (e.g. autism, Down syndrome, cerebral palsy, ALS, traumatic brain injury) and selection techniques (e.g. direct selection with a finger, eye gaze, scanning). As a first step in this process, we investigated the relationship between visual latency and selection latency with individuals with Down syndrome or individuals on the autism spectrum who used direct selection with a finger. We chose these two groups as they include significant numbers of people who may benefit from AAC and prior research has explored the effects of the design of AAC displays on their visual attention and motor performance (Light et al., Citation2019 for further information). Future research should address other groups using other selection techniques.
We conducted two separate studies, using different eye tracking technologies, for the participants with Down syndrome and those on the autism spectrum. The gaze behaviors of participants with Down syndrome were measured using wearable eye tracking glasses technology as the participants interacted with a tablet, whereas a small, portable eye tracker that rested up against a laptop display was used with the participants on the autism spectrum. This decision reflected several practical constraints. Most particularly, we anticipated that the participants on the autism spectrum might resist wearing an unfamiliar (and somewhat clunky) set of glasses, and the research was conducted on a single day in their school setting (thus not allowing a period of acclimation). A remote eye tracker that simply rested on the computer display was therefore preferred for this population. However, our previous experiences of using a variety of eye tracking technologies with individuals with Down syndrome (Wilkinson & Bennett, Citation2021) led us to the conclusion that the calibration process with the glasses was superior to the small remote technology; this may have been due to the likelihood of ocular conditions in individuals with Down syndrome such as strabismus, that were less problematic for calibration with the glasses than the small remote system. We chose to report both samples in a single paper because the research questions were identical; however, it should be noted that it is not possible to directly compare results across the two studies given the different eye tracking technologies. All procedures for both studies were approved by the Institutional Review Board at the authors’ university.
Study 1: Relationship of latencies of visual fixation and motor selection for individuals on the autism spectrum
Method
Participants
Ten adolescents on the autism spectrum were enrolled. Inclusion criteria were: (a) hearing and vision within normal limits, or corrected to within normal limits per caregiver report, (b) accuracy of at least 90% on a comprehension prescreening of the concepts used in the study, (c) a Peabody Picture Vocabulary Test Fourth Edition (PPVT-4; Dunn & Dunn, Citation2006) score of less than 70 approximately; and (d) a score approximately at or exceeding the cutoff of 30 on the Childhood Autism Rating Scale (CARS; Schopler et al., Citation1986). presents the gender, chronological age, PPVT-4 standard score, and CARS score of each participant on the autism spectrum.
Participants were recruited from a school in northeast USA. Recruitment materials (a flyer, a cover letter, and a consent form) were sent home with students from the school, along with a letter of support from the school administration. Those families who were interested in participating returned the signed consent form, after which scheduling began. All participants had been exposed to AAC at school; the specific types of AAC varied, ranging from PECS to high-technology; none of the participants were currently using AAC systems with VSDs such as the simulated displays in this study.
Materials
The materials included a series of simulated AAC displays, each containing a main VSD and a navigation bar containing four thumbnail VSDs that could be used to navigate to a different VSD. illustrates an example of a full trial (procedure described below); the second and third plates in the figure show the layout of the AAC displays, each including a main VSD and a navigation bar. The main VSD depicted two children participating in one of four shared activities (i.e. kicking a ball, playing with a dog, eating lunch, or reading a book), and the navigation bar included a thumbnail of the main VSD, as well as thumbnail VSDs of the other three activities. The location of the navigation bar was manipulated across the simulated AAC displays to appear in four different locations relative to the main VSD—on the top horizontally, on the bottom horizontally, on the left vertically, or on the right vertically. A different set of photo VSDs for the four activities was used for each navigation bar location, for a total of 16 unique simulated AAC displays used as stimuli in the study.
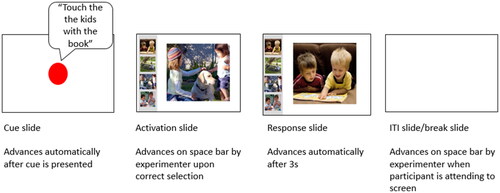
Figure 1. Example of a Full Stimulus Trial.
Eye tracking technology
The Tobii X2-60 eye-tracker,Footnote2 a small unit measuring 7.2 inches, was positioned below the 13 inch screen of a Microsoft Surface ProFootnote3 tablet that displayed the stimuli. The eye-tracker rested on the base of the EyeMobile Mini bracket stand, and the tablet rested in the adjustable bracket above the eye-tracker. The tablet was positioned at an angle between 75 and 85 degrees, as measured via a protractor. The X2-60 connected to an external processing unit. An ethernet cable extending from the external processing unit connected to an ethernet-USB adapter, which connected to the tablet. During sessions, the X2-60 generated reflection patterns on the participants’ corneas using infrared illuminators. Image sensors collected the reflection patterns, and imaging processing algorithms calculated the 3D position of each eyeball, in order to analyze where participants were looking at any given point in time during the session.
Procedures
Sessions occurred in a quiet room in the participants’ school to minimize distractions, control ambient lighting that might interfere with the eye tracker, and ensure that participants were able to adequately hear the auditory output from the system. This study represents a preliminary exploration of the relationship between latency to visual fixation and latency to motor selection under controlled conditions; future research is required to investigate the relationship during authentic communication tasks under natural conditions. Prior to the data collection task, the PPVT-4 and prescreening were administered. A prescreening was completed to ensure that the participants understood the spoken words and the visual representations for the four activities represented within the photographs used as VSDs for the study task stimuli (i.e. kicking a ball, playing with a dog, eating lunch, or reading a book). During the prescreening, the participants were presented with photos from the study representing the children engaged in the four different activities (i.e. either four thumbnail-size VSDs arranged in a grid or in a navigation bar with a main VSD); they were instructed, “Touch the children playing with the dog,” for example. The participants completed a total of 16 prescreening trials, one to probe each of the photo VSDs used in the study. If a participant pointed to an incorrect target thumbnail VSD, the researcher modeled the correct response and repeated the trial for the participant before continuing to the next trial. Participants were required to demonstrate task comprehension on the prescreening activity in order to be included for final data analysis. Once the prescreening was complete, the data collection session started.
During the session, participants sat approximately 60 cm from X2-60 and tablet. The position was automatically detected by the Tobii StudioFootnote4 software that controlled the presentation of the stimuli on the Surface tablet. A two-point calibration of the eye tracking technology was performed, which involved participants watching a short video that appeared consecutively in two corners of the tablet screen. A video was used in order to capture the attention of participants with its associated motion and sound. While other calibration options were available (i.e. 5-point or 9-point), a two-point calibration was determined to be sufficient for this study for two reasons. First, the areas of interest used in this study were large enough that a two-point calibration offered sufficient precision. Second, previous research by the authors indicated that participants on the autism spectrum often looked away from the screen before a five- or nine-point calibration could be completed. After calibration, the stimulus presentation began.
Stimulus presentation and trial structure
A task-based paradigm was used in which participants were instructed to select a specific target thumbnail VSD in each of 32 trials. Each of the 32 trials included a sequence of four slides, as illustrated in . The first slide in the trial was a cue slide. This slide contained a white screen with a red calibration dot in the center, along with an auditory cue to touch one of the thumbnail VSDs within the navigation bar (e.g. “Touch the kids with the book”). After the auditory cue was delivered, an activation slide appeared that presented one of the simulated AAC displays. In the activation slide, the main (large) VSD was not the one that had been cued; for instance, in the cue was to touch the kids with the book, and the main VSD was the children with the dog. This meant that the participant’s task was to locate and touch with a finger the cued thumbnail VSD from the four small VSDs in the navigation bar as if to navigate to a new AAC display. Once the participant had located and touched the cued thumbnail VSD, the response slide appeared. The response slide contained the VSD that had been selected from the navigation bar, now as the large, main VSD; this slide stayed on the screen for 3 seconds before being replaced by a blank intertrial interval slide. The intertrial interval slide stayed on the screen until the researcher advanced it by depressing the space bar; this allowed the researcher to move through the trials as slowly or as quickly as needed based on participant attention.
If a participant made an error on any trial in selecting the thumbnail VSD that corresponded to the auditory cue, or if a participant did not select a target within 5s of the auditory cue being delivered, the researcher provided one repetition of the auditory cue (e.g. “Remember, touch the kids with the book”). If the participant made a second error or did not respond, the researcher modeled the correct selection and manually advanced to the response slide. Less than 1% of the trials included selection errors; these trials were removed from the final data analysis.
In order to ensure that participants understood the task while minimizing the need for instructions, a practice task was completed before the actual data collection task described above. The practice task used the same sequence of slides just described; however, it was completed on “preview mode,” meaning no eye-tracking data were collected during this task. Participants were instructed to: “Look at the pictures on the tablet. Listen to the directions and touch the small picture.” The researcher gestured toward the navigation bar while saying “touch the small picture.” The practice task included between one and four trials, dependent upon each participant’s demonstration of task comprehension. The practice task also confirmed that the participants could produce the required motor response, prior to initiating the study. All participants demonstrated successful completion of the practice task before starting the study task.
Dependent measures
The two dependent measures were the latency to fixate visually on the target thumbnail VSD within the navigation bar and the latency to select the target VSD with a finger touch. The first dependent measure, latency to fixate visually on the target, was defined as the time (in seconds) that it took from the onset of the activation slide until the participant’s first visual fixation to the target thumbnail VSD in the navigation bar as measured by the automated Tobii Studio software program. Tobii Studio has a drawing function that allows researchers to enclose one or more “areas of interest” (herein AOI) on each stimulus display. For this study, only the targeted thumbnail VSD was defined as an AOI as the research question concerned latency to fixate visually on that targeted item. Once an AOI is defined, the software can calculate, based on the initial calibration, the length of time between the onset of the activation slide and the first fixation on the AOI (i.e. latency to visual fixation). Fixations were defined as 100 ms within a 35-pixel area, which is the standard fixation setting in Tobii Studio. The second dependent measure, latency to select the target thumbnail VSD with a finger, was defined as the length of time elapsing between the onset of the activation slide and the end of the activation slide when the participant made a selection by touching the target VSD and the response slide appeared. The full length of time from the onset of the activation slide to the actual selection of the target was used as the measure of latency of motor selection (rather than simply the time between first visual fixation and the motor selection response) because of the likelihood that the participants initiated their motor responses during their visual search (i.e. participants did not necessarily wait until they fixated visually to begin the motor response).
Data analysis
Data for visual fixation latency to the target AOI and data for motor selection latency were summarized for each trial for each participant separately; means and standard deviations were then calculated for each participant. Only trials that included both visual fixation and motor selection latencies were included in the analysis because the research question concerned the yoked relationship of these variables. Lack of data on motor selection latencies reflected those situations in which the participant selected incorrectly or made no response; as noted earlier, less than 1% of the trials included selection errors and had to be removed from the final data analysis. Lack of visual fixation data could occur for a variety of reasons, including blinking, a glance to the target that was too short to register as a fixation, or a temporary shift in calibration accuracy (e.g. rocking forward). Unfortunately, eye tracking research studies often do not report sampling rates; however, one prior study reported visual fixation sampling rates of 66% for youth on the autism spectrum and 67% for those with Down syndrome (Wilkinson & Finestack, Citation2021). Across participants in this study, a mean of 20 (63%) of the 32 trials presented to each participant contained both a visual fixation latency and a motor selection latency, in keeping with prior research.
Pearson Product Moment Correlation was used to evaluate the correlation between participants’ mean fixation latency and their mean response latency. Pearson’s was chosen because the data were continuous and our goal was to evaluate the associative (not predictive) relationship between the visual fixation and the motor behavior. Data were evaluated using P-P plots for bivariate normality and considered to not violate that assumption.
Results
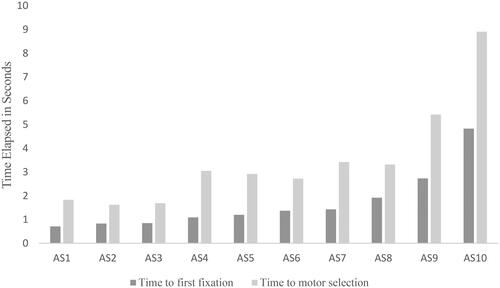
illustrates the mean latency from the trial start to the first visual fixation (the dark bars) and the mean latency from the trial start to motor selection of the target (the light bars) for each of the participants on the autism spectrum (See Appendix A for the means, SDs, and ranges for the latencies to first visual fixation and motor selection response across trials for each of the participants.). As expected, the mean time required to make the motor selection was greater than the mean time required to visually fixate on the target for all participants. The majority (80%) of the participants visually located the target in a mean of less than 2s and selected the target with their finger in a mean of less than 4s; however, there were two participants who were much slower visually fixating and selecting the target thumbnail VSDs from the AAC displays.
Figure 2. Mean Latency to Visual Fixation and Mean Latency to Motor Selection of Targets for Participants on the Autism Spectrum.
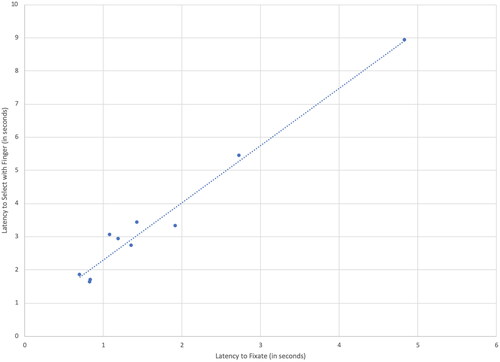
illustrates the very strong relationship between the latency to visually fixate on the target and the latency to select it, whereby participants with faster average fixation latencies also showed faster response times to select. This near-perfect correlation was of statistical significance, as measured by a Pearson Product Moment Correlation, r(8) = .98, p < .000. A descriptive analysis was conducted to determine if participant scores on the PPVT seemed to be related to speed of visual fixation. This analysis was descriptive because of the small sample size and because PPVT scores were not distributed normally. The two participants with PPVT scores of 20 (the floor score on the PPVT) showed substantively longer visual fixation latencies than the other participants (means of 2.7 and 4.8 seconds); these participants were also observed to be more likely to engage in rocking behaviors than the other participants during the study. Among the remaining eight participants there was no apparent relationship between PPVT scores and visual fixation latencies; mean latencies ranged from the shortest of .83 seconds, produced by the participant with the second-highest PPVT score (standard score = 39), and the longest of 1.9 seconds, produced by the participant with the highest PPVT score (standard score = 72).
Figure 3. Correlation Between Fixation Latency and Motor Response Latency for Participants with AS in Study 1.
Study 2: Relationship of latencies of visual fixation and motor selection for individuals with Down syndrome
Method
Participants
Nine individuals with diagnoses of Down syndrome (5 female and 4 male), ranging in age from 13 to 34 years (M = 22), participated in the second study. Participants were recruited by flyers to families in the local community. Participant inclusion criteria were the same as for Study 1 except for the change in the diagnosis (Down syndrome) and the exclusion of the CARS score. Standard scores on the PPVT-4 ranged from 22 to 74 (M = 52) across all participants with Down syndrome (). Many of the participants had had previous exposure to signs and other forms of AAC, but none were current users of AAC on a regular basis although many would have benefited from AAC when interacting with unfamiliar partners.
Materials
The materials used in this study were the same as described for Study 1.
Eye tracking technology
Eye gaze data in this study were obtained using a different technology than in Study 1. Study 2 used light-weight, wearable, mobile research eye tracking technology, specifically the Tobii Pro Glasses 2Footnote5 (Tobii Pro, 2018). This technology measured participants’ gaze fixations in real time as they looked at and engaged with the simulated AAC displays (the visual stimuli). The head unit (i.e. eye tracking glasses) had a total of 4 sensors, 2 per eye, and used corneal reflection with dark pupil tracking to track participants’ eye movements. A scene camera and microphone were integrated into the center of the head unit and produced a video recording of the task from the participants’ perspective. Recent evidence comparing the effect of movement on data quality from four different types of head-worn eye trackers (Niehorster et al., Citation2020) indicated that the Tobii Pro Glasses 2 remain stable even with head movements, resulting in high data quality.
The head unit connected to a recording unit via an HDMI cable, which was controlled by Tobii Glasses Controller SoftwareFootnote6 on a Microsoft Surface Pro tablet, which enabled researchers to view a participant’s eye movements and fixations in real time during the task. The head unit glasses featured an exchangeable nose pad in different sizes, which was changed out to ensure best fit for the participants during the task. The lenses in the glasses were removeable with the option to insert prescription lenses as appropriate. A specialized prescription lens package allowed the researcher to set the lenses in the Tobii Glasses 2 to the prescription strength for those participants who wore glasses; for those participants with vision within normal limits, a lens that had no correction was placed in the frames. All participants put the Tobii Glasses 2 on and underwent calibration procedures prior to data collection. Although a procedure was in place to accustom participants to the glasses, in practice, all participants readily put on the glasses without complaint and were able to use them without difficulty.
Procedures
Participants completed the task in a quiet dedicated research room with controlled lighting conditions and reduced distractions. The prescreening procedure was the same as described in Study 1. The calibration procedure for the mobile Tobii Glasses 2 differs from standing eye tracking technologies (such as were used in Study 1; for details, see Tobii n.d.-a and Tobii Pro, Citation2014). In summary, calibration for the glasses consists of placing the participant approximately 3 feet away from the calibration target, which for the glasses is a black and white circular target that resembles a bullseye, 43 mm in diameter. The tablet that controls the data collection then displays the field of view (what the participant is seeing) along with the gaze information (where the participant is looking in the field of view). Participants are instructed to look at the center of the bullseye until told to stop. Then the calibration function is launched and the software automatically indicates when calibration is successful. Following calibration, in this study, participants completed a practice trial of the task to ensure task comprehension following the same procedures as described in Study 1.
Stimulus presentation and trial structure
The stimulus presentation and trial structure were the same as for Study 1.
Dependent measures
The two dependent measures were latency to visual fixation and latency to motor selection. The means by which the measures were calculated differed from Study 1, due to the difference in the eye tracking research technologies used. Latency to fixation was defined as the time from the presentation of the activation slide after the spoken cue to the first visual fixation on the target thumbnail VSD. The software used to calculate latency to fixate visually was Tobii Pro LabFootnote7, a software program that allows for integration of the input stream from the scene camera (what the participant is looking at) with the gaze path captured by the glasses (where the participant is looking within the scene). The researcher defined AOIs on a “snapshot” of the field of view obtained from the scene camera. Tobii Pro LabFootnote8 then automatically mapped the input of the gaze path onto the AOIs in the snapshot. The assisted mapping was then reviewed by the second and third authors and any adjustments made by hand, if needed (for details on the procedure, see Tobii n.d.-b; adjustments might be required if the assisted mapping could not determine where the point of gaze was, but the researchers could).
Latency to produce the motor selection act was calculated as the length of time (in seconds) from the onset of the stimulus to the point of selection using a finger. Because the data stream from the glasses is one continual recording, the onset and response times were entered by the investigator, using the field of view. Specifically, the researcher viewed each participant’s recording from the head unit and first identified the onset of the stimulus (when it appeared); this was flagged on each trial by a momentarily blank trial that occurred between the red fixation dot and the VSD stimulus appearing on the screen. The offset of the trial was indicated by the touch of the finger to the target. The time between trial onset and trial offset was the motor selection latency.
Data analysis
Data analysis proceeded the same way as described for Study 1. Across participants, a mean of 24 (75%) of the 32 trials presented to each participant contained both a visual fixation latency and a motor selection latency; these trials provided the corpus of trials for data analysis. As noted previously, this sampling compares favorably to prior research. Pearson Product Moment Correlation was used to analyze the strength of the relationship between visual fixation latency and motor selection latency.
Results
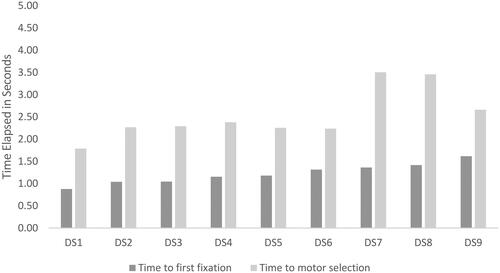
In , the light-colored bars represent the mean latency of motor selection for each of the individuals with Down syndrome while the darker bar represents the mean visual fixation latency (See Appendix A for the means, SDs, and ranges for the latencies to first visual fixation and motor selection response for each of the participants.). As expected, the mean latency to locate the target visually was shorter than the mean time required for the participants to select the target with a finger. All (100%) of the participants with Down syndrome visually located the target in a mean of less than 1.65 s and they selected the target with their finger in a mean of approximately 3.5s or less.
Figure 4. Mean latency to visual fixation and mean latency to motor selection of targets for participants with Down syndrome.
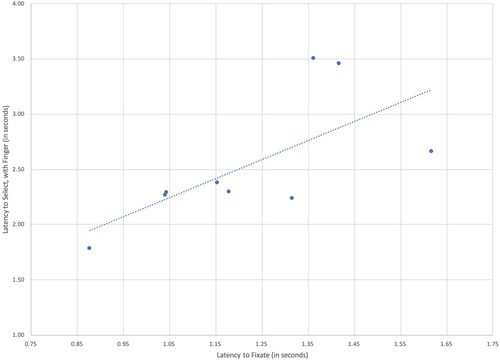
illustrates the moderate to strong relationship between the latency to visual fixation and the latency to motor selection for the nine participants with Down syndrome. This correlation was of statistical significance, as measured by a Pearson Product Moment Correlation, r(7) = .68, p = .023 With the exception of Participant 9, participants with Down syndrome who had longer latencies to fixate visually on the target were also generally slower to make a motor selection than those with shorter latencies to first fixate. As in Study 1, a descriptive analysis was conducted to explore whether participant scores on the PPVT seemed to be related to speed of visual fixation. There appeared to be little relation; mean latencies ranged from the shortest of .88 seconds, produced by the participant with a PPVT score of 50 (in the middle of the group), and the longest of 1.62 seconds, produced by the participant with the highest PPVT score (standard score = 73).
Figure 5. Correlation between Fixation Latency and Motor Response Latency for Participants with Down Syndrome (Study 2).
Discussion
Results of these studies provide important information about the latencies of visual fixation and motor selection of targets in AAC displays and the relationship between these latencies for individuals on the autism spectrum and those with Down syndrome. Given the different eye tracking research technologies used in the studies, it is not appropriate to compare results directly across the studies; however, the following sections consider the overall patterns of results for the two studies.
Latencies to visual fixation and motor selection
Overall, the pattern of results was consistent across the two studies. The majority (80%) of participants on the autism spectrum and all (100%) of the participants with Down syndrome located the target VSD in the navigation bar and fixated on it visually within 2s, on average; they then selected the target with a finger within 3.5s, on average. As expected, the latency to motor selection was longer than that to visual fixation; participants had to search for and locate the target visually before they could select it with their finger. Although these data indicate that visual fixation on the target precedes completion of the selection, these are not entirely sequential processes with fixation completed before motor selection acts are initiated; rather motor selection behaviors may be initiated prior to completing the first visual fixation to the target.
Although, the majority of participants in both studies visually fixated in less than 2s and selected the target in 3.5s or less, there was variation across the participants in both studies and the visual fixation and motor selection latencies of two participants on the autism spectrum (Study 1) exceeded the group means significantly: these individuals required means of 2.73s and 4.83s to fixate on the target VSDs visually and means of 5.42s and 8.90s to select these targets with a finger. The variability observed across the participants on the autism spectrum is not surprising as, by definition, autism is a spectrum diagnosis that is characterized by both behavioral and neurodevelopmental variation that may be attributable to genetic, environmental, and developmental factors and/or their interactions (Wozniak et al., Citation2017). The design of the current study did not support the determination of specific intrinsic or extrinsic factors that might explain the differences in the magnitude of the latencies for these participants. Preliminary descriptive analyses in this study suggested that PPVT scores were not strongly related to latencies. Informal observations by the researchers suggested that the two participants on the autism spectrum with significantly slower latencies both engaged in rocking behaviors that may have interfered with the efficiency of their visual fixation and motor selection. Regardless of the underlying explanation, these participants clearly required substantially more time to locate and select target symbols from the aided AAC displays than their peers. Future research is required to determine factors that may contribute to faster or slower latencies to visual fixation and motor selection and to explore ways to minimize latencies where possible. This work is critical since communication partners may misinterpret extended pauses in interactions (resulting from long latencies) as communication breakdowns (e.g. Light et al., Citation1985).
The latencies observed in this study offer additional, more nuanced evidence to support the well-established finding that communication via aided AAC is significantly slower than spoken communication (e.g. Higginbotham et al., Citation2007). Latencies of visual fixation and motor selection contribute to the length of turn transfer times which, in turn, are one important component of overall communication rate. When considered within the context of a communicative interaction, the latencies observed in this study fall well outside the range of turn transfer times in spoken interactions (e.g. turn transfer times in spoken interactions between children and adults are typically less than 1s; Garvey & Berninger, Citation1981). It should be noted that participants had not had experience with the simulated AAC displays prior to the study; visual search and selection might be expected to become somewhat more efficient over time with extended practice and learning. However, it is also important to note that the latencies observed in this study simply address the time required to locate and visually fixate on a target (cued by the researcher) and then select it. Actual turn transfer times in an interaction might be expected to be longer as the AAC user would need to process the partner’s communication, formulate a response, and then determine how to communicate the intended message via aided AAC (Thistle & Wilkinson, Citation2015) in addition to visually locating and selecting the target symbols.
Overall, the latencies of the participants in this study underscore the importance of teaching communication partners to wait silently to provide individuals who use aided AAC with sufficient time to communicate. If communication partners assume typical turn transfer rates, they will expect AAC users to take their turns sooner than they are able and the partners will no doubt preempt AAC users from communication opportunities. Fortunately, research shows that communication partners can be taught to implement specific interaction strategies (e.g. waiting) and use of these strategies results in increases in the frequency of communication turns by individuals who use AAC (Kent-Walsh et al., Citation2015, for a systematic review of the effects of partner training). The results of this study also suggest that there may be variability in latencies across participants and therefore the length of time that communication partners need to wait should be determined individually.
The latency results also underscore the importance of designing AAC displays in ways that minimize visual cognitive processing demands and maximize the efficiency of visual search and motor selection. Prior research has demonstrated that even relatively minor changes in the design of AAC displays can affect performance (Wilkinson et al., Citation2022; for a thorough review see Light et al., Citation2019). When AAC displays are well-designed, they will support more efficient visual search and selection. In contrast, poorly designed AAC displays may impose increased visual, cognitive, and motor demands; these demands may result in longer latencies to visual fixation and motor selection, negatively impacting turn transfer times and overall communication. The findings of this study highlight the need for clinicians and AAC manufacturers to apply research-based guidelines to the design of AAC displays to reduce latencies and support effective and efficient communication (Light et al., Citation2019).
Relationship between latencies for visual fixation and motor selection
A very strong correlation was found between the latency to fixate visually on a target and the latency to select that target for the individuals on the autism spectrum (Study 1) and a moderate to strong relationship was found for the individuals with Down syndrome (Study 2). These correlations indicate that, in general, participants who fixated visually more quickly on the target also tended to respond more quickly with their selection of the target with the exception of participant DS9 who was the slowest to fixate visually on the target within the participants with Down syndrome but was not the slowest to select the target.
The relationship between latency to visual fixation and motor selection was found to be similar across the two studies despite the use of different eye tracking research technologies and the different diagnoses of the participants. Furthermore, the relationship was very strong for participants on the autism spectrum (Study 1) and moderate to strong for participants with Down syndrome (Study 2), suggesting that the processes of visual search and motor selection are likely impacted by similar factors. Results are not surprising as prior research has demonstrated that the visual cognitive processing load imposed by the design of aided AAC displays can impact efficiency of visual search (e.g. Wilkinson & Madel, Citation2019; Wilkinson et al., Citation2014) and can also impact motor selection performance (e.g. Liang et al., Citation2018). In general, longer latencies to locate the target visually suggest less direct visual search paths that may require more adjustments within the motor selection process to reach the target, thereby increasing selection latencies.
Although the relationship between latency to visual fixation and latency to motor selection was very strong for individuals on the autism spectrum (Study 1) and moderate to strong for individuals with Down syndrome (Study 2), the correlation was not perfect suggesting that factors related to the intrinsic characteristics of the participants and/or the design of AAC displays may differentially impact these two measures. Given the methods of the current study, it is not possible to isolate specific intrinsic or extrinsic variables that might differentially impact visual fixation and motor selection. However, prior research has suggested that the trajectory of the path required to select a target within a display may differentially impact the accuracy and latency of motor selection; it is possible that the trajectory impacts motor selection to a greater extent or in a differential manner than visual fixation. For example, Costigan et al. (Citation2012) found that preschoolers without disabilities were fastest and most accurate selecting targets that were located on a vertical path, followed by those on a horizontal path; they were slowest and least accurate selecting targets on a diagonal path. These researchers posited that the children’s motor selection was impacted by the trajectory’s deviance from midline and the number of planes that had to be coordinated to make the selection. For example, motor selection on a vertical path did not deviate from midline and only required coordination of a single plane (i.e. vertical); motor selection on a horizontal path also only required the coordination of a single plane (i.e. horizontal), but it required deviation from midline, whereas selection on a diagonal path required coordination of two planes (vertical plus horizontal) and deviation from midline. Unfortunately, these researchers did not collect data on visual fixations so it is not possible to determine if physical location of targets on the display differentially affected visual fixation and motor selection responses. Future research is required to explore this hypothesis as well as other factors that may differentially affect visual fixation and motor selection.
Implications for practice
Overall, however, the results of this study demonstrate that the processes of visual fixation and motor selection are closely related in individuals on the autism spectrum (strong correlation) and those with Down syndrome (moderate to strong correlation). The strength of the relationship suggests some intriguing possibilities for AAC assessments. Research demonstrates that the design of AAC displays (e.g. layout, organization, color, spacing) impacts visual search, motor selection, and overall communication performance (Light et al., Citation2019). Therefore AAC assessments should consider carefully the fit of the design of the AAC display with the needs, skills, and preferences of the AAC user to maximize the efficiency of visual search and motor selection. Typically, clinicians assess the goodness of fit through repeated trials requiring motor selection of items from the display. Given the wide array of AAC display options and variables to consider, clinicians may find it daunting to add additional components to AAC assessments which are already often long and can be fatiguing for individuals with complex communication needs (Beukelman & Light, Citation2020). Results of this study provide initial evidence that data obtained about gaze behavior using eye tracking research technologies may offer important insights into AAC display variables that affect not just visual search, but also the motor selection used to access aided AAC systems for communication. Information about visual search efficiency obtained via eye tracking measures may serve as a proxy measure to inform AAC display designs that will not only maximize visual search, but also optimize the motor selection behaviors required during actual communication use.
Assessment of visual attention is more efficient and less fatiguing than assessment of motor selection; therefore, it may provide a faster, less demanding approach to determine the goodness of fit of AAC displays for individuals with complex communication needs. AAC assessments are already lengthy and tiring (Beukelman & Light, Citation2020); approaches that decrease the time and effort required are obviously desirable for both AAC users and clinicians. Prior research has explored the possibility of using eye tracking research technologies to assess comprehension of spoken language by children on the autism spectrum (e.g. Brady et al., Citation2014). The possibility of using eye tracking for assessment to optimize display design is especially intriguing for those individuals who may be unable or unwilling to participate in repeated trials of AAC technologies that necessitate compliance to tasks requiring a motor response (Wilkinson & Mitchell, Citation2014) or for those individuals who may find the process of repeated motor selections unduly fatiguing (e.g. individuals with ALS). Using eye tracking research technologies to investigate accuracy and efficiency with different display designs may be faster and less demanding for many individuals than traditional assessment tasks that require motor responses; results of the current study suggest that, on average, these motor responses take almost twice as long as visual fixations. In addition, motor selection tasks are often impacted by competing behaviors (e.g. reflexes, hand flapping, etc.) that may skew measurement of latency for specific trial(s); these outliers may be particularly problematic when only a small number of trials are sampled as in most AAC assessments. Visual fixation may provide a more stable measure to determine overall fit, less subject to outliers resulting from these competing motor behaviors. Using measurement of visual fixation as a proxy for actual motor selection may be especially helpful in attempting to predict the performance of individuals who are novices to AAC. Sowers and Wilkinson (Citation2023) argued that novices are especially vulnerable to perturbations in their performance as they are developing new access skills; these perturbations can skew assessment results significantly (especially when trials are limited) and may complicate decision making. Measures of visual fixation may provide cleaner data and support clearer insight into the demands of display and the fit for the individual with complex communication needs. Future research is required to explore the strengths and limitations of this assessment approach.
Limitations and future directions
Although this study has potentially important implications for advancing understanding of communication using aided AAC displays, results are preliminary and there are a number of limitations that should be considered. First, the studies involved only a small number of participants who varied in age, language skills, and other intrinsic characteristics and who all used direct selection with a finger; results may not generalize to other participants with autism or Down syndrome, to other disability groups, or to those using other access techniques. Clearly future research is required to replicate these preliminary results with a greater number of participants across different ages and diagnostic groups, including those with motor impairments (e.g. cerebral palsy, ALS) and those using different access techniques (e.g. scanning, eye gaze). Furthermore, we did not conduct detailed evaluations of participants’ motor and visual skills in this study; future research should provide more finetuned assessment of these skills that may impact visual fixation and selection latencies.
Furthermore, the study was conducted using simulated AAC displays within structured trials in which participants were instructed to locate specific targets. We conducted the research in a quiet room outside of the natural environment to control lighting conditions as recommended by the manufacturer. This situation does not replicate the demands of daily communicative interaction. Future research is required to explore the nature of the relationship between visual fixation latency and motor response latency during actual communicative exchanges in order to evaluate the implications of our findings for intervention efficacy and effectiveness.
As noted earlier, the study investigated performance using displays that were unfamiliar to the participants. The effects on visual search and motor response latencies may change over time with increased familiarity and use of the aided AAC display. Future research is required to investigate the relationship between visual search and motor response latencies over time with greater exposure and use.
Furthermore, the study only considered one approach to AAC displays – that is, visual scene displays (VSDs) with a navigation bar. Research suggests that both layout and organization of AAC displays may affect performance (e.g. Light et al., Citation2019) and prior research has indicated that the placement of content within VSDs may actually drive visual attention (Wilkinson & Finestack, Citation2021). Future research should investigate the relationship between visual fixation latency and motor selection latency with other layouts and organizations to optimize design (e.g. grid-based layouts).
Finally, this study only measured the latencies of visual fixation and motor selection, but did not investigate the visual search process to locate the target or the actual path taken to reach the target and select it. Future research should consider these visual and motor processes in more detail to better understand performance.
Conclusion
Results of this study confirm the strong interrelationship between visual cognitive processing and motor selection in AAC use and suggest that the design of AAC displays influences both processes in similar ways. The results underscore the critical importance of research to determine effective designs for AAC displays to reduce the visual cognitive load and optimize visual search and motor selection. Eye tracking research data may serve as a useful tool in this research, especially when considering individuals who are unwilling or unable to comply with traditional behaviorally-based tasks. Rather than recommend AAC systems based on their familiarity, careful assessment is required to optimize the fit of AAC displays for individuals with complex communication needs in order to enhance the efficiency of visual search and motor selection. Results of this study raise the intriguing possibility that measurement of eye gaze may serve as an effective and efficient tool to predict actual motor selection performance, thereby reducing the time and effort required to determine optimal display design in AAC assessment. Ensuring a good fit between the AAC display and the user is critical to effective communication.
Disclosure statement
The authors have no relevant conflicts of interest.
Additional information
Funding
Notes
1 In this paper, we have used the terms “individuals on the autism spectrum” and “individuals with Down syndrome” to refer to the participants in the two research studies as these are terms used by these participants and their families. However, we understand that the community of AAC users is a diverse one and we respect ever person’s right to choose the words that they prefer.
2 The Tobii X2-60 Eye Tracker is a product of Tobii Pro ©, 510 N Washington Street, Suite 200, Falls Church, VA 22046, USA. https://www.tobiipro.com/
3 The Microsoft Surface Pro tablet is a produce of Microsoft Corporation, One Microsoft Way, Redmond, WA 98052, USA. https://www.microsoft.com/ Specifically, this study utilized the Microsoft Surface Pro 6th Generation that measured 11.5” x 7.9” x 0.33”.
4 Tobii Pro Studio is a product of Tobii Pro ©, 510 N Washington Street, Suite 200, Falls Church, VA 22046, USA. https://www.tobiipro.com/
5 Another possible option was to evaluate the strength of the relationship by calculating a correlation across the entire data set, that is, to consider all the data points without regard to participant identity. This approach considered a greater numbers of points in the analysis, but it had the drawback that the number of points contributed to the analysis differed across participants, as some participants had more trials and some had fewer trials on which both a fixation and a response latency were recorded. With this approach to analysis, the performances of some participants were weighted more than others. For this reason, we opted to use the mean of each participant and calculate the correlation across participants. However, we also calculated the correlation using all available data points and the pattern of results was the same with both analyses.
6 Tobii Pro Glasses is a product of Tobii Pro ©, 510 N Washington Street, Suite 200, Falls Church, VA 22046, USA. https://www.tobiipro.com/
7 Tobii Pro Glasses Controller Software is a product of Tobii Pro ©, 510 N Washington Street, Suite 200, Falls Church, VA 22046, USA.
8 Tobii Pro Lab is a product of Tobii Pro ©, 510 N Washington Street, Suite 200, Falls Church, VA 22046, USA.
References
- Beukelman, D. R., & Light, J. C. (2020). Augmentative and alternative communication: Supporting children and adults with complex communication needs (5th ed.). Paul H. Brookes.
- Brady, N. C., Anderson, C. J., Hahn, L. J., Obermeier, S. M., & Kapa, L. L. (2014). Eye tracking as a measure of receptive vocabulary in children with autism spectrum disorders. Augmentative and Alternative Communication (Baltimore, Md. : 1985)), 30(2), 147–159. https://doi.org/10.3109/07434618.2014.904923
- Costigan, F. A., Light, J., & Newell, A. (2012). Factors affecting computer mouse use for young children: Implications for AAC. Augmentative and Alternative Communication (Baltimore, Md. : 1985)), 28(2), 85–95. https://doi.org/10.3109/07434618.2012.679235
- Dunn, L. M., & Dunn, L. M. (2006). Peabody picture vocabulary test (4th ed.). American Guidance Service.
- Ganz, J. B., & Simpson, R. L. (2019). Interventions for Individuals with Autism spectrum disorder and complex communication needs. Paul H. Brookes.
- Garvey, C., & Berninger, G. (1981). Timing and turn taking in children’s conversations. Discourse Processes, 4(1), 27–57. https://doi.org/10.1080/01638538109544505
- Higginbotham, D. J., Shane, H., Russell, S., & Caves, K. (2007). Access to AAC: Past, present, and future. Augmentative and Alternative Communication (Baltimore, Md. : 1985)), 23(3), 243–257. https://doi.org/10.1080/07434610701571058
- Johnson, J. M., Inglebret, E., Jones, C., & Ray, J. (2006). Perspectives of speech-language pathologists regarding success versus abandonment of AAC. Augmentative and Alternative Communication (Baltimore, Md. : 1985)), 22(2), 85–99. https://doi.org/10.1080/07434610500483588
- Kent-Walsh, J., Murza, K., Malani, M., & Binger, C. (2015). Effects of communication partner instruction on the communication of individuals using AAC: A meta-analysis. Augmentative and Alternative Communication (Baltimore, Md. 1985)), 31(4), 271–284. https://doi.org/10.3109/07434618.2015.1052153
- Liang, J., Wilkinson, K., & Sainburg, R. (2018). Is hand selection modulated by cognitive-perceptual load? Neuroscience, 369, 363–373. https://doi.org/10.1016/j.neuroscience.2017.11.005
- Light, J., Collier, B., & Parnes, P. (1985). Communicative interaction between young nonspeaking physically disabled children and their primary caregivers: Part I—Discourse patterns. Augmentative and Alternative Communication, 1(2), 74–83. https://doi.org/10.1080/07434618512331273561
- Light, J., Wilkinson, K. M., Thiessen, A., Beukelman, D., & Fager, S. (2019). Designing effective AAC displays for individuals with developmental or acquired disabilities: State of the science and future research directions. Augmentative and Alternative Communication (Baltimore, Md. : 1985)), 35(1), 42–55. https://doi.org/10.1080/07434618.2018.1558283
- Niehorster, D. C., Santini, T., Hessels, R. S., Hooge, I. T. C., Kasneci, E., & Nyström, M. (2020). The impact of slippage on the data quality of head-worn eye trackers. Behavior Research Methods, 52(3), 1140–1160. https://doi.org/10.3758/s13428-019-01307-0
- O’Neill, T., Wilkinson, K. M., & Light, J. (2019). Visual attention to AAC displays with a main visual scene display and navigation bar for individuals with and without developmental disabilities. Augmentative and Alternative Communication (Baltimore, Md. : 1985)), 35(3), 240–250. https://doi.org/10.1080/07434618.2019.1635643
- Schopler, E., Reichler, R. J., & Renner, B. R. (1986). The childhood autism rating scale (CARS). Western Psychological Services.
- Sowers, D., & Wilkinson, K. (2023). Demands associated with an augmentative and alternative communication system in relation to alternative forms of access for individuals with motor impairments. American Journal of Speech-Language Pathology, 32(1), 37–54. https://doi.org/10.1044/2022_AJSLP-22-00006
- Thistle, J. J., & Wilkinson, K. M. (2015). Building evidence-based practice in AAC display design for young children: Current practices and future directions. Augmentative and Alternative Communication (Baltimore, Md. 1985)), 31(2), 124–136. https://doi.org/10.3109/07434618.2015.1035798
- Tobii (n.d.-a) Recording with Tobii Pro Glasses 2. https://www.tobiipro.com/learn-and-support/learn/steps-in-an-eye-tracking-study/run/recording-with-tobii-pro-glasses-2/
- Tobii (n.d.-b). Manual and assisted mapping of gaze data on to snapshots and screenshots. https://www.tobiipro.com/learn-and-support/learn/steps-in-an-eye-tracking-study/data/manual-and-assisted-mapping/
- Tobii Pro (2014). November 27). Learn how to use Tobii Pro Glasses 2. https://www.youtube.com/watch?v=Gl_UVvFTuxU
- Venker, C. E., & Kover, S. T. (2015). An open conversation on using eye-gaze methods in studies of neurodevelopmental disorders. Journal of Speech, Language, and Hearing Research: Jslhr, 58(6), 1719–1732. https://doi.org/10.1044/2015_jslhr-l-14-0304
- Wilkinson, K. M., & Bennett, R. (2021). Impact of the design of visual communication supports on social interaction by individuals with Down syndrome. Journal of Interactional Research in Communication Disorders, 10(1), 30–46. https://doi.org/10.1558/jircd.19316
- Wilkinson, K. M., & Finestack, L. (2021). Multi-modal augmentative and alternative communication for individuals with Down syndrome across the lifespan. Paul H. Brookes.
- Wilkinson, K. M., Gilmore, R., & Qian, Y. (2022). Judicious arrangement of symbols on an AAC display optimizes visual attention and speed of responding by individuals with Down syndrome. Journal of Speech, Language, and Hearing Research: Jslhr, 65(2), 710–726. https://doi.org/10.1044/2021_JSLHR-21-00278
- Wilkinson, K. M., & Jagaroo, V. (2004). Contributions of visual cognitive neuroscience to AAC display design. Augmentative and Alternative Communication, 20(3), 123–136. https://doi.org/10.1080/07434610410001699717
- Wilkinson, K. M., & Light, J. (2011). Preliminary investigation of visual attention to human figures in photographs: Potential considerations for the design of aided AAC visual scene displays. Journal of Speech, Language, and Hearing Research: JSLHR, 54(6), 1644–1657. https://doi.org/10.1044/1092-4388(2011/10-0098)
- Wilkinson, K. M., & Light, J. (2014). Preliminary study of gaze toward humans in photographs by individuals with autism, Down syndrome, or other intellectual disability: Implications for design of Visual Scene Displays. Augmentative and Alternative Communication (Baltimore, MD: 1985)), 30(2), 130–146. https://doi.org/10.3109/07434618.2014.904434
- Wilkinson, K. M., & Madel, M. (2019). Eye tracking measures reveal how changes in the design of displays for augmentative and alternative communication influence visual search in individuals with Down syndrome or autism spectrum disorder. American Journal of Speech-Language Pathology, 28(4), 1649–1658. https://doi.org/10.1044/2019_AJSLP-19-0006
- Wilkinson, K. M., & Mitchell, T. (2014). Eye-tracking research for answering well-formed questions about augmentative and alternative communication assessment and intervention. Augmentative and Alternative Communication (Baltimore, Md. : 1985)), 30(2), 106–119. https://doi.org/10.3109/07434618.2014.904435
- Wilkinson, K. M., O'Neill, T., & McIlvane, W. J. (2014). Eye-tracking measures reveal how changes in the design of aided AAC displays influence the efficiency of locating symbols by school-aged children without disabilities. Journal of Speech, Language, and Hearing Research: JSLHR, 57(2), 455–466. https://doi.org/10.1044/2013_JSLHR-L-12-0159
- Wozniak, R. H., Leezenbaum, N. B., Northrup, J. B., West, K. L., & Iverson, J. M. (2017). The development of autism spectrum disorders: Variability and causal complexity. Wiley Interdisciplinary Reviews. Cognitive Science, 8(1-2), e1426. https://doi.org/10.1002/wcs.1426
Appendix A
Table 1. Means, SDs, and ranges of latencies (in seconds) to first visual fixation and motor selection for participants on the autism spectrum (study 1) and participants with Down syndrome (Study 2)