Abstract
Increased interest in blue-green algal toxins in recent years has led to increased monitoring to assess occurrence and levels of toxins in Minnesota lakes. Microcystin (MC), a hepatotoxin, is one of the primary toxins studied in Minnesota and elsewhere in North America. The Minnesota Pollution Control Agency has measured MC in numerous lakes across Minnesota as a part of three separate efforts: (1) A targeted survey in 2006 to assess MC levels in 12 eutrophic lakes in two south central Minnesota counties; (2) A stratified-random survey of 50 lakes in Minnesota as a part of the National Lake Assessment Project; and (3) Incident-based samples from various lakes during 2004–2007 with reports of severe nuisance algal blooms, potential for human health risk and/or documented dog deaths as a result of algal toxins. This investigation focuses primarily on the 2006 study and linkages between MC and other chemical, physical and biological measures. Of 133 MC samples, 94% were above the Method Detection Limit (MDL = 0.15 ug/L). Based on World Health Organization guidelines, 80% of all MC samples ranked in the “low risk” category (<10 μg/L), 8% as “moderate risk” (>10–20 μg/L), 11% as “high risk” (20–2000 μg/L), with an overall maximum of 8400 μg/L. Microcystin exhibited significant positive correlations (Rs) with pH and chlorophyll-a and significant negative correlations with alkalinity and Secchi depth. Data from the other two efforts place the 2006 results in perspective and provide a comprehensive representation of MC concentrations in Minnesota lakes and an improved basis for communicating risk to the public.
Blue-green algae, more appropriately referred to as cyanobacteria, are a common component of the algal community in lakes and rivers in Minnesota and elsewhere in the world. Certain forms of blue-greens have the ability to produce toxins and have been implicated in animal deaths and human-health related problems. These toxins, which include anatoxin, saxitoxin, microcystin (MC) and a more recently described toxin, cylindrospermopsin, vary in their toxicity. Of these, MC is the most commonly measured in many studies. It is an acute hepatotoxin (liver affecting toxin) and is possibly linked to liver tumor promotion (CitationChorus and Bartram 1999). Microcystin is produced by several genera of blue-green algae including: Anabaena, Coelosphaerium, Lyngbya, Microcystis, Oscillatoria, Nostoc, Hapalosiphon and Anabaenopsis.
Blue-green algae and the production of toxins (CitationCarmichael and Gorham 1977) has long been a concern, and recent literature shows numerous efforts in countries such as, Australia (CitationBrookes and Bruch 2004), Germany (CitationChorus et al. 2001), and the United States (CitationGraham et al. 2004) intended to improve understanding of this issue, the factors that lead to toxicity and the ability to manage the blooms that cause the toxicity. Blue-green algae have several properties that contribute to their success in lake communities. Perhaps the most significant is the ability to control their buoyancy to optimize light and nutrient conditions, properties that allow the build-up of scums under certain conditions. Algae at the surface–water interface can take advantage of abundant light as well as atmospheric carbon and nitrogen. The build-up of algal scums is not only related to nutrient concentration and buoyancy but is also influenced by climatic factors such as wind, sunlight and other chemical and physical factors.
Blue-green algal toxicity is not a new issue in Minnesota. Olson (Citation1949, Citation1960) and CitationBuell (1938) documented several incidences of blue-green algal blooms in Minnesota that led to animal deaths, including cattle, horses and dogs dating back to the late 1800s. Studies conducted in response to these incidents associated toxicity with the blue-green genera Anabaena, Aphanizomenon, Coelosphaerium, Lyngbya, and Microcystis.
In recent years (2004–2007) several dog deaths, potential human health impacts and reports of very severe nuisance blooms again prompted renewed interest in blue-green algal toxicity. The Minnesota Pollution Control Agency (MPCA) in the course of these “incident” investigations typically collected MC and supporting water quality data. In 2005 the MPCA joined with the Department of Natural Resources (MDNR), Department of Health (MDH) and the Minnesota Veterinary Medicine Association (MVMA) to form the Minnesota Blue-green Algal Toxicity Workgroup for the express purpose of increasing awareness on blue-green algal toxicity within agencies, the veterinarian community, and the public. A poster, several news releases, fact sheets and an updated web site were all used to increase awareness. Workgroup discussions led to the realization that Minnesota had inadequate information on magnitude and frequency of occurrence of MC in Minnesota lakes.
In summer 2006 a study was conducted to characterize the magnitude and variability of MC in a set of 12 eutrophic lakes in south central Minnesota (). This study (CitationLindon and Heiskary 2007) sought to answer the following questions:
| • | What is the likelihood of encountering measurable MC at a mid-lake pelagic site in eutrophic lakes? | ||||
| • | What is the likelihood of the same when measuring MC at a near-shore site? | ||||
| • | What is the distribution of MC for both mid-lake and near-shore sites? Are these distributions significantly different? | ||||
| • | How do values from this study compare to World Health Organization (WHO) recreational and drinking water guidelines? | ||||
| • | Is there seasonality to MC in these lakes? | ||||
| • | As bloom intensity (chlorophyll-a) increases, is there a greater likelihood of encountering high MC? | ||||
| • | What limnological and physical factors are associated with high MC? | ||||
| • | How can these findings be used to communicate risk to lake users? | ||||
Figure 1 Study lake locations and ecoregion map. 2006 study and 2007 National Lake Assessment Project (NLAP) sites noted.
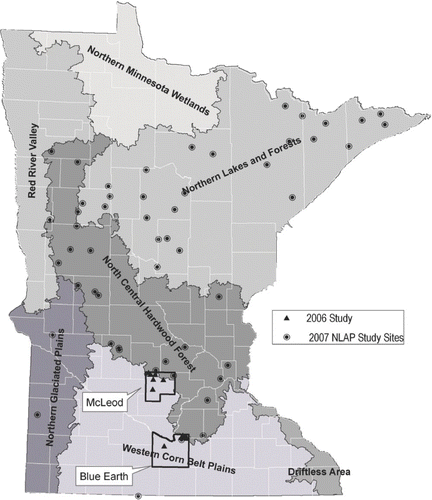
Two additional MC data sets are used as a basis for comparison with the 2006 data: (1) MC samples were collected in 2007 as a part of the National Lakes Assessment Project (NLAP). In contrast to the 2006 study, the NLAP lakes consisted of 50 separate lakes selected randomly as a part of this nation-wide statistically-based sampling effort (). Of the 50 lakes only one, Eagle Lake (Blue Earth County), was also included in the 2006 study. Details on NLAP may be found at: http://www.pca.state.mn.us/water/nlap.html. (2) A second data set was derived from MPCA incident-based monitoring in response to citizen concerns regarding severe nuisance blooms, dog deaths and/or potential human-health problems for 2004–2007. There was no overlap of lakes in this data set with the other two studies.
Study site
The 2006 study focused on south central Minnesota near the North Central Hardwood Forest (NCHF) and Western Corn Belt Plains (WCBP) ecoregion transition (). Both ecoregions have numerous eutrophic to hypereutrophic lakes (CitationHeiskary and Wilson 2008). No previous MC data were found for any of the study lakes. The 2007 NLAP lakes were distributed statewide () consistent with the stratified random study design. In addition to these two studies, “incident-based” MC samples were collected as a part of investigations on select lakes in 2004–2007. The majority of these lakes were located in central or southern Minnesota; none were part of the 2006 or NLAP studies.
Based on percent littoral area, 9 of 12 2006 study lakes were considered shallow (>80% littoral; CitationHeiskary and Wilson 2008). Watershed areas were quite variable () ranging from 162 ha (George) to almost 115,400 ha (Otter). This results in watershed:lake area ratios ranging from about 3:1 (George) to over 1000:1 (Otter). Large watershed:lake area ratios often result in high total phosphorus (TP) and water loading from the watershed and, in extreme instances like Otter Lake, result in very low water residence time (high flushing rate).
Table 1 2006 Study lake morphometric and watershed characteristics
Summer 2006 was characterized by drought conditions throughout much of central Minnesota. May through August temperatures were above normal while September was below the long-term norm in both areas. Precipitation was generally below normal for the May through August period and returned to normal to above normal in September. The northern portion of the study area (McLeod County) experienced five 1-in or greater precipitation events from May through September, while the southern portion was somewhat drier. Summer 2007 was characterized by warm and dry conditions, with May and June being particularly warm relative to the long-term records.
Materials and methods
Sample location, collection and laboratory analysis
In the 2006 study, pelagic (also referred to as mid-lake) sites were selected based on pre-existing sampling sites, where possible, and were typically located near the site of maximum depth. Near-shore sites were located near a downwind shoreline area that allowed accumulation of algae and often resulted in a distinct algal scum on the surface of the water. Pelagic sites were constant among sample events, whereas near-shore sites varied dependant on the wind direction, intensity and presence of an algal bloom.
Samples were collected monthly from May through September. Standard water quality parameters were collected at the pelagic site using a 2-m integrated sampler. Near-shore water quality and all MC samples were collected as surface grab samples. When scums were present, near-shore samples were collected in the midst of the scum. Water chemistry samples and field measurements were taken near the MC sample.
Several field observations were made at each sample event. Dissolved oxygen (DO), temperature, pH, and conductivity profiles (at 1-m intervals) were made at each pelagic site, and surface measures were typically taken at the near-shore site. Secchi transparency was measured at all pelagic sites. Other observations included a subjective assessment of the physical condition and recreational suitability of the lake (CitationHeiskary and Walker 1988). Physical appearance ratings range from 1 = “crystal clear” to 5 = “severely high algae levels, scums and odor”; recreational suitability ratings range from 1 = “beautiful could not be any nicer” to 5 = “swimming and aesthetic enjoyment nearly impossible because of algae levels.”
Chlorophyll-a (Chl-a) samples were filtered on the day of collection, folded and placed in Petri dishes and wrapped in foil. Samples were chilled on ice or frozen prior to shipment to the MDH for analysis. Samples for qualitative assessment of the algae were subsampled at the time of filtering and preserved in Lugols. Dr. Howard Markus, using the Minnesota Rapid Algal Analysis Procedure, later identified these samples to family or genera in most cases. This technique provided a semi-quantitative estimate of the relative biomass of the phytoplankton community, focused on the dominant forms in the sample, and allowed an estimate of the relative amount of MC-producing (MCP) blue-green genera in the sample.
The MDH lab in St. Paul analyzed all water quality samples, with the exception of phytoplankton, providing method numbers and associated quality assurance (QA) information ().
Table 2 Minnesota Department of Health laboratory methods and precision estimates
Lakes in the 2007 NLAP study were sampled on one occasion in either July or August 2007. Water quality samples (including MC) were collected from a mid-lake (index) site. Microcystin was also collected from a random near-shore site on each lake in conjunction with other near-shore measurements. The random sites were established in the office prior to going into the field so there was no subjectivity in their selection. Full details on NLAP parameters measured and sampling procedures may be found at: http://www.pca.state.mn.us/water/nlap.html.
MC analysis and data management
The MDH analyzed MC using a bench-top Abraxis ELISA method, with a method detection limit (MDL) of 0.15 μg/L total MC (for purposes of statistical analysis a nondetect substitution of 0.075 μg/L was used). Samples of MC underwent a triple freezing cell lysis procedure. The MC analysis conducted for this study is summarized as a quantification of MC congeners including nodularins. It has an assay method maximum quantifiable range of 5 μg/L that requires dilution of samples when concentrations are above this range, which can result in reduced accuracy, depending on the amount of dilution. Quality assurance of MC, based on samples from the summer of 2006, can be summarized as:
| • | Percent recovery: 67% within 90–110% and 100% within 75–125% | ||||
| • | Coefficient of variation (CV) between sample and replicate: 56% < 15% and 100% < 25% | ||||
World Health Organization risk guideline categories (CitationWHO 2003) established for recreational waters and drinking water provide a basis for placing the MC data in perspective and describing relative risk. The categories used in this study (from WHO guidelines) were: <1 μg/L = very low risk; 1–10 μg/L = low risk; 10–20 μg/L = moderate risk; 20–2000 =μg/L high risk; and >2000 μg/L = very high risk. The very low risk category was added to include measurements that were very near the MDL for MC and below the 1 μg/L drinking water guideline for MC-LR, one of the most common and toxic MC compounds.
Most of the statistical analysis was conducted in Excel spreadsheets. Because of non-normal distributions of MC, the nonparametric Spearman rank correlation (Rs) was used to evaluate relationships between MC and various chemical, physical and biological variables. Based on these results and plotting of data, cross-tabulation was conducted to further characterize relationships. In this technique the independent variable (e.g., Chl-a) was paired with its respective MC concentration and independent values were ranked (low to high) and sorted into four approximately equal-sized groups. Concentrations of MC were grouped by WHO risk categories, and the distribution of these categories was assessed within each group. Box plots for comparison of MC distributions among the data sets were created in SYSTAT V12.
Results
2006 seasonal patterns in chemical, physical and biological measures
Surface water temperatures ranged from about 14 to 16°C in May to peak temperatures of 26–30°C in late August. Surface temperatures peaked in the northern (McLeod County) lakes in July, while the southern (Blue Earth County) lakes peaked in early August. Rapid cooling in most lakes was evident in September, consistent with a rapid decline in air temperature. Water temperatures were conducive for blue-green algal growth (>22°C) from June through late August on most lakes.
All lakes were eutrophic to hypereutrophic based on TP, Chl-a and Secchi ( and ). TP ranged from ⩽40 μg/L (Stahl's and Ballantyne) to >300 μg/L (Otter and Silver). Based on previously defined Chl-a levels (CitationHeiskary and Walker 1988) “severe nuisance” (Chl-a> 30 μg/L) and “very severe nuisance” (Chl-a>60 μg/L) were common throughout the summer at the pelagic sites ().
Table 3 Summer-mean pelagic water quality 2006: McLeod County lakes. Last column represents the Western Cornbelt Plain (WCBP) ecoregion reference lake interquartile range (CitationHeiskary and Wilson 2008)
Table 4 Summer-mean pelagic water quality 2006: Blue Earth County lakes. Last column represents the NCHF ecoregion reference lake interquartile range (CitationHeiskary and Wilson 2008)
Figure 2a Pelagic chlorophyll-a concentration by lake and date for 2006 study. Severe nuisance bloom level (30 μg/L) noted by heavy black line for perspective. Concentrations beyond scale are noted immediately below bars and ordered by date.
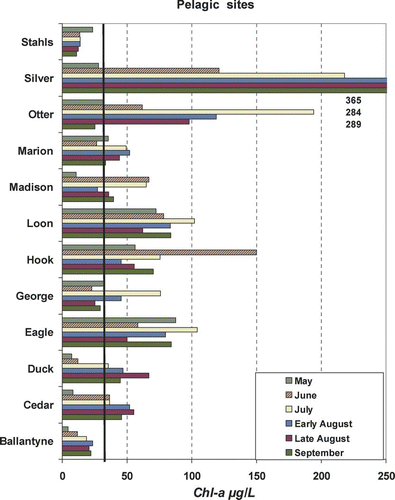
Figure 2b Near-shore chlorophyll-a concentrations by lake and date for 2006 study. Severe nuisance bloom level (30 μg/L) noted by heavy black line for perspective. Concentrations beyond scale are noted immediately below bars and ordered by date.
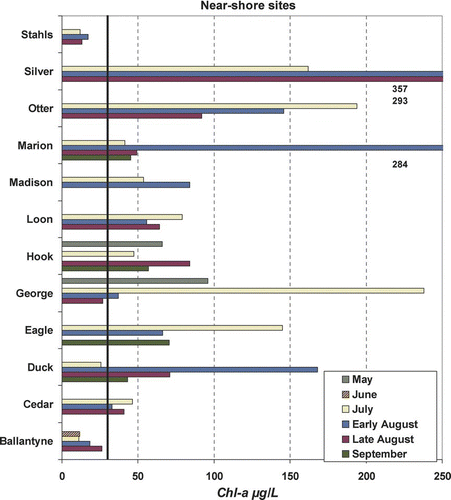
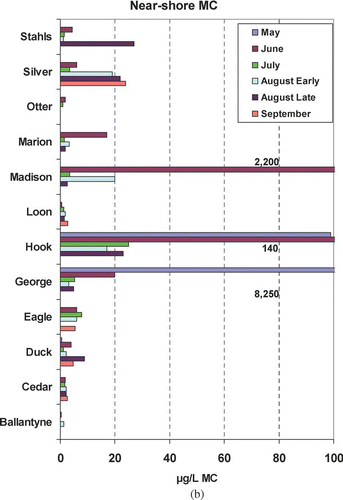
Microcystin exhibited no consistent seasonal pattern at either the pelagic or near-shore sites ( and ). Silver and Hook lakes exhibited the highest pelagic concentrations and had the only concentrations that fell in the moderate risk level (). In contrast, 7 of 12 lakes were below the low risk threshold (10 μg/L) for the entire summer at the pelagic site. High to very high risk concentrations were noted at near-shore sites on three lakes: Madison, Hook and George (). Some of the highest concentrations were from samples collected in May and June, which was not anticipated.
Figure 3a Pelagic microcystin (MC) concentrations by lake and date for 2006 study.
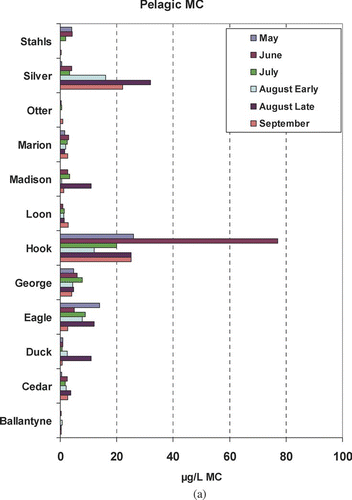
Figure 3b Near-shore microcystin (MC) concentrations by lake and date for 2006 study. MC concentrations beyond scale noted on graph.
Microcystin was highly variable within and among lakes ( and ). Six percent of MC results were below the MDL. More than 25% of the data were between 0.9 μg/L and the non-detect substitution of 0.075 μg/L (). Concentrations of ⩾1 μg/L were unevenly distributed up to 8400 μg/L. Because MC maxima are of most concern, they were not considered as outliers. Near-shore and pelagic sites exhibited different distributions and have statistically different means based on a log normalized t-test and 95% confidence intervals; however, near-shore and pelagic medians were not significantly different. About 85% of the pelagic samples were considered very low to low risk (). Likewise, a high percentage of the near-shore samples were in these categories as well. Distributions for the moderate to high risk categories were not substantially different () among the pelagic and near-shore sites; however, the only very high risk measures were found at the near-shore sites ().
Figure 4 Microcystin (MC) frequency distributions for 2006. Comparisons for (a) pelagic vs. near-shore MC and (b) near-shore (MC) for scum vs. no scum.
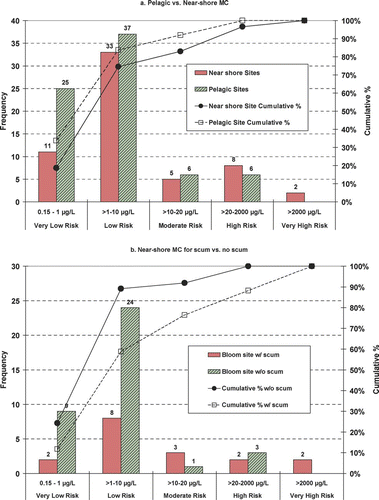
Though it was common for the pelagic sites to have distinct green coloration and high Chl-a, surface scums were limited to the near-shore sites. Even at the near-shore sites, distinct surface scums were not common (). Comparatively, near-shore sites with surface scums exhibited higher and more variable MC compared to sites without scums ().
2006 MC and other environmental factors
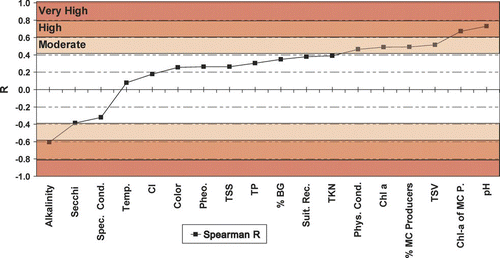
Spearman's rank correlation (Rs) resulted in four moderate and three high correlations with MC (). Parameters exhibiting strong positive R s with MC included: pH, microcystin producers (MCP) Chl-a (Chl-a × % MCP), % MCP, total suspended volatile solids (TSV), Chl-a and physical appearance ratings. Inverse relationships were found with alkalinity, Secchi depth and specific conductance. Parameters highly correlated with MC were typically related to algal biomass (Chl-a) or productivity as well.
Figure 5 Spearman Correlation Coefficients (Rs) for microcystin (MC) and various chemical, physical and biological variables. See for complete parameter names and units.
Based on results () and a lack of distinct linear relationships, we used cross-tabulation to explore the relationship among MC and three variables, Chl-a, Secchi and pH, selected because of their high correlation with MC and ease of measurement in lakes. This provided a means to assess the likelihood (risk) of encountering varying categories of MC over a range of Chl-a, Secchi or pH measurements (–).
Figure 6 Cross tabulation of microcystin (MC) relative to: (a) Chlorophyll-a (bloom intensity) (108 pairs), (b) Secchi (69 pairs) and (c) pH (91 pairs) based on 2006 data. Number of observations in each category noted.
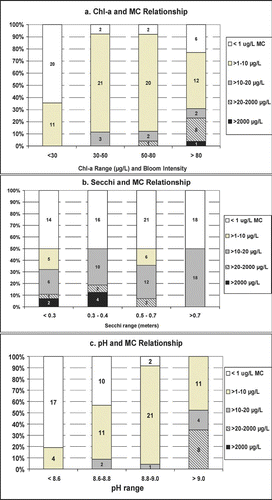
Chl-a concentrations and trends were highly variable among the study lakes ( and ), and no significant linear relationship was evident between MC and Chl-a. Combining MC and Chl-a classes (), which approximate varying degrees of “bloom intensity,” provides a basis for describing the “risk” of encountering specified levels of MC as a function of bloom intensity. Moderate risk MC was not encountered until blooms exceeded 30 μg/L (severe nuisance blooms; ). As blooms exceeded 30–50 μg/L the frequency of moderate to high risk MC increased to ∼30%. All high risk MC concentrations were associated with Chl-a>30 μg/L.
A strong inverse relationship between Secchi depth and algal biomass (Chl-a) has long been noted; Secchi depth also exhibits an inverse relationship with MC (). Similar to the relationship between MC and bloom intensity, a threshold effect was observed; as Secchi declined below 0.5 m, risk of MC concentrations in the moderate to high risk categories increased ().
The variable with the strongest relationship with MC was pH (R s = 0.73; ). More than 90% of the pH values >9.0 were associated with severe nuisance bloom levels (Chl-a>30 μg/L). With the exception of one sample, all lakes with moderate to high risk MC had a pH of ⩾9.0 (). Conversely, alkalinity exhibited a moderate inverse relationship with MC (R s =−0.61). In the 2006 study all pH values ⩾9.0 were associated with alkalinities ranging from 80 to 150 mg/L.
MC comparison among studies
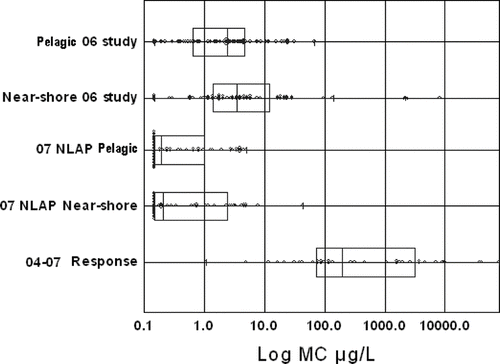
A comparison of the 2006 study of 12 eutrophic lakes with the NLAP and incident-based samples provide further perspective on MC concentrations in Minnesota lakes (). Based on this comparison the distributions of these three data sets are significantly different, which is expected given the population of lakes sampled and focus of each study. The 2006 eutrophic lakes exhibit a larger range and more extreme MC concentrations compared with the NLAP data (). Both data sets reveal higher MC concentrations at near-shore sites compared to mid-lake index sites. The incident-based sampling yielded some extremely high event-based values, which again is expected given the intensity (magnitude) of the blue-green blooms sampled and the subjective nature of site selection.
Figure 7 Microcystin (MC) box and whisker plots by study and site location for 2006 pelagic and near-shore samples; 2007 NLAP pelagic and near-shore samples, and 2004–2007 incident-based samples.
Discussion
Cyanobacteria have the ability to produce several toxins that may be acutely and chronically toxic. Extensive study world-wide on this issue documents toxic events attributed to cyanobacteria, describe the toxicity and action of the various toxins, and describe development of action levels and thresholds that express the relative risk of these toxins (e.g., CitationChorus and Bartram 1999, CitationChorus et al. 2001). Other studies, such as CitationGraham et al. (2004) describe the distribution of particular toxins (MC) and some environmental factors that may contribute to production of the toxin.
The 2006 study focused on MC in eutrophic to hypereutrophic lakes in south-central Minnesota. Several questions to advance knowledge on the extent, magnitude and frequency of MC in Minnesota lakes were posed prior to the study (see introduction) and provide a basis for the following summary comments.
The likelihood of encountering measurable MC at a pelagic site in a eutrophic lake is quite high based on the 2006 study (). When combined with the near-shore samples, 94% of the MC measurements were above the MDL. Near-shore samples () exhibited a larger range, higher mean and much higher maximum value (8400 μg/L) compared to the pelagic samples (69 μg/L). The likelihood of moderate to very high risk MC was found to be greater at sites with a distinct surface scum. These results are consistent with observations by CitationGraham et al. (2004) who note that MC in scums may be much greater than at pelagic locations.
WHO guidelines provided a basis for evaluating the relative risk of the MC concentrations in this study; 80% of all MC concentrations were in the WHO low risk category for recreational waters (82% pelagic and 72% near-shore). The remainder of the pelagic samples was in the moderate to high risk category (). Only two near-shore samples were in the very high risk category ().
Seasonal patterns in MC, similar to typical patterns observed for Chl-a and nuisance algal blooms, were anticipated; however, based on the 2006 study, there was no distinct seasonality to MC concentrations, due in part to two lakes that exhibited very high MC in May and June at near-shore sites. The incident-based sampling and dog deaths (2004–2007) also indicate that elevated MC may occur at any time in the summer. In 2007 incident-based sampling was initiated in June in response to complaints of very severe algal blooms and a documented dog death.
Field and laboratory studies have demonstrated that relationship between cyanobacteria, MC and environmental factors is invariably complex (CitationGraham et al. 2004). Some work indicates that variations in strains among toxin-producing species have more impact on MC production than environmental factors (CitationChorus and Bartram 1999), and isolating key environmental factors affecting MC is often difficult without detailed analysis. Results from the 2006 study reveal strong positive relationships with MC (in order of Rs) for pH, Chl-a of MCP, TSV, %MCP, Chl-a and physical appearance rating. A strong relationship with Chl-a and %MCP is consistent with the findings of previous researchers (e.g., CitationChorus and Bartram 1999, CitationChorus et al. 2001) who noted that toxic incidents involving MC or other blue-green algal toxins are most frequently associated with large surface bloom-forming genera.
Relatively distinct relationships were observed among MC and Chl-a, pH and Secchi. When Chl-a remained <30 μg/L, MC was in the very low to low risk categories (). As Chl-a increased to >30–50 μg/L the risk of moderate to high MC increased to 30%. High correlation of MC with pH is consistent with correlations observed by CitationPaerl and Ustach (1982) and is an expression of algal productivity (Chl-a Rs= 0.58), which is expected given that cyanobacteria prefer a high pH environment (CitationShapiro 1973). The strong inverse relationship with MC and alkalinity is likely a function of algal productivity. CitationWetzel (2001) noted that “rapid photosynthesis can rapidly reduce total dissolved inorganic carbon (DIC) and increase pH.” Thus, alkalinity is not likely a direct driver of MC production; rather it may reflect the superior competitive advantage that blue-greens have at low DIC concentrations, which is most likely to occur in eutrophic, low alkalinity systems at high pH.
High risk MC was found only when Secchi depth was ⩽0.5 m. Because surface blooms of MCP blue-greens, such as Anabaena and Microcystis, routinely result in very low transparency, this relationship is intuitive. This is in contrast to the non-MCP Aphanizomenon that forms large “rafts” that float at the surface and often allow higher transparency.
The 2006 study, as with most MC studies, does not allow precise prediction as to which blue-green algal blooms will produce MC in the moderate to very high risk range; however, the study suggests that Minnesota's current recommendation to the public to avoid contact with very severe nuisance blooms is sound. Very severe nuisance blooms (Chl-a >30 μg/L) are readily recognizable by the public. Moderate to high risk MC was associated with high pH (⩾9.0) and low Secchi (<0.5 m), two parameters that are easy to measure. This suggests that a combination of visual examination of the water to assess bloom intensity (e.g., subjective assessments of physical appearance and recreational suitability) combined with measurement of all or some of the three variables (Chl-a, Secchi and pH) can allow resource managers to estimate the potential risk of encountering moderate to high risk MC. Further, three independent data sets indicate that MC is measurable across a wide range of Minnesota lakes and ecoregions and, collectively, these data () provide a good basis for evaluating MC data from future monitoring efforts in Minnesota.
Minnesota does not have widely accepted thresholds (nor do most states) for assessing MC risk for aquatic recreational use, although some states (e.g., Nebraska) do issue health alerts based on MC measurements and have established thresholds for this purpose (CitationNebraska DEQ 2009). We used WHO thresholds as a basis to assess risk, but no attempt was made to assess their validity for assessing risk in Minnesota's waters. For Minnesota, and perhaps other states, it may be desirable to more closely review existing WHO thresholds to determine if mutually agreed upon thresholds could be developed for the purpose of assessing the risk to humans and animals that may come in contact with or consume water containing MC. From a risk communication standpoint, note that several other toxins (e.g., saxitoxin and anatoxin) may be produced by cyanobacteria as well as other algae, and it may be valuable in future studies to determine their relative concentrations and how they vary relative to MC, Chl-a and other factors.
Acknowledgments
We would like to thank Minnesota Pollution Control Agency management for support of this work and the contributions of numerous staff who assisted with sample collection during the course of the various surveys. Lastly, we thank Dr. Alex Horne and Dr. Jean Jacoby for their comments that helped to improve this manuscript.
Notes
1Average of individual means of 10 duplicates.
2 Difference expressed as a % of observed concentration.
References
- Brookes , J. and Bruch , M. 2004 . Toxic cyanobacteria management in Australian waters . LakeLine , 24 ( 4 ) : 29 – 32 .
- Buell , H. 1938 . A community of blue-green algae in a Minnesota pond . Ecology , 19 : 224 – 232 .
- Carmichael , W. and Gorham , P. 1977 . Factors influencing the toxicity and animal susceptibility of Anabaena flos-aquae (Cyanophyta) blooms . J. Phycol. , 13 : 97 – 101 .
- Chorus , I. and Bartram , J. 1999 . Toxic cyanobacteria in water , London : World Health Organization, E & FN Spon .
- Chorus , I. , Niesel , V. , Fastner , J. , Wiedner , C. , Nixdorf , B. and Lindenschidt , K-E. 2001 . Environmental factors and microcystin levels in water bodies , Edited by: Chorus , I. 159 – 177 . Springer , Berlin : Cyanotoxin: occurrence, causes, consequences .
- Graham , J. L. , Jones , J. R. , Jones , S. B. , Downing , J. A. and Clevenger , T. E. 2004 . Environmental factors influencing microcystin distribution and concentration in Midwestern United States . Water Res. , 38 : 4395 – 4404 .
- Heiskary , S. A. and Walker , W. W. 1988 . Developing phosphorus criteria for Minnesota lakes . Lake Reserv. Manage. , 4 ( 1 ) : 1 – 10 .
- Heiskary , S. A. and Wilson , C. B. 2008 . Minnesota's approach to lake nutrient criteria development . Lake Reserv. Manage. , 24 ( 3 ) : 282 – 297 .
- Lindon , M. J. and Heiskary , S. A. 2007 . “ Microcystin levels in eutrophic south central Minnesota lakes ” . In Part of a series on Minnesota Lake Water Quality Assessment , 53 St. Paul , MN : MPCA . http://www.pca.state.mn.us/publications/reports/wq-lar3-11.pdf. Accessed 21 Nov 2008.
- Nebraska Department of Environmental Quality . 2009 . 2009 toxic blue-green algae and bacteria sampling results http://www.deq.state.ne.us/. Accessed 5 Jun 2009.
- Olson , T. A. 1949 . History of toxic plankton and associated phenomena. 1949 . Sewage Works Engineering and Municipal Sanitation , 20 : 71
- Olson , T. A. 1960 . Water poisoning—a study of poisonous algae blooms in Minnesota . Am. J. Public Health , 50 : 883 – 884 .
- Paerl , H. W. and Ustach , J. F. 1982 . Blue-green algal scums: an exploration for their occurrence during fresh water blooms . Limnol. Oceanogr. , 27 ( 2 ) : 212 – 217 .
- Shapiro , J. 1973 . Blue-green algae: why they become dominant . Science , 179 : 382 – 384 .
- Wetzel , R. G. 2001 . “ Limnology ” . In Lake and River Ecosystems. , 3rd , Academic Press .
- WHO . 2003 . “ Guidelines for safe recreational water environments ” . In Coastal and fresh waters , Volume 1 , Geneva , , Switzerland : World Health Organization .