Abstract
The Ontario Ministry of the Environment provides an algal identification service as part of the Ministry's response to algal bloom events, and we have been tracking the reports since 1994. From 1994 through 2009, we noted a significant increase in the number of algal blooms reported each year (P < 0.001). There was also an increase in the number of blooms in which cyanobacteria were dominant (P < 0.001), with these samples making up >50% of the total during peak years. The most common taxa of cyanobacteria identified were Anabaena, Aphanizomenon, Microcystis, Gloeotrichia, and various Oscillatoriales. The remaining samples were dominated by filamentous green algae, or occasionally by chrysophytes. We also noted geographic and seasonal trends in the bloom reports. Most of the increase in the number of cyanobacterial bloom reports was accounted for from lakes on the Canadian Shield (located within the boundary of the Ministry's Northern Region). Algal blooms are now being reported later into the fall than they were during the 1990s; bloom reports have extended well into November in recent years. We attributed these trends to (1) increased nutrient inputs in some areas, which promote the growth of algae; (2) factors associated with climate warming, which may exacerbate bloom conditions; and (3) an increase in public awareness of algal issues. An increase in algal bloom reports is a management issue in Ontario, and blooms of potentially toxin-producing cyanobacteria prompted a formal response protocol to be followed.
Nuisance growths of algae and algal blooms are a concern in lakes and rivers throughout the world (e.g., CitationBiggs and Price 1987, CitationFalconer 2001, CitationHiggins et al. 2005, CitationHeisler et al. 2008). Although algal blooms can be natural phenomena, they have expanded as an issue over the last several decades in terms of both extent and public perception (CitationAnderson et al. 2002). Reports of blooms of toxic cyanobacteria in the Great Lakes, for example, have increased significantly since the late 1990s (CitationWatson et al. 2008), and more coastal algal blooms have occurred over the past decade than in previous decades (CitationHeisler et al. 2008). Favourable conditions for algal blooms include elevated nutrient concentrations, warm temperatures, and shallow, slow moving water (CitationOliver and Ganf 2000). Nutrient enrichment in particular has been associated with increases in algal biomass in freshwater systems worldwide (CitationWatson et al. 1997, CitationSmith 2003, CitationHeisler et al. 2008). Other human activities that promote nuisance growths of algae include acidification (CitationTurner et al. 1995) and introductions of nonnative species (CitationVanderploeg et al. 2001, CitationHiggins et al. 2005). Recent studies also indicate that climate change is a potent catalyst for the further expansion of algal blooms (CitationPaerl and Huisman 2008, CitationPaerl 2010). Rising temperatures favour bloom-forming cyanobacteria because they have higher temperature requirements and because they are able to regulate their buoyancy under conditions of reduced vertical water column mixing (CitationJöhnk et al. 2008, CitationPaerl and Huisman 2008, Wagner and Adrian 2009).
Blooms of cyanobacteria are of particular concern in freshwater systems because of the potential of many species to produce toxins (CitationDow and Swoboda 2000). Toxins produced by cyanobacteria (cyanotoxins) impact human and animal health and can affect freshwater ecosystem processes (CitationDow and Swoboda 2000). Cyanotoxins can be classified into 2 general groups: (1) the neurotoxins and hepatotoxins, which can cause acute lethal poisoning; and (2) the cytotoxins, which are not highly lethal to animals but show selective bioactivity. Several species of cyanobacteria and chrysophytes also release noxious taste and/or odour-causing compounds that can have negative impacts on the public and the drinking water industry (CitationWatson et al. 2001, 2008, CitationWatson 2004). Recent taste and odour events in Lake Ontario, for example, had major impacts on the drinking water provided to a large consumer population drawing from these sources and caused widespread public reaction (CitationWatson 2004).
The Ontario Ministry of the Environment's (MOE) Environmental Monitoring and Reporting Branch processes bloom samples as part of a coordinated provincial government response protocol for incidences of algal blooms. Algal identification services have been offered by the group since the 1960s. Samples are rapidly analyzed microscopically to determine whether or not the species dominating the bloom are cyanobacteria with the potential for toxin production. The presence of cyanobacteria initiates further steps through the response protocol, whereas the absence of cyanobacteria ends the formal response. Initial taxonomic analysis is followed by detailed identification of the algae in the sample, whether or not the bloom is cyanobacterial.
Anecdotal evidence of an increase in the frequency and changes in the timing of algal bloom reports in Ontario led us to explore our records of algal bloom reports and associated algal identification descriptions from 1994 to 2009 to determine (1) whether there has been an increase in the number of algal bloom reports, and of cyanobacterial reports in particular; and (2) whether algal blooms in Ontario are now being reported over a longer season than they were in the past. In addition, we examined trends in the geographic distribution of the algal blooms reported in Ontario.
Methods
In this study, we defined an algal bloom as an excessive growth of algae (including cyanobacteria) in a lake or river to a level that prompts a complaint; we included planktonic forms as well as metaphytic or benthic filamentous algae. Algal bloom samples were collected below the surface of the water from dense areas of growth, usually by MOE regional or district office staff responding to an algal bloom reported by a member of the public. The samples were examined microscopically by MOE algal monitoring staff using inverted microscopy (CitationHopkins and Standke 1992). The algal taxa in the samples were identified to the lowest taxonomic level possible (usually genus or species). The results were then reported in the form of an algal identification report that described the taxa identified and provided information on their biology and potential for toxin production and/or taste and odour concerns.
We assembled a database from the algal identification reports compiled since 1994. We recorded dates, source and location information (including lake name, site description, and geographic coordinates when available), the MOE region from which the sample originated and the algal taxa identified, and noted those taxa that were reported as being dominant in each sample. Our analysis excluded those samples in which algae were absent or did not make up the bulk of the biomass of the sample (e.g., if the sample was predominantly made up of nonalgal organisms such as fungi or bryozoa). We also removed replicate samples of a particular bloom event (either from another location or on a later date to track the dissipation of a bloom). Each sample included in the analyses therefore represented a unique, confirmed algal bloom event. Cyanobacterial bloom samples submitted in 2009 were accompanied by geographic location information that allowed mapping of the blooms.
Also in 2009, bloom samples containing cyanobacteria were screened for the presence of microcystins, cyanobacterial hepatotoxins, by the MOE's Laboratory Services Branch using enzyme-linked immunosorbent assays (ELISA). The total amounts of the microcystin variants that were responsive to the antibodies of the ELISA kit were measured following rupturing of cell walls by freeze–thawing. Samples with total microcystin concentrations >0.15 μg/L were reported as positive for the toxins.
Figure 1 Total number of algal bloom events reported to the Ontario Ministry of the Environment each year from 1994 to 2009 with breakdown of reports by dominant algal group. The category “other” refers to algal classes for which blooms were occasionally reported and includes diatoms, xanthophytes, dinoflagellates, cryptophytes, and euglenophytes.
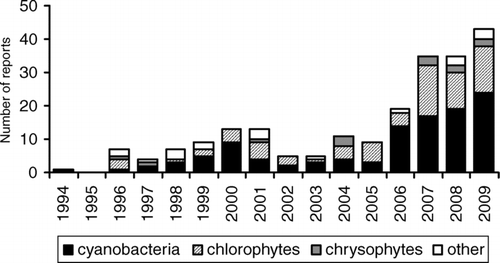
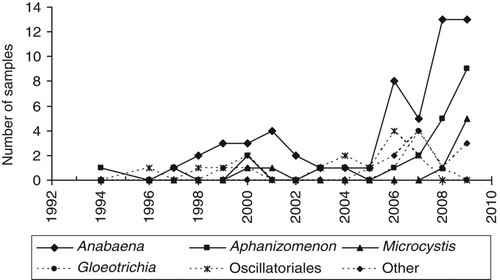
Figure 2 Trends in the taxa of cyanobacteria dominant or co-dominant in algal blooms reported to the Ontario Ministry of the Environment from 1994 to 2009.
The algal bloom report data were examined for monotonic trends from 1994 to 2009 using Mann-Kendall trend tests (CitationYu et al. 1993) with a Microsoft Excel add-in developed by CitationLibiseller and Grimvall (2002). We employed the Z statistic to test for the presence of a monotonic trend over time (CitationYue et al. 2002). Specifically, trends in the total number of bloom reports as well as the number dominated by 3 groups of algae (cyanobacteria, chlorophytes, and chrysophytes) were examined. The total number of bloom reports and the number dominated by cyanobacteria were also examined separately for each of the 5 regions of the MOE (Northern, Eastern, Southwestern, West Central, and Central). In addition, trends in the earliest and the latest day of the year that an algal bloom was reported were examined.
Table 1 Summary statistics of the Mann-Kendall (M-K) trend tests and breakpoint years from segmented regression analysis (BP) on the number of algal bloom samples reports (total) and the number in which dominance by cyanobacteria, chlorophytes, or chrysophytes was confirmed from 1994 to 2009.
Breakpoint analyses were performed using the SegRegW computer program (version 1.0.0, developed by Roland Oosterban) for the total number of bloom reports in Ontario and the number dominated by cyanobacteria, chlorophytes, and chrysophytes. To determine if and when there was a breakpoint in the data, the program searched for a segmented regression (2 horizontal and/or sloping lines on either side of the breakpoint) that minimized the error sum of squares compared with a single regression line, and then tested if the additional variation explained by the segmented linear regression was significant CitationOosterban et al. 1990).
Results
The total number of algal blooms reported in Ontario to MOE each year increased significantly (P < 0.001) from 1994 to 2009 (; ). In particular, there were significant increases in the number of blooms dominated by cyanobacteria and chlorophytes (). The greatest rate of increase was in cyanobacterial blooms, which made up >50% of the total on average (). Significant breakpoints in the trends were identified between 2004 and 2005 for the total number of blooms and cyanobacteria, and between 2003 and 2004 for chlorophytes (P < 0.01; ). The numbers remained relatively constant until 2004 (total number of blooms and cyanobacteria blooms) or 2003 (chlorophyte blooms) and increased afterward. There was an increase in the number of chrysophyte blooms reported, but the trend was not significant (). Several chrysophyte blooms have been consistently reported each year since 2007 ().
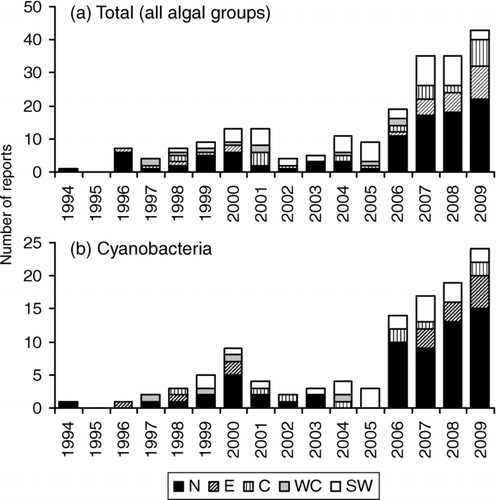
Figure 3 The number of (a) algal bloom reports (total), and (b) samples in which dominance by cyanobacteria was confirmed each year from 1994 to 2009, broken down by Ontario Ministry of the Environment region (Northern = N; Eastern = E; Central = C; West Central = WC; Southwestern = SW). See for a map of the regions.
The most common cyanobacterial taxa identified (in order of occurrence) were Anabaena spp. (A. lemmermanni and A. flos-aquae in particular), Aphanizomenon spp. (primarily A. flos-aquae), Microcystis spp. (primarily Microcystis aeruginosa), Gleotrichia echinulata, and various Oscillatoriales, including Oscillatoria, Lyngbya, Planktothrix, and Phormidium (). No Cylindrospermopsis blooms have been reported to our group to date. The most common chorophytes identified (in order of occurrence) were the filamentous genera Spirogyra (14 occurrences in total), Cladophora (12) and Mougeotia (12), Zygnema (7), Oedogonium (6). The other algal classes for which blooms were occasionally reported were diatoms, xanthophytes, dinoflagellates, cryptophytes, and euglenophytes.
Algal bloom events were reported from all 5 MOE regions (, ); however, most blooms were reported from the Northern Region. This region spans the largest area of the province and is the area in which most of Ontario's lakes are located. The total number of blooms and blooms of cyanobacteria reported increased significantly (P < 0.01) from 1994 to 2009 in the Northern, Central, and Southwestern regions. The total number of blooms reported each year increased from 0 to 22, 0 to 8, and 0 to 10 in the Northern, Central, and Southwestern regions, respectively, and the number of blooms of cyanobacteria from 0 to 15, 0 to 2, and 0 to 5. The rates of increase in the number of blooms (total and cyanobacteria) were highest in the Northern Region. The total number of blooms also increased significantly (P < 0.01) in the Eastern Region, where most of the increase was accounted for by filamentous green algae.
Table 2 Summary statistics of the Mann-Kendall (M-K) trend tests on the number of algal bloom samples processed (total) and those in which dominance by cyanobacteria was confirmed from 5 Ontario Ministry of the Environment regions from 1994 to 2009 (see for a map of the regions).
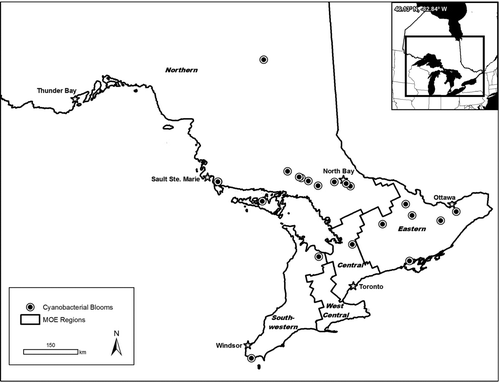
Overall, blooms of cyanobacteria were reported in 66 inland lakes in Ontario between 1994 and 2009. Most lakes (50) had a single bloom report, 11 lakes had blooms reported in 2 years, 4 lakes had reports in 3 years, and 1 lake had reports in 8 of the years between 1994 and 2009. In 2009, cyanobacterial blooms were reported in 24 lakes (). Most were in the Northern Region, particularly in the Sudbury, Algoma, Kenora, and Parry Sound Districts. In 2009, 16 of the 24 blooms reported tested positive for the presence of microcystin based on ELISA testing.
Figure 4 Location of cyanobacterial blooms reported to the Ontario Ministry of the Environment in 2009 and the 5 ministry regions in Ontario, Canada.
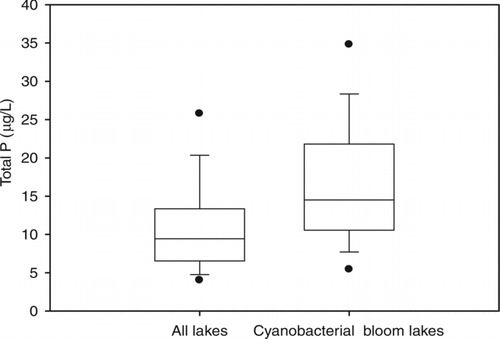
The spring total P data from a subset of the lakes (39) from which cyanobacterial blooms were reported were compared with concentrations recorded for 1074 Ontario lakes through the MOE Lake Partner Program from 2002 to 2009 (n = 711 and 4831, respectively; ). The median spring total P concentration of lakes from which blooms were reported (15 μg/L) was significantly higher (P< 0.001) than that of all lakes (9 μg/L). The concentrations of half the lakes from which blooms of cyanobacteria were reported ranged between 11 and 22 μg/L (within an entire range from 3 to 93 μg/L), whereas half the Lake Partner Program lakes ranged between 7 and 13 μg/L (entire range 1–107 μg/L).
Figure 5 Box plots showing spring (May) total P concentrations (μg/L) in lakes sampled through the Ontario Ministry of the Environment's Lake Partner Program from 2002 to 2009. Plots are for data from all of the lakes (1074) and for those lakes in the dataset from which blooms of cyanobacteria have been reported (39). The boundaries of the box indicate the 25th and 75th percentiles, the line within the box marks the median, the error bars above and below the box indicate the 10th and 90th percentiles, and the outlying points indicate the 5th and 95th percentiles.
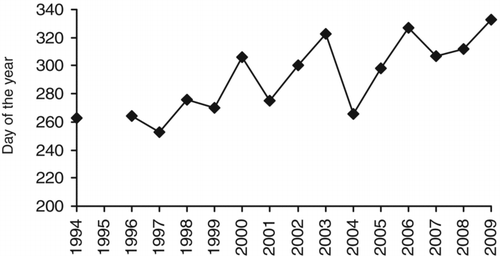
We also noted a significant increase in day of year the last bloom was reported in a given year (P < 0.001, ), indicating that blooms are being reported later in the year in recent years compared to 15 years ago. In particular, cyanobacterial bloom reports have consistently extended well into November since 2006. No change was seen in day of year the first bloom was reported (data not shown).
Figure 6 Latest day of the year that an algal bloom was reported to the Ontario Ministry of the Environment each year from 1994 to 2009.
Discussion
The number of blooms of cyanobacteria and filamentous green algae reported in Ontario over the last 15 years has increased. This trend is consistent with the observation that algal blooms are increasing in lakes throughout the world. Global increases in algal blooms have primarily been attributed to nutrient enrichment (CitationHeisler et al. 2008) exacerbated by climate change (CitationPaerl and Huisman 2008). The highest increase in algal bloom reports in Ontario occurred in lakes on the Canadian Shield in MOE's Northern Region, primarily in its southern range. Lakes in this area are usually phosphorus limited and are consequently impacted by shoreline development and associated phosphorus inputs when present (CitationPaterson et al. 2006). General increases in human activity on and around the lakes in which blooms have been reported (e.g., increasing cottage and residential usage and residential development) may have contributed to increases in nutrient inputs promoting the growth of filamentous green algae and cyanobacteria.
The lakes from which blooms of cyanobacteria were reported were characterized by higher median total P concentrations (15 μg/L) compared to a dataset from 1074 Ontario lakes (9 μg/L). However, the lakes in which the blooms were reported varied in total P concentrations, and 26% of the lakes are classified as oligotrophic (with spring total P <10 μg/L). These occurrences of cyanobacterial blooms in low nutrient lakes indicate that an array of factors likely contributed to bloom occurrence. Both the composition and total quantity of the nutrient pool impact cyanobacteria (CitationHeisler et al. 2008), as does the availability of iron (CitationMolot et al. 2010). Many of the lakes included in our dataset are also subject to multiple additional environmental stressors that affect phytoplankton community composition, including acidification and associated base-cation declines, the presence of invasive species, and climate change (CitationPaterson et al. 2008).
Climate change, specifically rising temperatures, promotes conditions that favour cyanobacteria and the formation of blooms, including increased water temperatures, lengthening of the ice-free season, and reduced water column mixing (CitationPaerl and Huisman 2008). These conditions also favour other bloom-forming algal groups. For example, increases in the relative abundance of filamentous green algae in response to warmer temperatures have been observed in the Experimental Lakes Area in Ontario (CitationSchindler 1997) and in mesocosm experiments in Denmark (CitationTrochine et al. 2010). Ontario's lakes are located in a region where warming over the last few decades has resulted in increases in the length of the ice-free period as well as longer and stronger thermal stratification, and where many lakes have crossed climatically induced ecological thresholds (CitationFutter 2003, CitationRühland et al. 2008). For example, a warmer climate regime has played an important role in exacerbating recent cyanobacterial blooms in Lake of the Woods, a large lake straddling the borders of Ontario, Manitoba, and Minnesota (CitationRühland et al. 2010). Therefore, climate-induced change in the region has likely contributed to increases in the frequency of algal blooms in Ontario.
Although lower in numbers than those of cyanobacteria or filamentous green algae, chrysophyte blooms have been reported to MOE from lakes on the Canadian Shield in recent years. This observation is consistent with paleoecological (CitationPaterson et al. 2004, CitationHyatt et al. 2010) and monitoring (CitationPaterson et al. 2008) observations that the relative and absolute abundances of colonial chrysophyte algae have increased in this region over the past 3 decades. These shifts in phytoplankton community composition coincided with water chemistry changes associated with industrial activity since the mid-1900s and with physical changes linked to climate indices (CitationPaterson et al. 2008).
Although increases in nutrient inputs and a warming climate are probable contributors to increases in the number of algal blooms reported across Ontario, it is also possible that an increase in public awareness of algal issues has contributed to this pattern. In our study, we recorded reports of blooms rather than strategically monitoring for incidences, so an increase in awareness could have led to an increase in the number of reports. Increased awareness may have resulted from outreach and education efforts by the MOE, municipalities, conservation authorities, nongovernmental organizations, and cottage associations to educate the public about algal blooms and water quality. For example, MOE released Fact Sheets on algae and algal blooms to the public in 2004 and 2005, respectively (MOE 2004, 2005). In addition, media reports of algal blooms within and outside of Ontario may have led to an increase in public awareness of this issue. Notably, widespread cyanobacterial blooms in the province of Québec since 2007 resulted in over 200 lakes being declared off limits to bathers (CitationPriskin 2008), which was reported by the media in Ontario. Although the increase in algal blooms we report here preceded the 2007 blooms reported in Québec, public interest in algal issues was probably raised as a result. Conversely, algal blooms may go unnoticed and/or unreported to MOE, resulting in an under representation of the extent of algal blooms in Ontario.
An increase in either awareness or extent of algal blooms is a management issue in Ontario. The algal blooms reported are aesthetically unpleasant and cause local residents to question the quality of their water and to seek mitigation. The cyanobacteria typically observed are potential cyanotoxin producing species, resulting in the need for response by MOE and Health Units to address the potential risks of each bloom event to human and animal health. MOE regards any cyanobacterial bloom as potentially toxic, whether or not toxins are detected in the water upon testing. The risk a bloom poses to human and animal health guides appropriate response measures and is determined by assessing whether the subject waterbody is a source of drinking water (for humans and/or livestock), to what extent it is used recreationally by the local population (e.g., public beaches, parks, and swimming areas), and whether a significant number of unsophisticated drinking water systems are drawing from the source. The algal bloom reporting season has become significantly longer over the last 15 years, extending the period over which response is required.
Overall, we have observed an increase in algal bloom reports in Ontario from 1994 to 2009. Interpreting this trend is challenging because public awareness and the accessibility of lakes play an important role in whether or not blooms are reported. The greatest increase was in blooms of cyanobacteria, particularly in MOE's Northern Region where lakes are affected by multiple, interrelated stressors. Foremost among these are the effects of recent climate change, including a longer open-water season and increased period of thermal stratification (CitationSmol 2010). If water temperatures increase and water column mixing decreases with enhanced thermal stratification, cyanobacteria may continue to be favoured (CitationJöhnk et al. 2008, CitationPaerl and Huisman 2008). Elevated nutrient levels increase the susceptibility of lakes to these shifts, and the management of nutrient inputs to Ontario's aquatic ecosystems will be important in reducing the extent of algal blooms. Increasing our understanding of the interplay among stressors that promote the occurrence of blooms is also important, particularly in those lakes where nutrient levels are low.
Acknowledgments
We thank Zachary Ramwa (Geomatics group, Environmental Monitoring and Reporting Branch, MOE) for producing the map of cyanobacterial blooms, MOE's Laboratory Services Branch for microcystin screening and Ching Lo for advice on interpretation, Joelle Young for statistical advice, Devjani Dhar for compiling algal bloom data, Andrew Paterson for his review, advice and perspective, John Smol and two anonymous reviewers for comments that helped improve the manuscript, and the MOE Regional and District staff, Health Units and other groups that have collected and submitted the algal bloom samples to our group throughout the years.
Related Research Data
References
- Anderson , D M , Gilbert , P M and Burkholder , J M . 2002 . Harmful algal blooms and eutrophication: nutrient sources, composition and consequences . Estuaries. , 25 : 704 – 726 .
- Biggs , B JF and Price , G M . 1987 . A survey of filamentous algal proliferations in New Zealand rivers . New Zeal J Mar Fresh. , 21 : 175 – 191 .
- Clark , B J , Paterson , A M , Jeziorski , A and Kelsey , S . 2010 . Assessing variability in total phosphorus measurements in Ontario lakes . Lake Reserv Manage. , 26 : 63 – 72 .
- Dow , C S and Swoboda , U K . 2000 . “ Cyanotoxins. ” . In The ecology of cyanobacteria , Edited by: Whitton , B A and Potts , M . 613 – 632 . Dordrecht (The Netherlands): Kluwer Academic .
- Falconer , IR. 2001 . Toxic cyanobacterial bloom problems in Australian waters: risks and impacts on human health . Phycologia. , 40 : 228 – 233 .
- Futter , MN. 2003 . Patterns and trends in Southern Ontario lake ice phenology . Environ Monit Assess. , 88 : 431 – 444 .
- Heisler , J , Gilbert , P M , Burkholder , J M , Anderson , D M , Cochlan , W , Dennison , W C , Dortch , Q , Gobler , C J , Heil , C A Humphries , E . 2008 . Eutrophication and harmful algal blooms: a scientific consensus . Harmful Algae. , 8 : 3 – 13 .
- Higgins , S N , Howell , E T , Hecky , R E , Guildford , S J and Smith , R E . 2005 . The wall of green: the status of Cladophora glomerata on the northern shores of Lake Erie's eastern basin, 1995–2002 . J Great Lakes Res. , 31 : 547 – 563 .
- Hopkins , G J and Standke , S J . 1992 . Phytoplankton methods manual. Ontario Ministry of the Environment Report , Ontario (Canada): Queen's Printer for Ontario. .
- Hyatt , C V , Paterson , A M , Cumming , B F and Smol , J P . 2010 . Factors related to regional and temporal variation in the distribution of scaled chrysophytes in north-eastern North America: evidence from lake sediments . Nova Hedwigia. , 136 : 87 – 102 .
- Jöhnk , K D , Huisman , J , Sharples , J , Sommeijer , B , Visser , P M and Strooms , J . 2008 . Summer heatwaves promote blooms of cyanobacteria . Global Change Biol. , 14 : 495 – 512 .
- Libiseller , C and Grimvall , A . 2002 . Performance of partial Mann-Kendall tests for trend detection in the presence of covariates . Environmetrics , 13 : 71 – 84 .
- [MOE] Ontario Ministry of the Environment . 2004 . Green Facts Bulletin #1: What are algae? , Ontario Ministry of the Environment Publication . [cited 27 Aug 2010]. Available from http://www.ene.gov.on.ca/programs/4661e.pdf
- [MOE] Ontario Ministry of the Environment . 2005 . Information about blue-green algae: Background, potential impacts to human health and safety of drinking water , Ontario Ministry of the Environment Publication . [cited 27 Aug 2010]. Available from http://www.ene.gov.on.ca/cons/5087.pdf
- Molot , L A , Guiyou , L , Findlay , D L and Watson , S B . 2010 . Iron-mediated suppression of bloom-forming cyanobacteria by oxine in a eutrophic lake . Freshwater Biol. , 55 : 1102 – 1117 .
- Oliver , R L and Ganf , G G . 2000 . “ Freshwater blooms ” . In The ecology of cyanobacteria , Edited by: Whitton , B A and Potts , M . 149 – 194 . Dordrecht (The Netherlands): Kluwer Academic Publishers .
- Oosterbaan , R J , Sharma , D P , Singh , K N and Rao , KVGK . 1990 . “ Crop production and soil salinity: evaluation of field data from India by segmented linear regression with breakpoint ” . In In: Proceedings Symposium: Land Drainage for Salinity Control in Arid and Semi-Arid Regions III , 373 – 383 . Cairo (Egypt): Drainage Research Institute .
- Paerl , HW. 2010 . CyanoHABs and climate change. This is NALMS . Fall 2010 , [cited 10 Dec 2010]. Available from: http://www.nalms.org/nalmsnew/userfiles/file/This_is_NALMS_rev%20sm.pdf
- Paerl , H W and Huisman , J . 2008 . Blooms like it hot . Science. , 320 : 57 – 58 .
- Paterson , A M , Cumming , B F , Smol , J P and Hall , R I . 2004 . Marked recent increases of colonial scaled chrysophytes in boreal lakes: implications for the management of taste and odour events . Freshwater Biol. , 49 : 199 – 207 .
- Paterson , A M , Dillon , P J , Hutchinson , N J , Futter , M N , Clark , B J , Mills , R B , Reid , R A and Scheider , W A . 2006 . A review of the components, coefficients and technical assumptions of Ontario's lakeshore capacity model . Lake Reserv Manage. , 22 : 7 – 18 .
- Paterson , A M , Winter , J G , Nicholls , K H , Clark , B J , Ramcharan , C W , Yan , N D and Somers , K M . 2008 . Long-term changes in phytoplankton composition in seven Canadian Shield lakes in response to multiple anthropogenic stressors . Can J Fish Aquat Sci. , 65 : 846 – 861 .
- Priskin , J. 2008 . Implications of eutrophication for lake tourism in Québec . Téoros , 27 ( 2 ) : 59 – 61 . [cited 3 aug 2010]. Available from http://teoros.revues.org/139
- Rühland , K , Paterson , A M , Hargan , K , Jenkin , A , Clark , B J and Smol , J P . 2010 . Reorganization of algal communities in the Lake of the Woods (Ontario, Canada) in response to turn-of-the-century damming and recent warming . Limnol Oceanogr. , 55 : 2433 – 2451 .
- Rühland , K , Paterson , A M and Smol , J P . 2008 . Hemispheric-scale patterns of climate-related shifts in planktonic diatoms from North American and European lakes . Global Change Biol. , 14 : 2740 – 2754 .
- Schindler , DW. 1997 . Widespread effects of climatic warming on freshwater ecosystems in North America . Hydrol Process. , 11 : 1043 – 1067 .
- Smith , VH. 2003 . Eutrophication of freshwater and coastal marine ecosystems a global problem . Environ Sci Pollut Res. , 10 : 126 – 139 .
- Smol , JP. 2010 . The powers of the past: using sediments to track the effects of multiple stressors on lake ecosystems . Freshwater. Biol. , 55 ( Suppl.1 ) : 43 – 59 .
- Trochine , C , Guerrieri , M , Liboriussen , L , Meerhoff , M , Lauridsen , T L , Søndergaard , M and Jeppesen , E . 2011 . Filamentous green algae inhibit phytoplankton with enhanced effects when lakes get warmer . Freshwater Biol , 56 : 541 – 553 .
- Turner , M A , Howell , E T , Robinson , G GC , Brewster , J F , Sigurdson , L J and Findlay , D L . 1995 . Growth characteristics of bloom-forming filamentous green algae in the littoral zone of an experimentally acidified lake . Can J Fish Aquat Sci. , 52 : 2251 – 2263 .
- Wagner , C and Adrian , R . 2009 . Cyanobacteria dominance: Quantifying the effects of climate change . Limnol Oceanogr , 54 : 2460 – 2468 .
- Watson , SB. 2004 . Aquatic taste and odor: a primary signal of drinking water integrity . J Toxicol Env Heal A. , 67 : 1779 – 1795 .
- Watson , S B , McCauley , E and Downing , J A . 1997 . Patterns in phytoplankton taxonomic composition across temperate lakes of differing nutrient status . Limnol Oceanogr. , 42 : 487 – 495 .
- Watson , S B , Ridal , J and Boyer , G L . 2008 . Taste and odour and cyanobacterial toxins: impairment, prediction and management in the Great Lakes . Can J Fish Aquat Sci. , 65 : 1779 – 1796 .
- Watson , S B , Satchwill , T and McCauley , E . 2001 . Drinking water taste and odour: a chrysophyte perspective . Nova Hedwigia. , 122 ( Beiheft ) : 199 – 146 .
- Vanderploeg , H A , Liebig , J R , Carmichael , W W , Agy , M A , Johengen , T H , Fahnensteil , G L and Nalepa , T F . 2001 . Zebra mussel (Dreissena polymorpha) selective filtration promoted toxic Microcystis blooms in Saginaw Bay (Lake Huron) and Lake Erie. . Can J Fish Aquat Sci. , 58 : 1208 – 1221 .
- Yu , Y-S , Zou , S and Whittemore , D . 1993 . Non-parametric trend analysis of water quality data of rivers in Kansas . J Hydrol. , 150 : 61 – 80 .
- Yue , S , Pilon , P and Cavadias , G . 2002 . The power of the Mann-Kendall and Spearman's rho tests for detecting monotonic trends in hydrological series . J Hydrol. , 259 : 254 – 271 .