
Abstract
Objective
The purpose of this study was to investigate the association between sugar and NNS consumption with body fat percentage in young adults.
Methods
524 college students were asked to complete the Web-based National Institutes of Health (NIH) Diet History Questionnaire II and had their body fat percentage measured using a bioelectrical impedance analysis scale.
Result
One-fourth of the participants were classified as overfat/obese and of those overfat or obese, 49% of them were African American. Overfat/obese participants consumed significantly more sugar than the heathy group and the underfat group (p < 0.001). Saccharin consumption was significantly higher in the overfat/obese group compare to the underfat and normal groups (p < 0.001). The odds of becoming overfat/obese increased 1.2 times for excessive total sugar consumption (95% CI: 1.0-1.8, p < 0.05).
Conclusion
Excessive sugar and saccharin consumption were associated with higher body fat percentage in young adults.
Introduction
Obesity is a serious public health issue and affects adults and children across all races and ethnicities.Citation1 Mississippi specifically has the second highest adult obesity rate in the nation, and the highest obesity rate for youth 10–17 years of age.Citation2 Obesity is a risk factor that can contribute to the development of diabetes, cardiovascular disease, and cancers. Excessive energy intake and lack of physical activity are common causes of obesity, in addition to various genetic and environmental factors.Citation3,Citation4
The American Heart Association has stated that excessive sugar consumption can lead to obesity and cardiovascular disease and recommends that added sugar intake not exceed 100 calories, or six teaspoons per day, for females and 150 calories, or nine teaspoons per day, for males.Citation5 The 2015–2020 Dietary Guidelines for Americans suggests limiting added sugar intake to less than 10% of total calories per day.Citation6 The World Health Organization (WHO) also recommends limiting added sugars to 10% of total caloric intake to reduce the risk of unhealthy weight gain and prevent obesity-related diseases.Citation7 From National Health and Nutrition Examination Survey (NHANES) 2005–2010 data, Yang et al. reported that added sugar intake was higher in adults who were younger than 60 years, non-Hispanic blacks, and never smokers.Citation8 Most non-Hispanic blacks consumed 10% or more of calories from added sugar (81.9%), and 16.9% consumed 25% or more of calories from added sugar. Seventy-one percent of non-Hispanic whites consumed 10% or more of calories from added sugar, and 9.1% consumed 25% or more.Citation8 NHANES 2013-2014 data revealed that Americans consumed around 14% of their daily energy intake from added sugars, and only 39% of adults aged 20–49 years consumed less than 10% of their daily energy intake from added sugars.Citation9,Citation10 Previous research also found that higher added sugar consumption was associated with a comparable increase in weight, metabolic syndrome, and risk of cardiovascular disease.Citation8,Citation11,Citation12 Moreover, an added sugar intake greater than WHO recommendation was associated with a lower intake of micronutrients, fiber, protein, and alcohol.Citation13 The largest sources of added sugars in the United States are sugar-sweetened beverages, grain-based desserts, and dairy-based desserts.Citation14
Non-nutritive sweeteners (NNS) have been increasingly used as a sugar substitute. From 2007–2008, consumption of NNS increased from 18.7% to 24.1%, while consumption of added sugars decreased from 18.1% of daily energy intake to 14.6% of daily energy intake.Citation15,Citation16 NNS are sweeteners that provide minimal or no energy. The Food and Drug Administration recognizes them as food additives and seven NNS are approved for use in the United States. They include acesulfame K, aspartame, luo han guo fruit extract, neotame, saccharin, stevia, and sucralose.Citation17 In addition, in some clinical practice guidelines, NNS have been recommended as substitutes for sugar-sweetened food and beverages in order to help reduce added sugar and energy intake and also induce satiety.Citation18,Citation19 There was a study revealed that NNS may induce satiety.Citation19 From 1999 to 2000, children and adolescent’s consumption of NNS increased by approximately 200%.Citation20 Although NNS provide little to no energy, several studies have shown that NNS may increase the risk of type 2 diabetes and obesity.Citation21,Citation22 Therefore, this study aimed to test the hypothesis that high sugar and NNS consumption relates to obesity risk in young adults.
Material and methods
Study design
This study is part of the ongoing research project: “BODY AP: Biological factors for Obesity Development in Young Adults Project”. The BODY AP study is exploring the association between biological, environmental and socioeconomical factors with body composition among young adults. This current study is a cross-sectional study investigating measures of sugar and NNS intake associated with body fat percentage in college students. Participants were required to make one visit to a lab on the university campus to participate. During the visit participants completed the Web-based NIH Diet History Questionnaire II (DHQ II) and had their body composition measured with a bioelectrical impedance analysis scale. This study was approved by the Institutional Review Board (IRB) (IRB-17-025) and all procedures followed were in accordance with the ethical standards of the IRB and the Helsinki Declaration of 1975, as revised in 2000. All participants provided informed consent prior to participation.
Participants
Inclusion and exclusion criteria for participation in this study included being 18 years of age or older, not pregnant or breastfeeding, having the ability to read and write and understand the consent form in English, and willingness to complete all parts of the study. A total of 710 participants, 18–31 years old, from a public university in Mississippi were enrolled in this study. After removing outliers and missing data, the final sample included in the data analysis consisted of 524 participants including 91 males (17.4%) and 433 females (82.6%).
Body composition measurements
A Bioelectrical Impedance Analysis (BIA) scale (Model TBF-300A; TANITA) was used to measure body composition following manufacturer procedure. Height was measured with a calibrated stadiometer (Model SONARIS Touchless). The BIA output included body fat in pounds (lbs) and body fat in percent (BF%) of total body weight. Participants were placed into one of three body composition categories based on their sex and body fat percentage. The body composition categories used are based on published ranges for standard adults ages 20–39 years and are: underfat (BF%< 20% in females, <10% in males), healthy (BF% 20%-34% in females, 10%-21% in males), and overfat/obese (BF%>34% in females, BF%>21% in males).Citation23
Dietary intake assessment
The Web-based DHQ II is a semi-quantitative food frequency questionnaire that includes 134 food items and assesses dietary intake over the past year. The DHQ II responses were analyzed with the corresponding Diet*Calc software to obtain average daily intakes of dietary items (National Cancer Institute, Bethesda, USA).
Data analysis
Initial analyses examined the distribution of all variables and identified outliers for exclusion. Participants reporting energy intakes below the 5th and above 95th percentiles of daily energy intake from The National Health and Nutrition Examination Survey were excluded from analysis. Additionally, participants reporting sugar intakes that were more than 1.5 interquartile ranges above the third quartile or below the first quartile for reported sugar intake were also excluded from the final data analysis. Basic descriptive statistics are expressed as means plus or minus standard deviations, and frequencies (). Dietary intake data are presented as medians and interquartile ranges due to their skewed distribution (). Skewed data were log transformed prior to analysis with parametric tests. Dietary intake by body fat category was analyzed using one-way analysis of variance (ANOVA) tests and dietary intake by self-identified race was analyzed using independent t-tests (). To investigate the interaction effect between dietary fiber intake and sugar intake on BF%, a two-way ANOVA was used. Logistic regression models were used to estimate the relationship between sugar intake, dietary fiber intake, and NNS with obesity status by examining odds ratios (OR), the corresponding 95% confidence intervals, and p-values (). The three body fat categories used previously were arranged into two groups for logistic regression analysis, non-obese and obese, by considering underfat and healthy as non-obese, and overfat/obese as obese. All data were analyzed using Statistical Package for Social Sciences (SPSS) version 24.0 software (SPSS Inc., Chicago, Illinois, USA). The criterion for significance was set at p < 0.05.
Table 1 General characteristics of participants (n = 524).
Table 2 Dietary intake per day by body fat percentage category.
Table 3 Dietary intake per day by self-reported race.
Table 4 Sugar intake, dietary fiber intake, and glycemic load in relation to overfat/obese status.
Results
The final analysis after removal of outliers included 524 college students with an average age of 20.1 ± 1.9 years (). According to the body fat percentage categories for adults published by Gallagher et al., 24.4% of participants had a body fat percentage above the “healthy” category range of 10–21% in males and 20–34% in females.Citation23 The average body fat percentage for females was 28.2 ± 9.1% and the average body fat percentage for males was 18.5 ± 8.0%. Participants’ self-identified races were 80.2% Caucasian (n = 420) and 19.8% African American (n = 104).
As shown in , there was no significant difference in total energy, carbohydrate, dietary fiber, soluble dietary fiber, and insoluble dietary fiber intake across the three body fat categories. However, the overfat/obese group consumed a significantly greater percentage of their daily energy intake from carbohydrates and had a higher glycemic load compared to the healthy group (50.8, 10.9% vs 47.2, 9.6%, F2,251 = 6.968, p < 0.001 and 113.1, 86.6% vs 102.6, 76.4%, F2,251 = 3.564, p < 0.05, respectively). In addition, overfat/obese participants consumed significantly more total sugar (F2,251 = 7.156, p < 0.001), added sugar (F2,251 = 7.742, p < 0.001), fructose (F2,251 = 8.243, p < 0.001), glucose (F2,251 = 9.249, p < 0.001), sucrose (F2,251 = 3.592, p = 0.028), and had a higher percentage of energy intake from total sugar (F2,251 = 11.779, p < 0.001) and added sugar (F2,251 = 10.198, p < 0.001) than the heathy group and the underfat group. The analysis of NNS consumption revealed that only saccharin consumption was significantly different between healthy group and overfat/obese groups (p < 0.05) with the obese group consuming more saccharin than others.
Dietary intake per day according to self-reported race is presented in . African American participants had a significantly greater mean daily energy intake compared to participants of Caucasian race (t522 = −1.990, p = 0.047), whereas Caucasian participants consumed significantly more total dietary fiber (t522 = 2.230, p = 0.026) and insoluble dietary fiber (t522 = 2.104, p = 0.036). Moreover, African American participants consumed significantly more carbohydrates (t522 = −4.014, p < 0.001), total sugar (t522 = −5.800, p < 0.001), added sugar (t522 = −5.786, p < 0.001), fructose (t522 = −6.459, p < 0.001), glucose (t522 = −6.752, p < 0.001), sucrose (t522 = −4.366, p < 0.001), aspartame (t522 = 5.656, p < 0.001), sucralose (t522 = 2.639, p = 0.009), and had a higher glycemic load compared to Caucasian participants (t522 = −4.882, p < 0.001). African American participants also reported consuming a greater percentage of daily energy intake from total sugar (t522 = −8.058, p < 0.001) and added sugar (t522 = −6.575, p < 0.001).
The logistic regression results for dietary intake and obesity status are presented in . There was a significant association between obesity and total dietary fiber and sugar intakes. The results indicated that increased consumption of dietary fiber decreased the likelihood of overfat/obesity (OR = 0.96, 95% CI: 0.94–1.00, p < 0.05). Additionally, participants with an excessive total sugar intake were 1.2 times more likely to have overfat/obesity (OR = 1.2, 95% CI: 1.0–1.8, p < 0.05). No significant association was found between overfat/obese status and NNS intake when logistic regression was applied.
Discussion
In this study of 524 college students, 18–31 years of age, one fourth of participants were overfat/obese. Almost half of African American students were overfat/obese (49.0%) which was a much greater proportion compared to Caucasian students where 18.3% were overfat/obese. Data from the National Health and Nutrition Examination Survey (NHANES) reported that the prevalence of obesity by BMI in 2015–2016 among U.S. adults was 39.8%. Our data suggest that the obesity rate is even higher when more specific measures are used as is percentage of body fat used in this study. Many studies have observed a higher prevalence of obesity in African American adults as measured by BMI; however, this study used BIA to estimate fat tissue so that participants could be more accurately classified into weight categories by their body fat percentage. Previous studies have suggested that obesity rates are higher in African American populations due to both genetic and environmental factors including lifestyle, socioeconomic status (SES), and education.Citation24,Citation25
In this study, African American students reported consuming significantly more total sugar and added sugar than Caucasian students. These findings are in agreement with results obtained from 2005 NHIS survey data which found that African Americans had the highest intake of added sugars in comparison to other races, and that added sugar consumption was inversely related to education level.Citation26 Moreover, we found that the average added sugar intake in Caucasian and African American students (50.4, 51.6 g/day) was higher than published recommendations for daily added sugar intake. The World Health Organization recommends that added sugars account for less than 10% of daily energy intake;Citation27 however, the college students enrolled in this study consumed approximately 12.3% of their daily energy intake from added sugar. NHANES 2013–2014 data revealed that Americans consumed around 14% of their daily energy intake from added sugars which is a 2–4% decrease from added sugars intake reported in NHANES 2003–2004.Citation10
Overconsumption of sugar can displace essential nutrients in the diet and can have negative health effects. Moshtaghian et al. conducted a cross-sectional study of 879 older adults in Australia and found that an added sugar intake greater than 10% of daily energy intake was associated with a lower intake of micronutrients, fiber, protein, and alcohol.Citation13 The interaction effect found in this study between added sugar and dietary fiber intake by mean BF% also agreed with Moshtaghian’s study. Here, college students who consumed greater than 10% of their caloric intake from added sugar and had a dietary fiber intake of less than 25 g/day had a higher BF% compared to students who followed the 2015–2020 Dietary Guidelines for Americans recommendations for added sugar and dietary fiber intake.
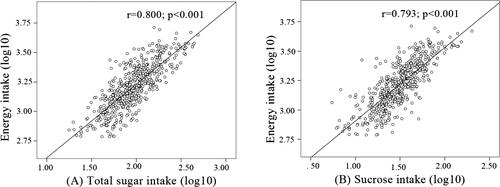
The results of this study also suggest that college students who are overfat/obese may consume more total sugar, added sugar, fructose, glucose, and sucrose than underfat and normal weight students (). Energy intake and total carbohydrate intake were not significantly different across body fat categories which may be a result of underreporting of dietary intake by the overfat and obese groups. Rennie et al. found that in dietary surveys using self-reported methods, underreporting of dietary intake was increased in overweight and obese groups when compared to the lean group.Citation28 A review article on intake of table sugar and other sweeteners stated that limiting sugar intake to less than 10% of daily energy intake may reduce total energy intake by 5%.Citation29 We also found a positive correlation between energy intake and consumption of sugars, particularly in sucrose consumption, with a higher sucrose intake correlating with an increase in total caloric intake (r = 0.79, p < 0.001) (). Sucrose, or table sugar, is a disaccharide composed of fructose and glucose. The animal study of Lindqvist et al. suggested that fructose has a different metabolic pathway than glucose which may affect levels of appetite-regulating hormones including insulin and ghrelin and lead to increased appetite and excessive caloric intake.Citation30
Figure 1 The correlation between energy intake and total sugar (A) and sucrose intake (B) over the past year among young adults.
The results for NNS intake indicated that participants in the overfat/obese group consumed significantly more saccharin than the other groups (p < 0.05). The total saccharin intake of participants in this study was 25.4, 14.1 mg/day which was not over the guideline for the Acceptable Daily Intake (ADI) of 15 mg per kilogram of bodyweight. Saccharin is the oldest NNS and 200 to 700 times sweeter than sucrose. It is commonly added to soft drinks, candy, salad dressings, and chewing gum.Citation31 It has been suggested that NNS including saccharin induce satiety in a different way that sugar does and alters the post-ingestion pathway.Citation19 When an individual consumes a NNS, the oral taste receptors are activated; however, the NNS fails to activate the post-ingestion pathway due to the lack of caloric energy which leads to increased food cravings and greater caloric consumption.Citation31 This supports our results which found African Americans who were overfat/obese consumed significantly more aspartame and sucralose than the other groups (p < 0.001 and p < 0.05 respectively). In addition, African American students also had a higher prevalence of obesity than Caucasian students.
The logistic regression results in this study show that the odds of becoming overfat/obese increase 1.2 times if having additional total sugar consumption (95% CI: 1.05–1.80, p < 0.05). This result is in line with findings from a systematic review on dietary sugars and body weight which reported that having an increased intake of dietary sugars was associated with a 0.75 kg increase in body weight (95% CI: 0.30–1.19, p < 0.001) .Citation11 A two way-ANOVA was carried out to look at the effect of carbohydrate and glycemic load on body fat status; however, no significant association was found between body fat status, carbohydrate intake, and glycemic load. A prospective cohort study looking at the association between glycemic index, glycemic load, and body composition found no significant association between glycemic load and body composition in either sex, but found that a higher glycemic index diet was associated with increases in body fat for women.Citation32 Altogether, these findings suggest that perhaps carbohydrate quality may be closer related to body fat percentage than carbohydrate quantity.
Limitations
Although we found an association between dietary intake and body fatness in this study, there were only a limited number of participants in subgroups of self-identified race. The lack of information on confounding variables such as smoking status and physical activity is also a limitation of this study. Including other races and confounding variables may increase the impact of these results.
Conclusions
This study found an association between fiber, sugar, and NNS intake with body fatness in young adults. Young adults who were classified as overfat/obese by body fat percentage consumed less dietary fiber and more sugar and saccharin than their healthy weight counterparts. Obesity prevention and treatment interventions in young adults should not only consider dietary quantity or calories but also the quality of dietary intake.
Conflict of interest disclosure
The authors have no conflicts of interest to report. The authors confirm that the research presented in this article met the ethical guidelines, including adherence to the legal requirements, of theUnited States of America and received approval from the Institutional Review Board of Mississippi State University.
Additional information
Funding
References
- Hales CM, Carroll MD, Fryar CD, Ogden CL. Prevalence of Obesity among Adults and Youth: United States, 2015–2016. NCHS data brief, no 288. Hyattsville, MD: National Center for Health Statistics:2015–2016. doi:10.1017/S1368980017000088.
- The State of Obesity in Mississippi. Robert Wood Johnson Foundation. https://stateofobesity.org/states/ms/. Published 2018. Accessed February 20, 2019.
- Barsh GS, Farooqi IS, O’Rahilly S. Genetics of body-weight regulation. Nature 2000;404(6778):644–651. doi:10.1038/35007519.
- Martínez-González MÁ, Alfredo Martínez J, Hu FB, Gibney MJ, Kearney J. Physical inactivity, sedentary lifestyle and obesity in the European Union. Int J Obes. 1999;23(11):1192–1201. doi:10.1038/sj.ijo.0801049.
- Johnson RK, Appel LJ, Brands M, et al . Dietary sugars intake and cardiovascular health: a scientific statement from the American Heart Association. Circulation 2009;120(11):1011–1020.,. doi:10.1161/CIRCULATIONAHA.109.192627.
- U.S. Department of Health and Human Services and U.S. Department of Agriculture. 2015–2020 Dietary Guidelines for Americans. http://health.gov/dietaryguidelines/2015/. Published 2015. Accessed February 26, 2019.
- World Health Organization. Guideline: sugars intake for adults and children. WHO; 2015:1–48.
- Yang Q, Zhang Z, Gregg EW, Flanders WD, Merritt R, Hu FB. Added sugar intake and cardiovascular diseases mortality among us adults. JAMA Intern Med. 2014;174(4):516–524. doi:10.1001/jamainternmed.2013.13563.
- Bowman SA, Clemens JC, Martin CL, Anand J, Steinfeldt LC, Moshfegh AJ. Highlights Added Sugars Intake of Americans: what we eat in America, NHANES 2013–2014 what percent of Americans meet the DGA added sugars recommendation? Food Surveys Research Group. Dietary Data Brief; (18); 2017. www.ars.usda.gov/nea/bhnrc/fsrg
- Bowman SA, Clemens JC, Friday JE, Lynch KL, LaComb RP, Moshfegh AJ. Food Patterns Equivalents Intakes by Americans: what we eat in America, NHANES 2003–2004 and 2013–2014. USDA Food Surv Res Group Diet Data Br 2017;04(17):1–8.
- Te Morenga L, Mallard S, Mann J. Dietary sugars and body weight: systematic review and meta-analyses of randomised controlled trials and cohort studies. BMJ Br Med J. 2012;346(3):e7492. doi:10.1136/bmj.e7492.
- Rodríguez LA, Madsen KA, Cotterman C, Lustig RH. Added sugar intake and metabolic syndrome in US adolescents: Cross-sectional analysis of the National Health and Nutrition Examination Survey 2005–2012. Public Health Nutr. 2016;19(13):2424–2434. doi:10.1017/S1368980016000057.
- Moshtaghian H, Louie JCY, Charlton KE, et al. Added sugar intake that exceeds current recommendations is associated with nutrient dilution in older Australians. Nutrition 2016;32(9):937–942. doi:10.1016/j.nut.2016.02.004.
- Rehm CD, Drewnowski A. Consumption of added sugars among US children and adults by food purchase location and food source. Am J Clin Nutr. 2014;100(3):901–907. doi:10.3945/ajcn.114.089458.
- Sylvetsky AC, Welsh JA, Brown RJ, Vos MB. Low-calorie sweetener consumption is increasing in the United States. Am J Clin Nutr. 2012;96(3):640–646. doi:10.3945/ajcn.112.034751.
- Welsh JA, Sharma AJ, Grellinger L, Vos MB. Consumption of added sugars is decreasing in the United States. Am J Clin Nutr. 2011;94(3):726–734. doi:10.1121/1.394252.
- Fitch C, Keim KS, Position of the academy of nutrition and dietetics: use of nutritive and nonnutritive sweeteners. J Acad Nutr Diet. 2012;112(5):739–758. doi:10.1016/j.jand.2012.03.009.
- Gardner C, Wylie-Rosett J, Gidding SS, et al. Nonnutritive sweeteners: current use and health perspectives: a scientific statement from the American Heart Association and the American Diabetes Association. Circulation 2012;126(4):509–519. doi:10.1161/CIR.0b013e31825c42ee.
- Swithers SE. Not so sweet revenge: unanticipated consequences of high-intensity sweeteners. Behav Anal. 2015;38(1):1–17. doi:10.1007/s40614-015-0028-3.
- Sylvetsky AC, Jin Y, Clark EJ, Welsh JA, Rother KI, Talegawkar SA. Consumption of low-calorie sweeteners among children and adults in the United States. J Acad Nutr Diet. 2017;117(3):441–448.e2. doi:10.1016/j.jand.2016.11.004.
- Bray GA, Popkin BM. Dietary sugar and body weight: Have we reached a crisis in the epidemic of obesity and diabetes?: Health be damned! Pour on the sugar. Diabetes Care. 2014;37(4):950–956. doi:10.2337/dc13-2085.
- Imad J, Wehbe T, Jaoude EA. A comparative study of three non-nutritive sweeteners effects on insulin and glucose in healthy, non-diabetic adults. Insights Nutr Metab 2017;1(2):73–79.
- Gallagher D, Heymsfield SB, Heo M, et al. Healthy percentage body fat ranges an approach for developing guideline based on BMI. Am J Clin Nutr. 2000;72(3):694–701. doi:10.1093/ajcn/72.3.694.
- Cossrow N, Falkner B. Race/ethnic issues in obesity and obesity-related comorbidities. J Clin Endocrinol Metab. 2004;89(6):2590–2594. doi:10.1210/jc.2004-0339.
- Kumanyika SK, Whitt-Glover MC, Gary TL, et al. Expanding the obesity research paradigm to reach African American communities. Prev Chronic Dis. 2007;4(4):A112–A112. https://www.ncbi.nlm.nih.gov/pubmed/17875256
- Thompson FE, McNeel TS, Dowling EC, Midthune D, Morrissette M, Zeruto CA. Interrelationships of added sugars intake, socioeconomic status, and race/ethnicity in adults in the United States: National Health Interview Survey, 2005. J Am Diet Assoc. 2009;109(8):1376–1383. doi:10.1016/j.jada.2009.05.002.
- Thow AM, Hawkes C. Global sugar guidelines: an opportunity to strengthen nutrition policy. Public Health Nutr. 2014;17(10):2151–2155. doi:10.1017/S1368980014001840.
- Rennie KL, Coward A, Jebb SA. Estimating under-reporting of energy intake in dietary surveys using an individualised method. Br J Nutr. 2007;97(6):1169–1176. doi:10.1017/S0007114507433086.
- Mooradian AD, Smith M, Tokuda M. The role of artificial and natural sweeteners in reducing the consumption of table sugar: a narrative review. Clin Nutr Espen. 2017;18:1–8. doi:10.1016/j.clnesp.2017.01.004.
- Lindqvist A, Baelemans A, Erlanson-Albertsson C. Effects of sucrose, glucose and fructose on peripheral and central appetite signals. Regul Pept. 2008;150(1–3):26–32. doi:10.1016/j.regpep.2008.06.008.
- Pearlman M, Obert J, Casey L. The association between artificial sweeteners and obesity. Curr Gastroenterol Rep. 2017;19(12):1–8. doi:10.1007/s11894-017-0602-9.
- Hare-Bruun H, Flint A, Heitmann BL. Glycemic index and glycemic load in relation to changes in body weight, body fat distribution, and body composition in adult Danes. Am J Clin Nutr. 2006;84(4):871–879. doi:84/4/871 [pii] doi:10.1093/ajcn/84.4.871.