
Abstract
Introduction: The risk of mortality from cardiovascular disease (CVD) is higher in wintertime throughout the world, but it is not known if this reflects annual changes in diet or lifestyle, or an endogenous photoperiodic mechanism that is sensitive to changes in day length.
Methods: Phenotypic data on cardiometabolic and lifestyle factors were collected throughout a 4 year time period from 502,642 middle-aged participants in UK Biobank. To assess the impact of seasonal environmental changes on cardiovascular risk factors, we linked these data to the outdoor temperature and day length at the time of assessment. Self-reported information on physical activity, diet and disease status were used to adjust for confounding factors related to health and lifestyle.
Results: Mortality related to CVD was higher in winter, as were risk factors for this condition including blood pressure, markers of inflammation and body mass index (BMI). These seasonal rhythms were significantly related to day length after adjustment for other factors that might affect seasonality including physical activity, diet and outdoor temperature.
Conclusions: The risk of CVD may be modulated by day length at temperate latitudes, and the implications of seasonality should be considered in all studies of human cardiometabolic health.
In this cross-sectional study in UK Biobank, we report annual variations in cardiovascular risk factors and mortality that were associated with day length independent of environmental and lifestyle factors.
These seasonal changes in day length might contribute to annual patterns in cardiovascular disease and mortality.
Key messages
Introduction
Seasonality of human disease is a prominent feature underpinning the epidemiology of many infectious [Citation1]; cardiovascular and/or cerebrovascular [Citation2–8]; inflammatory [Citation9]; and neuropsychiatric diseases [Citation10]. For example, the prevalence and severity of rhinovirus infection is greatly increased in autumn and winter, independent of the outdoor temperature [Citation1,Citation11]. The risks of experiencing an acute cardiovascular event, and of dying as a consequence, are also increased in winter [Citation12]. By contrast, relapses of multiple sclerosis are more frequent in summer, and directly correlate with plasma levels of melatonin, the pineal hormone that regulates seasonality [Citation9]. Seasonal rhythms in mood are widely reported, particularly at far northern latitudes, with short day lengths in winter associated with depressed mood and tiredness, often in conjunction with increased body weight [Citation10], all evidence that the human body is sensitive to annual changes in day length.
Seasonal patterns in disease are reciprocated by seasonality in many mechanisms fundamental to physiology, including gene transcription [Citation13,Citation14], immune function [Citation13,Citation15], metabolism [Citation16–21], and mood and neurobiological parameters [Citation22–24]. Although seasonality is a core feature of human health and disease, it is not known whether annual variations are driven by endogenous photoperiodic mechanisms that entrain to day length or are a direct consequence of seasonal patterns in lifestyle and environmental factors.
Human seasonality is poorly understood, but the factors that regulate seasonality have been rigorously investigated in animal models. These studies suggest that annual day length change is the single most important modulator of seasonal variation in physiology in classically photoperiodic species, such as hamsters, sheep and deer. In these animals, seasonality is an innate response mediated through neurobiological mechanisms that are sensitive to day length, principally involving upregulation of central thyroid-hormone signalling and neuroplasticity in response to light-regulated secretion of melatonin [Citation25]. These day length-dependent neurobiological and neuroendocrine changes are associated with profound annual variation in fertility, metabolism, behaviour and immune function [Citation26–29].
Intriguingly, the mechanisms that regulate photoperiodic responses in animals are retained in the human brain [Citation30,Citation31]; however, it is unclear how they regulate human physiology, or if they contribute to the annual variation that influences human susceptibility to disease.
CVD is the leading cause of death worldwide; excess deaths in winter increase its burden on global health and understanding the mechanisms underlying seasonal variations may help in identifying preventive interventions. The aim of this study was to use data from a UK population cohort study to investigate whether day length was associated with seasonal variations in CVD mortality and relevant intermediate phenotypes after adjusting for lifestyle and other environmental factors that vary by season.
Design and methods
Study sample and design
We analysed data from UK Biobank, a general population cohort study that recruited 502,642 participants continuously between 2006 and 2010, at 21 assessment centres located across the United Kingdom (Supplementary Table S1). Inclusion in the present study was restricted to participants who reported having no chronic disease at the time of recruitment, except for studies of mortality that included the entire database.
Outcomes
Body mass index (BMI), waist circumference, body fat percentage (assessed by bioelectric impedance), blood pressure, heart rate and white blood cell counts were measured by trained UK Biobank staff using standardized methods and instruments [Citation32]. Sleep duration was the self-reported number of hours sleep including naps in every 24 hours. Mortality from CVD was derived from national death certificate data that had already been linked to UK Biobank data (Supplementary Methods).
Cardiovascular disease risk factors
Potential confounders included as covariables were age; sex; ethnicity; Townsend area-deprivation score [Citation32]; physical activity and sedentary behavior; alcohol intake and smoking status; location of the UK Biobank assessment center and the time of day that blood pressure, heart rate were measured. Full details of how these parameters were derived are given in the Supplementary Methods. Diet was assessed using two methods; firstly, the number of portions of fruit and vegetables eaten per day was self-reported by the whole study cohort. This question referred to average consumption over the last 12 months. A more comprehensive analysis of diet was available for a subset of the cohort, consisting of a 24h dietary recall assessment, from which we derived the total food volume, energy and fat intake per day.
Environmental variables
The day length and outdoor temperature at the time and place of residence of each participant were measured using public weather databases (Supplementary Methods).
Statistical analyses
Histograms were used to inspect the distribution of the data, and appropriate transformations were applied to continuous variables that did not conform to the parameters of the normal distribution (eosinophil, basophil and monocyte percentages). Seasonal patterns were analyzed using multiple regression to fit a linearized cosinor model (details of this procedure are in Supplementary Methods) for each outcome of interest against the time variable, month (Supplementary Figure S1–15). Seasonality was indicated by (i) statistical significance of the estimated cosinor (sine and cosine) regression coefficients; (ii) improved fit following addition of the cosinor terms to the model, inferred by difference in Akaike information criterion (AIC) when the cosinor terms were added to multivariable regression model; and (iii) the likelihood ratio χ2 test statistic, defined as twice the difference in log likelihood of the multivariable model, with and without the cosinor terms. If seasonality was indicated, we next investigated if these patterns were linearly related to day length, independent of lifestyle and environmental factors. Three models were run that included an increasing number of covariables and progressively adjusted for sociodemographic, disease, lifestyle and environmental (temperature and day length) factors, with results reported as point estimates with standard errors. The numbers of participants recruited to UK Biobank was not identical at each month (Supplementary Table 1) and to exclude a confounding effect of such sample inequality, we re-analysed all significant outcome variables applying a weighting factor based on the inverse probability of participating in UK Biobank at each month. All analyses were performed using Stata 14 statistical software (StataCorp, College Station, TX) unless otherwise indicated, and statistical significance was accepted at values of p < .05.
Results
Participants
The sociodemographic, lifestyle and health characteristics of the 185,479 female and 143,858 male UK Biobank participants who met the inclusion criteria for this study are shown in Supplementary Table S3; equivalent to 66.5% and 66.1% of the total number of female and male participants, respectively. The cohort were predominantly White (95%), and aged between 55–64 years. Their average BMI was 26.4 ± 0.1 for women, and 27.3 ± 0.01 for men (mean ± sem). Weighting for the numbers of participants recruited to UK Biobank by month (Supplementary Table S1), had negligible effects on the statistical significance of the outcome variables in this analysis (Supplementary Table S4). The data were stratified by sex due to the differences in response to day length between men and women reported in previous studies of seasonality in UK Biobank [Citation33].
Dietary factors
Diet was assessed in the full dataset using self-reported consumption of fruit and vegetables, and this was found to be seasonal (; Supplementary Figure S8), with acrophase occurring in summer (July). The adjusted linear model of the relationship between this dietary parameter and day length indicated that such seasonality was independent of outdoor temperature among women but not men (). Seasonality of dietary intake was also assessed using a 24-hour dietary recall questionnaire completed by a subset of the participants in summer (June–August; n = 83,278) and winter (October–December; n = 103,805). As for the self-reported data on fruit and vegetable intake, the dietary recall questionnaire revealed that energy and fat intake and the total weight of food consumed were higher in summer compared to winter ().
Figure 1. Food intake was higher in summertime in UK Biobank participants. Dietary intake was higher in summer (Jun–Aug) compared to autumn and winter (Oct–Dec) in a subset of 54,228 participants who completed 24-h food recall during these months in 2011. The Data are given as the mean +95% confidence interval for (A) weight of food, (B) total energy intake and (C) total fat ingested per day. (D,E) Evidence of seasonal patterns of food intake was also evident in the dietary information that was available from the whole UK Biobank cohort (n = 503,655), with summertime peaks in the numbers of portions of fruit and vegetables eaten per day (D). Φ = Acrophase; ***p < .001.
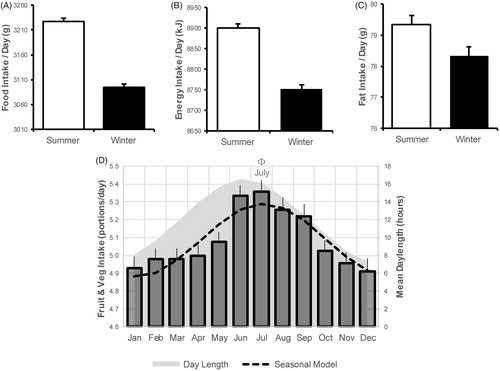
Table 1. Association between day length and cardiometabolic and lifestyle parameters.
Lifestyle factors
Seasonality was also evident in lifestyle factors, with more physical activity and less sedentary behavior in summer than winter (; Supplementary Figure S3). These parameters were independently associated with day length after adjustment for confounding factors (). Sleep duration was not seasonally patterned among women (likelihood ratio test, p > .05), whereas there was a statistically weak seasonal pattern among men, of slightly increased sleep duration in winter (likelihood ratio test, p = .01) (; Supplementary Figure S5). Accordingly, sleep duration was not directly related to day length after adjustment for temperature, neither in women nor in men ().
Table 2. Assessment of statistical significance of seasonality by comparison of linear models and cosinor parameters.
Cardiovascular risk factors
Blood pressure
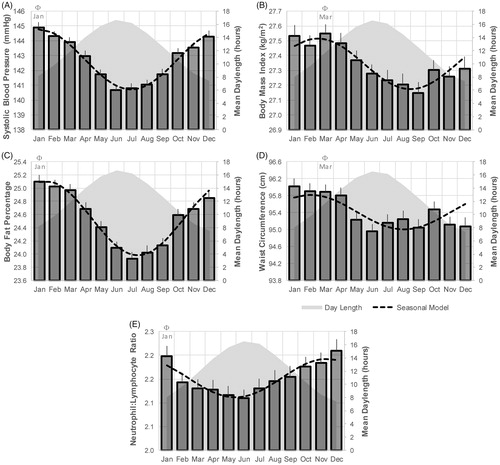
Seasonality was also evident in systolic and diastolic blood pressure (; Supplementary Figure S1), with acrophase in winter (December–January), and nadir in summer (June), coinciding with the winter and summer solstices, respectively. The amplitude of this seasonal effect amounted to 2.02 and 1.95 mmHg systolic blood pressure in men and women, respectively. These patterns were day length-dependent, independent of sex, physical activity, sedentary behaviour and outdoor temperature ().
Figure 2. Seasonal patterns in cardiometabolic parameters. Significant seasonal variation was detected in systolic blood pressure (A), body mass index (B), body fat percentage (C), waist circumference (D) and neutrophil-to-lymphocyte ratio (E) shown here for male participants who were free from chronic disease. Φ = Acrophase.
Body composition
Body composition also showed seasonality, with BMI, body fat percentage and waist circumference all higher in winter than in summer (); ). In contrast to the association with blood pressure, seasonality in BMI lagged behind the photoperiod change, in that acrophase and nadir were closely aligned with the equinoxes when daily hours of light and darkness are equal (). The seasonal acrophase for body composition occurred in February/March in men and women, while seasonal peaks in food intake occurred much later, in July/August (). The amplitude of the seasonal peaks in BMI amount to 0.17 and 0.12 kg/m2 for men and women respectively, and this equated to a mean seasonal difference of 0.99 kg body weight for men, and 0.79 kg for women. The seasonal changes in BMI peaked at the times of maximal changes in day length (equinox), while seasonal changes in food intake occurred when day length was most stable (solstice). The relationship between BMI and day length was statistically significant and independent of confounding factors ().
White blood cell counts
The total number of peripheral white blood cells, as well as the percentage of each cell type, is shown in Supplementary Table S3 and Supplementary Figure S9. Mean monthly data with fitted seasonal models for the percentage of lymphocytes, monocytes, neutrophils and eosinophils are shown in Supplementary Table S3. The neutrophil-to-lymphocyte ratio was taken as an overall index of inflammatory cells [Citation34]. This parameter showed strong seasonality (), with the acrophase occurring in winter (January) and the nadir in summer (June) among men. Other than monocytes in both sexes, and eosinophils in women, all white blood cell percentages were significantly related to day length in both men and women (). These associations were independent of confounding factors, including outdoor temperature.
Mortality
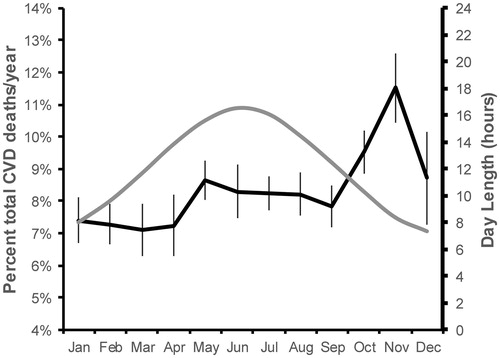
Of all 502,642 UK Biobank participants, 1,442 died from CVD over 9 years of follow-up (2006–2015) (). Monthly all-cause mortality was higher in the winter months. To assess the effects of seasonality on CVD mortality, monthly totals of deaths from CVD were expressed as percentage of total annual deaths, and the monthly mean percentage CVD death across the nine year follow-up was higher in the winter months ().
Figure 3. Seasonal patterns in CVD mortality. Seasonal variation was similarly evident in the number of CVD-related deaths, with the highest mortality in the winter.
Discussion
The present study found clear seasonal variations in CVD risk factors and mortality among a middle-aged population living at temperate latitude. The data are in agreement with reports of higher incidence of metabolic syndrome components (obesity, dysglycaemia and hypertension) in winter [Citation19,Citation35], which were directly and inversely related to the hours of sunlight and outdoor temperature [Citation4,Citation18,Citation19,Citation36]. The variations observed in the present study were directly related to day length, independent of outdoor temperature or seasonal lifestyle patterns. Our findings, therefore, support accumulating evidence that innate photoperiod-responsive seasonality in human physiology could contribute to annual variation in disease susceptibility [Citation13].
Our finding of higher CVD mortality in winter versus summer was in agreement with previous studies [Citation37,Citation38]. Elevated CVD mortality in winter occurs worldwide, even in countries with mild winter temperatures [Citation37,Citation39]; however, countries at the Equator that have constant annual photoperiods do not report such an increase [Citation37]. Temperature cannot completely account for this difference as the greatest effect is found at mid-latitudes around the Tropics; by contrast, far-Northern countries with low temperatures (e.g. Iceland and Russia) have low-amplitude seasonal variation in CVD mortality [Citation37] and gene expression [Citation13]. This suggests that other factors, such as photoperiod, may contribute to seasonality and could modulate human susceptibility to CVD.
We detected seasonal variation in white blood cells, with levels for most cell types higher in winter than in summer. Previous population-based studies have also reported wintertime increases in white blood cells and other inflammatory markers [Citation13,Citation15]. These relationships were retained, but inverted, in the southern hemisphere, suggesting that day length, rather than month, could underpin the effect [Citation13]. Our data confirm these findings in the largest sample size to date and show that seasonal variations in white blood cell count were independent of demographic and lifestyle factors. By excluding participants with chronic disease from our analysis of relationships with day length, we focused on homoeostatic mechanisms underlying immunity; therefore, it is unlikely that seasonality was driven by disease in this instance, and further studies are now warranted to see if these patterns are retained in disease.
Previous studies demonstrated that seasonality in immune function mirrored transcriptional patterns of proinflammatory genes [Citation13], and it is likely that photoperiodic modulation of immunity contributes to winter increases in the prevalence and severity of disease [Citation4,Citation13]. Of note, day length exerts potent effects on immune function among photoperiodic animals, independent of temperature or other environmental factors. In animals, seasonal changes in immunity optimize survival in challenging winter conditions by amplifying the numbers of immunosurveillant white blood cells in conjunction with suppression of innate immunity, including inflammation and behavioral signs of an acute phase response, such as anorexia and social withdrawal [Citation27,Citation40]. Remarkably, these changes are a direct response to day length, and can be reproduced by exposure to short day length in the laboratory [Citation27,Citation40]. Changes in immunity are not confined to overtly seasonal species and animals that are not classically photoperiodic, and that do not exhibit photoperiodic regulation of fertility, such as rats and C57BL/6J strains of laboratory mice, retain photoperiodic modulation of immune function [Citation27,Citation41]. Our data lend support to the concept that seasonal variation in human immunity might also be driven by innate mechanisms that synchronize with annual changes in photoperiod.
Components of the metabolic syndrome (hypertension, diabetes mellitus and obesity) vary according to the time of year, with disease most likely in winter [Citation20,Citation42]. Such annual variation was higher and associated with comorbid mood disorders, at northern latitudes where photoperiodic changes are profound [Citation10]. To our knowledge, there has been just one long-term experimental study that measured seasonal changes in food intake and body weight in a study in the United States that reported increased food intake in autumn [Citation21]. In contrast, in the present study, food intake tended to increase earlier, peaking in the summer months. The participants in the US study [Citation21] were younger (mean 31 years) and thinner (23.4 kg/m2), and lived in less variable annual photoperiods of lower latitudes, all of which might contribute to the discrepancy in seasonal peaks of food intake with the present study.
Seasonal changes in BMI closely tracked the times of year when day length deviated from equivalent hours of light and dark (equinoxes) when the rate of change of day length is maximal, which further supports regulation by a mechanism that is entrained by annual photoperiodic change. The magnitude of the seasonal effect on BMI has potential clinical significance; we found a 0.99 kg increase in body weight between September and March among men, whereas previous studies reported a 0.5-kg seasonal increase among obese individuals [Citation16] and a 0.48 kg increase among the general population [Citation17]. Seasonal changes in body composition were of higher amplitude and more closely related to day length among women than men in the present study. Women could exhibit increased sensitivity to photoperiodic modulation of metabolism, as evidenced by increased seasonality in females previously reported for mood disorders [Citation24]. Winter festivals were not thought to contribute to annual changes in BMI in previous studies, as the rate of weight gain began to increase before festival season [Citation17,Citation35]. Similarly, the trend for increasing BMI as day length decreased preceded the timing of Christmas and New Year holidays in the United Kingdom among the present cohort. Photoperiod can regulate food intake and body composition in animals [Citation43], and the same mechanisms might underlie the relationship between day length and BMI found in our study.
Sleep duration was not strongly seasonal in the present study and was weakly related to day length among men only. This finding is in agreement with reports of minimal effects of season on sleep in modern times when artificial light has removed restrictions on activities in the hour of darkness [Citation44]. Experimental studies that enforced natural seasonal photoperiods (i.e. 14-h darkness in winter) did report increased sleep duration during short photoperiods [Citation45]. Nonetheless, artificial light has confined exposure to such long periods of darkness to the research laboratory, and human sleep duration in seems minimally affected by day length.
The variance in cardiovascular risk factors that we report relates to the human seasonality at a population level and its implications for the individual requires further investigation. In addition to this, the magnitude of seasonal variation in cardiovascular risk factors was small, and the implications of such marginal changes for susceptibility to disease are unknown. It is a limitation that sleep and dietary information were self-reported and not-quantitative, and that seasonal data were collected over only a 4-year time period, and from a sample of middle-aged participants that do not represent the general UK population. The principal strength of this study is the large sample size, and the combination of health, demographic and environmental data at the time and place of assessment for each participant. To our knowledge, no previous study of human seasonality has linked seasonal and health data at such fine resolution, nor had the capacity to adjust for multiple lifestyle-related confounders in a large dataset.
Innate mechanisms that regulate seasonal physiology might have evolved to allow humans to accommodate the variable day lengths they encountered as they migrated northwards from their evolutionary birthplace under constant photoperiods of equatorial regions. Constant exposure to low-level indoor light in the urban environment could disrupt these mechanisms, and might favour the “winter” phenotype of increased blood pressure, inflammation, adiposity and BMI. Our findings of day length-dependent variation in CVD risk factors among a large cohort of urban participants suggests that evolutionary mechanisms are retained, and remain sensitive to annual photoperiodic changes despite the constant light and temperature of modern life. The implications for the seasonal dimension in human health and susceptibility to disease, including the role of exposure to artificial light and erratic lifestyles, must now be considered.
Correction Statement
This article has been republished with minor changes. These changes do not impact the academic content of the article.
Supplemental Material
Download MS Word (227.5 KB)Acknowledgments
This research was conducted using data from the UK Biobank. This resource was established by the Wellcome Trust, Medical Research Council, Department of Health, Scottish Government and the Northwest Regional Development Agency, with additional funding from the Welsh Assembly Government and the British Heart Foundation. All authors had full access to all the data and take responsibility for its integrity and the accuracy of the analysis.
Disclosure statement
The authors report no conflicts of interest.
Additional information
Funding
References
- Lee WM, Lemanske RF, Evans MD, et al. Human rhinovirus species and season of infection determine illness severity. Am J Respir Crit Care Med. 2012;186:886–891.
- Spencer FA, Goldberg RJ, Becker RC, et al. Seasonal distribution of acute myocardial infarction in the second National Registry of Myocardial Infarction. J Am Coll Cardiol. 1998;31:1226–1233.
- Patel NJ, Pant S, Deshmukh AJ, et al. Seasonal variation of acute myocardial infarction related hospitalizations in the United States: perspective over the last decade. Int J Cardiol. 2014;172:e441–e442.
- Ulmer H, Kelleher C, Diem G, et al. Estimation of seasonal variations in risk factor profiles and mortality from coronary heart disease. Wien Klin Wochenschr. 2004;116:662–668.
- Lichtman JH, Jones SB, Wang Y, et al. Seasonal variation in 30-day mortality after stroke: teaching versus nonteaching hospitals. Stroke. 2013;44:531–533.
- Sipilä JO, Ruuskanen JO, Kauko T, et al. Seasonality of stroke in Finland. Ann Med. 2017;49:310–318.
- Pell JP, Cobbe SM. Seasonal variations in coronary heart disease. QJM. 1999;92:689–696.
- Pell JP, Sirel J, Marsden AK, et al. Seasonal variations in out of hospital cardiopulmonary arrest. Heart. 1999;82:680–683.
- Farez MF, Mascanfroni ID, Méndez-Huergo SP, et al. Melatonin contributes to the seasonality of multiple sclerosis relapses. Cell. 2015;162:1338–1352.
- Rintamäki R, Grimaldi S, Englund A, et al. Seasonal changes in mood and behavior are linked to metabolic syndrome. PLoS One. 2008;3:e1482.
- Sundell N, Andersson LM, Brittain-Long R, et al. A four year seasonal survey of the relationship between outdoor climate and epidemiology of viral respiratory tract infections in a temperate climate. J Clin Virol. 2016;84:59–63.
- Reavey M, Saner H, Paccaud F, et al. Exploring the periodicity of cardiovascular events in Switzerland: variation in deaths and hospitalizations across seasons, day of the week and hour of the day. Int J Cardiol. 2013;168:2195–2200.
- Dopico XC, Evangelou M, Ferreira RC, et al. Widespread seasonal gene expression reveals annual differences in human immunity and physiology. Nat Commun. 2015;6:7000.
- Goldinger A, Shakhbazov K, Henders AK, et al. Seasonal effects on gene expression. PLoS One. 2015;10:e0126995.
- Liu B, Taioli E. Seasonal variations of complete blood count and inflammatory biomarkers in the US population - analysis of NHANES data. PLoS One. 2015;10:e0142382.
- Ma Y, Olendzki BC, Li W, et al. Seasonal variation in food intake, physical activity, and body weight in a predominantly overweight population. Eur J Clin Nutr. 2006;60:519–528.
- Yanovski JA, Yanovski SZ, Sovik KN, et al. A prospective study of holiday weight gain. N Engl J Med. 2000;342:861–867.
- Suarez L, Barrett-Connor E. Seasonal variation in fasting plasma glucose levels in man. Diabetologia. 1982;22:250–253.
- Hermann JM, Rosenbauer J, Dost A, et al. Seasonal variation in blood pressure in 162,135 patients with type 1 or type 2 diabetes mellitus. J Clin Hypertens. 2016;18:270–278.
- Hopstock LA, Barnett AG, Bønaa KH, et al. Seasonal variation in cardiovascular disease risk factors in a subarctic population: the Tromsø Study 1979-2008. J Epidemiol Community Health. 2013;67:113–118.
- de Castro JM. Seasonal rhythms of human nutrient intake and meal pattern. Physiol Behav. 1991;50:243–248.
- Meyer C, Muto V, Jaspar M, et al. Seasonality in human cognitive brain responses. Proc Natl Acad Sci USA. 2016;113:3066–3071.
- Eisenberg DP, Kohn PD, Baller EB, et al. Seasonal effects on human striatal presynaptic dopamine synthesis. J Neurosci. 2010;30:14691–14694.
- Harmatz MG, Well AD, Overtree CE, et al. Seasonal variation of depression and other moods: a longitudinal approach. J Biol Rhythms. 2000;15:344–350.
- Wood SH, Christian HC, Miedzinska K, et al. Binary switching of calendar cells in the pituitary defines the phase of the circannual cycle in mammals. Curr Biol. 2015;25:2651–2662.
- Ebling FJ. Hypothalamic control of seasonal changes in food intake and body weight. Front Neuroendocrinol. 2015;37:97–107.
- Prendergast BJ, Kampf-Lassin A, Yee JR, et al. Winter day lengths enhance T lymphocyte phenotypes, inhibit cytokine responses, and attenuate behavioral symptoms of infection in laboratory rats. Brain Behav Immun. 2007;21:1096–1108.
- Lehman MN, Ladha Z, Coolen LM, et al. Neuronal plasticity and seasonal reproduction in sheep. Eur J Neurosci. 2010;32:2152.
- Warner A, Jethwa PH, Wyse CA, et al. Effects of photoperiod on daily locomotor activity, energy expenditure, and feeding behavior in a seasonal mammal. Am J Physiol Regulat Integ Compara Physiol. 2010;298:R1409.
- Dardente H, Wyse CA, Birnie MJ, et al. A molecular switch for photoperiod responsiveness in mammals. Curr Biol. 2010;20:2193.
- Wehr TA, Moul DE, Barbato G, et al. Conservation of photoperiod-responsive mechanisms in humans. Am J Physiol. 1993;265:R846–R857.
- Large-scale UBPfa. 2007. resource pe. UK Biobank.
- Lyall LM, Wyse CA, Celis-Morales CA, et al. Seasonality of depressive symptoms in women but not in men: A cross-sectional study in the UK Biobank cohort. J Affect Disord. 2018;229:296–305.
- Shiny A, Bibin YS, Shanthirani CS, et al. Association of neutrophil-lymphocyte ratio with glucose intolerance: an indicator of systemic inflammation in patients with type 2 diabetes. Diabetes Technol Ther. 2014;16:524–530.
- Liang WW. Seasonal changes in preprandial glucose, A1C, and blood pressure in diabetic patients. Diabetes Care. 2007;30:2501–2502.
- Brennan PJ, Greenberg G, Miall WE, et al. Seasonal variation in arterial blood pressure. Br Med J (Clin Res Ed). 1982;285:919–923.
- Douglas S, Rawles J. Latitude-related changes in the amplitude of annual mortality rhythm. The biological equator in man. Chronobiol Int. 1999;16:199–212.
- Marti-Soler H, Gonseth S, Gubelmann C, et al. Seasonal variation of overall and cardiovascular mortality: a study in 19 countries from different geographic locations. PLoS One. 2014;9:e113500.
- Wang Y, Levi CR, Attia JR, et al. Seasonal variation in stroke in the Hunter Region, Australia: a 5-year hospital-based study, 1995-2000. Stroke. 2003;34:1144–1150.
- Prendergast BJ, Hotchkiss AK, Bilbo SD, et al. Photoperiodic adjustments in immune function protect Siberian hamsters from lethal endotoxemia. J Biol Rhythms. 2003;18:51–62.
- Yellon SM, Tran LT. Photoperiod, reproduction, and immunity in select strains of inbred mice. J Biol Rhythms. 2002;17:65–75.
- Kamezaki F, Sonoda S, Tomotsune Y, et al. Seasonal variation in metabolic syndrome prevalence. Hypertens Res. 2010;33:568–572.
- Bartness TJ, Wade GN. Photoperiodic control of seasonal body weight cycles in hamsters. Neurosci Biobehav Rev. 1985;9:599–612.
- Friborg O, Bjorvatn B, Amponsah B, et al. Associations between seasonal variations in day length (photoperiod), sleep timing, sleep quality and mood: a comparison between Ghana (5°) and Norway (69°). J Sleep Res. 2012;21:176–184.
- Wehr TA. Photoperiodism in humans and other primates: evidence and implications. J Biol Rhythms. 2001;16:348–364.