
Abstract
Objective
Investigation of the clinical potential of extensive phenotype data and machine learning (ML) in the prediction of mortality in acute coronary syndrome (ACS).
Methods
The value of ML and extensive clinical data was analyzed in a retrospective registry study of 9066 consecutive ACS patients (January 2007 to October 2017). Main outcome was six-month mortality. Prediction models were developed using two ML methods, logistic regression and extreme gradient boosting (xgboost). The models were fitted in training set of patients treated in 2007–2014 and 2017 (81%, n = 7344) and validated in a separate validation set of patients treated in 2015–2016 with full GRACE score data available for comparison of model accuracy (19%, n = 1722).
Results
Overall, six-month mortality was 7.3% (n = 660). Several variables were found to be significantly associated with six-month mortality by both ML methods. The xgboost scored the best performance: AUC 0.890 (0.864–0.916). The AUC values for logistic regression and GRACE score were 0.867(0.837–0.897) and 0.822 (0.785–0.859), respectively. The AUC value of xgboost was better when compared to logistic regression (p = .012) and GRACE score (p < .00001).
Conclusions
The use of extensive phenotype data and novel machine learning improves prediction of mortality in ACS over traditional GRACE score.
The collection of extensive cardiovascular phenotype data from electronic health records as well as from data recorded by physicians can be used highly effectively in prediction of mortality after acute coronary syndrome.
Supervised machine learning methods such as logistic regression and extreme gradient boosting using extensive phenotype data significantly outperform conventional risk assessment by the current golden standard GRACE score.
Integration of electronic health records and the use of supervised machine learning methods can be easily applied in a single centre level to model the risk of mortality.
KEY MESSAGES
Introduction
The use of electronic health records (EHRs) as a source of “big data” in cardiovascular research is attracting interest and investments [Citation1]. Integrating EHRs from multiple sources can potentially provide huge data sets for analysis. Another effective approach is to focus more on data quality instead of quantity. For example, the use of dense phenotypic data has been shown to be effective in classification of heart failure with preserved ejection fraction with very promising prognostic potential [Citation2].
An early example of the application of big data is the development of the GRACE score to predict mortality after acute coronary syndrome (ACS) by variables depicting patient status at admission [Citation3–5]. The score was developed by a collaboration of multiple centres internationally and with large overall size of the dataset but only moderate phenotype depth. Since its development, the GRACE score has been externally validated and shown to perform reliably [Citation6]. The challenges of developing risk scores through massive multicentre efforts (like GRACE) are the heavy costs related to a prospective standardized data collection and the quality of the data when using retrospective data from multiple centres with differing data collection protocols. The tradeoff between data quality and quantity is often clear [Citation1].
Despite the interest, application of true big data has not yet resulted in concrete changes to clinical work. In fact, even experimental work showing the possible value of big data is sparse [Citation7]. Although novel analysis methods applying machine learning with big data have already proven effective in some clinical settings in cardiovascular care [Citation2,Citation8,Citation9], the foremost problem is still the lack of access to high quality and quantity phenotype data. Preliminary evidence also suggests that big data can be effective in improving risk prediction of cardiovascular disease over a traditional risk assessment [Citation10].
The aim of the present study was to evaluate the applicability of large-scale data integration from multiple electronic sources to produce extensive and high quality cardiovascular (CVD) phenotype data for survival analysis and the possible benefit of using novel machine learning. For this purpose, we integrated clinical data recorded by treating physicians with other EHR data of all consecutive ACS patients diagnosed invasively by coronary angiography over a 10-year period (n = 9066) in a single specialized cardiac care provider of a catchment population of approximately 0.5 million inhabitants. The predictive value of this extensive CVD phenotype data was tested with two supervised machine learning techniques, logistic regression and gradient boosting. Gradient boosting is an ensemble learning approach that builds a stronger prediction model as an ensemble of multiple weaker models, thus improving the performance. We used xgboost, a regularized implementation of gradient boosting that is robust to over-fitting [Citation11]. The possible incremental value of successful data integration was tested by comparing the performance of extensive phenotype data-based analysis to the performance of a more conventional but well validated GRACE score.
Methods
Study cohort
MADDEC (Mass Data in Detection and Prevention of Serious Adverse Events in Cardiovascular Disease) is a retrospective registry study integrating data from multiple electronic sources of patients treated in single tertiary care centre (Tays Heart Hospital) functioning as a sole provider of specialized cardiac care for a population of 510,000 individuals (Hospital district of Pirkanmaa, Finland) [Citation12]. For this study, we evaluated 10,656 consecutive subjects undergoing coronary angiography for first episode of suspected ACS between January 2007 and October 2017. Patients who were diagnosed with some other condition than ACS at angiography (n = 1.168) or who had missing record of exact diagnosis were excluded from the analysis (n = 422). After these exclusions, there were 9066 cases available for analysis (96% of all ACS patients). Patients with ACS included: patients with unstable angina pectoris (UAP), patients with non-ST-elevation myocardial infarction (NSTEMI) and patients with ST-elevation myocardial infarction (STEMI) [Citation13,Citation14].
Data collection
The present study combines information of automatically accrued EHR data (including administrative, biometric, medical imaging and biomarker data and written patient records) and comprehensive clinical phenotype data collected online by treating physicians (KARDIO-registry). There recorded clinical phenotype data has been pre-selected before implementation of the data collection based on the expected clinical significance of the variables in predicting serious adverse events. The MADDEC – database comprises EHR data from the beginning of 1992. Clinical phenotype data collection was implemented in 2004 onwards and revised to be more comprehensive starting from January 2007, which was selected as the starting time for the present retrospective registry study.
Primary end-point data (mortality data) was received directly by continuous updates from Finnish mortality registry, which covers practically all deaths occurring in Finland or abroad (Statistics Finland). For the purpose of this study, the collection of mortality data ended to the date of last data extraction (15 April 2018). More details of the data collection are presented in Supplementary materials.
Data analysis
Candidate variables/phenotypes possibly predicting mortality were constructed a priori the data analysis to minimize bias due to variable construction. With the exception of laboratory values, only variables without missing values were included in the analysis. Laboratory values that were available in over 95% of cases were included in the analysis with missing values replaced by imputed values (multiple imputation by chained equations [Citation15]) with the exception of blood glucose and INR values that were imputed in for 19% and 14% of the cases. All laboratory values were transformed and centred to mean to ensure good model calibration and to facilitate interpretation of the results (mean value set to zero with value one denoting one standard deviation [SD] from mean). Transformation was performed using rank-based inverse normal transformation [Citation16].
The purpose of this study was two-fold: (i) To evaluate the performance of obtained extensive CVD phenotype data in general and (ii) to compare the predictive ability of logistic regression analysis and extreme gradient boosting with that of GRACE score using this a priori defined CVD phenotype data (Supplementary Table 1). For this, the data was split into separate training and validation sets. The models were the fitted on training data and tested in the validation set. Training set consisted of 7344 patients treated in years 2007–2014 and 2017 with full six-month mortality follow-up data (81% of the entire study population). Validation set consisted of 1771 patients treated in years 2015–2016 with full GRACE score data available for comparison (19% of the entire study population).
Analysis by logistic regression analysis
Initial screening of the most significant predictors for six-month mortality was performed by unadjusted logistic regression analysis. The threshold for statistical significance was determined by Bonferroni correction accounting for 103 independent tested hypotheses. Variables that associated with unadjusted p-value<.0005 in the entire study population were considered as candidates for multivariable analysis. All variables associating significantly with mortality after correction for multiple testing were selected for the final model applying both backward and forward selection algorithms (two-way selection) based on Akaike’s Information Criterion [Citation17] (stepAIC function with default parameters in R package MASS). Variables with high correlation coefficient (Pearson’s r2 > 0.5) were not entered simultaneously into the model. In such cases, only the variable with the highest McFaddens pseudoR2 value in univariate analysis was selected for consideration in multivariable models. The possibility of multicollinearity was estimated by calculation of variance inflation factor (VIF) values for each variable in the final model (none of the variables had a VIF-value > 1.5). Successful model calibration was verified with Hosmer-Lemenshow goodness-of-fit test (p > .05 for sufficient model calibration).
Analysis by extreme gradient boosting
Bayesian optimization (BO) with gaussian process was used to fine-tune hyperparameters for xgboost model. Preset bounds for hyperparameter search were: eta = 0.001–0.5, maximum depth = 2–10, minimum child weight = 4–10, subsample = 0.5–1, colsample by tree = 0.1–0.9. Initial randomly chosen points and iterations were set to 100 in the BO function. This hyperparameter optimization was made using five-fold cross validation with 500 rounds each. Lambda and alpha were set to 1 and 0, respectively. Early stopping was set to five rounds. Expected improvement was used in the acquisition function for BO and kappa and epsilon were set to 2 and 0, respectively.
After the hyperparameters were optimized eta = 0.1014, maximum depth = 6, minimum child weight = 8, subsample = 0.8862, colsample by tree = 0.7788 were used in the final xgboost training with 100 rounds. After 100 rounds, the test-error no longer decreased and the final test-error was 0.0650 and training-error was 0.0261 indicating some variance in the xgboost model.
Evaluation of model performance in the entire data set and comparison to GRACE score
The discriminative power (i.e. the model performance) of both analysis methods (logistic regression analysis and extreme gradient boosting) in validation was evaluated by the area under curve (AUC) values from receiving operating characteristics (ROC) curves for prediction of six-month mortality. Comparison of the resulting C-statistics (AUC values) was performed by applying DeLong’s method for paired samples. All analyses were performed R Statistics (version 3.4.0) and RStudio (version 1.1.383) with packages (mice, pROC, xgboost, survival, rBayesianOptimization, car, ResourceSelection and MASS) [Citation15,Citation16].
Results
Study population characteristics
Of the 9066 patients treated for first ACS, 35.8% of the population suffered a STEMI, 45.8% suffered NSTEMI and 18.4% were hospitalized for UAP. Baseline population characteristics are presented in . The mortality from hospital admission to the end of six-month follow-up was 7.3% (n = 660) with the majority of deaths occurring during the first month (67.0%). Mean age of the population was 68.1 years (SD 11.9), and the majority of patients were men (67.3%, n = 6.101). Most of the patients were treated by percutaneous coronary intervention (PCI) (65%). Coronary artery bypass grafting (CABG) (12%) and conservative treatment were less frequent options (23%). The majority (84.4%) of all STEMI patients were treated by primary PCI and only 15.6% by primary thrombolysis.
Table 1. Characteristics of patients undergoing coronary angiography for acute coronary syndrome between January 2007 and October 2017 in Tays Heart Hospital.
Variables associating significantly with six-month mortality
Several variables were found to be significantly associated with six-month mortality logistic regression () in the validation set. The most significant variables included age and laboratory values such as creatinine, haemoglobin and leucocyte concentrations. Many other clinically relevant (and previously identified risk factors) depicting patient status, disease severity and prevalent conditions were also seen to associate significantly with mortality in multivariable analysis (). Some of these variables are also overlapping with the components of the GRACE score (heart failure upon admission, creatinine levels, hemodynamic status upon arrival, cardiac arrest and age). The hazard ratios related to all variables in univariate analyses in the entire data set are presented in Supplementary Table 2. The variables identified by xgboost in the training set are presented in Supplementary Table 3.
Table 2. Significant factors associating with six-month mortality in multivariable analysis by logistic regression (p < .05) in the training set of the MADDEC study population.
Performance of the prediction models in validation and comparison to GRACE score
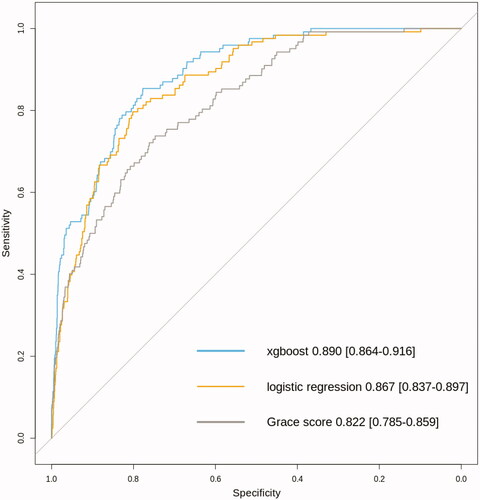
Using the models built in the training set, their performance was evaluated among patients in the validation set (n = 1722). The resulting AUC-value for logistic regression model was 0.867 (0.837–0.897) and 0.890 (0.864–0.916) for xgboost based model. The performance of the GRACE score was also good with AUC of 0.822 (0.785–0.859) (). Both logistic regression and xgboost performed significantly better as compared to GRACE score (p = .003 for logistic regression versus GRACE score and p = 1.4e−5 for xgboost versus GRACE score). Interestingly the performance of xgboost was also significantly better when compared to logistic regression modelling (p = .011) (). The results of sensitivity analyses with similar findings for very short time window of seven days or one-year for predicting mortality are presented in Supplementary Table 4.
Figure 1. Comparison of model performance by receiving operating characteristic curves for different risk prediction models for six month mortality among patients undergoing coronary angiography in Tays Heart Hospital for acute coronary syndrome during years 2015 and 2016 (n = 1.722 with n = 122 fatalities during a six-month follow-up).
As GRACE score was designed primarily for evaluating the risk of mortality among patients suffering UAP or type I myocardial infarction (primary cause being coronary artery disease), we also repeated the analysis among population after excluding subjects with type II MI (n = 146 for excluded subjects leaving n = 1756 for the analysis). As expected, the performance of the GRACE score improved slightly to an AUC of 0.834 (0.798–0.876). However, the logistic regression and xgboost outperformed GRACE significantly also within this subpopulation of patients with a logistic regression AUC 0.885 (0.855–0.916) (p = .0003 for comparison to GRACE score and xgboost AUC 0.904 (0.878–0.929) (p = 6.6e−5 for comparison to GRACE score).
In order to exclude the possibility of confounding by the preselected division into training and validation set by study year, we also repeated the analyses by using a random split of the entire study population into training (70%) and validation (30%) sets. The resulting AUC-values were 0.867 (0.831–0.903) for logistic regression and 0.888 (0.852–0.924) for xgboost in the validation set. The slight reduction in predictive performance can be due to improvements in data quality at the most recent years of the study period leading to more accurate prediction in a validation set in years 2015 and 2016 or just due to the difference in the split ratio (81%/19% in the split by study year and 70%/30% in the random split).
Discussion
The results of the present study show that clinical data as recorded by physicians during treatment and conventional EHR data can be combined to produce extensive CVD phenotype data that works effectively in the prediction of mortality after ACS. The use of machine learning algorithm such as gradient boosting leads to more accurate prediction of mortality when compared to conventional regression analysis. The use of CVD phenotype data either by conventional logistic regression or by machine learning leads to significantly more accurate results when compared to the highly validated GRACE score specifically designed for the prediction of six-month mortality after admission for ACS.
The foremost implication of the results of this study is that with the ongoing advances in the application of EHR and clinical data, it is probably more feasible to model patient survival using local hospital level data than by generating traditional risk scores (such as globally developed GRACE), that would apply everywhere and in all settings equally [Citation18]. Supporting this, big data has also been shown to significantly improve risk prediction over traditional risk assessment of cardiovascular disease in primary prevention using the risk equations developed by the American Heart Association and the American College of Cardiology based on the results of previous prospective cohort studies [Citation10,Citation19].
The method of using only single centre data can also allow for flexible prediction of several end-points because the method is not restricted to only one predetermined and recorded end-point such as mortality. Additionally, effective use of big data on a single centre level would facilitate more effective quality control, accurate design of prospective clinical trials and perhaps in the future, even the implementation of individually tailored medical therapies and life-style interventions [Citation20]. However, when predicting only mortality among ACS patients, centres that lack the size and data infrastructure are most likely benefit using simple and externally validated well performing risk scores such the GRACE [Citation5,Citation6]. Within our study population, the performance of GRACE was similar to what has been previously reported [Citation6]. This validates GRACE score as a solid predictor among the present study population. In line, we also observed that many of the variables with similar content as the component of the GRACE score, also emerged as significant predictors of morality in multivariable model validating their significance in predicting death after ACS. Furthermore, in our validation set with available GRACE score data (as in the entire data set), the observed six-month mortality was 7.3%, which is similar or lower than expected by the mean GRACE score of the study population (GRACE score 120 corresponding to a predicted 8% six-month mortality from hospital admission) [Citation5]. This suggests that the present study population represents average ACS patient population receiving standard up-to-date care.
One major challenge when using historical data to predict future events are the changing trends in medical care. For example, the rates of different revascularization modalities such as CABG and PCI have been subject to change within the study period (2007–2017). Within our dataset, these factors were not among the top-predictors of mortality and had very little influence on the outcome.
Given our positive results, it is plausible that extensive phenotype data combined with more advanced analysis methods than supervised learning could yield even greater gains in prediction of adverse events [Citation8,Citation9,Citation21]. For example, a combination of uncompressed temporal data with capable analysis methods such deep artificial neural networks have outperformed many traditional classifiers in EHR-based outcome prediction [Citation22].
Challenges of integrating hospital level data for risk prediction include reaching sufficient sample size within reasonable timeframe, achieving good phenotype data quality and the execution of effective follow-up. Phenotype data quality can be addressed by detailed management of hospital level data and also by maintaining quality registries on a wider (i.e. national) level. For example, using registry data from multiple sources is difficult in countries, which lack centralized registries for biomedical data [Citation23]. This study was conducted in Finland where individual follow-up is easy due to the legislature that requires all health care providers report ICD-10 level data from all hospital as well as from outpatient clinic visits (https://www.finlex.fi/en/) with good quality for cardiovascular endpoints such as incidence of coronary heart disease and stroke [Citation24–26]. The same applies for following deaths and causes of deaths, which are followed nationally by Statistics Finland [Citation24,Citation25].
Another challenge in applying big data for outcome modelling is to avoid over-fitting when analyzing the data. In the present study this was avoided by using separate training and validation sets for model training and verification of the results. We also applied extreme gradient boosting which is robust approach to over-fitting in regression problems [Citation11,Citation27] with similar results than in conventional regression analysis.
In conclusion, the results of the present study demonstrate that extensive CVD phenotype data obtained by combining clinical data recorded by physicians with EHR data can be effectively used for predicting mortality after ACS. Extensive phenotype data can significantly out-perform an existing clinical risk prediction model such as the GRACE score. Furthermore, using a more advance machine-learning algorithm such as extreme gradient boosting leads to significantly better accuracy in risk prediction when compared to conventional logistic regression.
Supplemental Material
Download MS Word (52.3 KB)Disclosure statement
The authors report no conflict of interests.
Additional information
Funding
Related Research Data
References
- Hemingway H, Asselbergs FW, Danesh J, et al. Big data from electronic health records for early and late translational cardiovascular research: challenges and potential. Eur Heart J. 2018;39:1481–1495.
- Shah SJ, Katz DH, Selvaraj S, et al. Phenomapping for novel classification of heart failure with preserved ejection fraction. Circulation. 2015;131:269–279.
- Fox KAA, Gore JM, Eagle KA, et al. Rationale and design of the grace (global registry of acute coronary events) project: a multinational registry of patients hospitalized with acute coronary syndromes. Am Heart J. 2001;141:190–199.
- Granger C, Goldberg R, Dabbous O, et al. Predictors of hospital mortality in the global registry of acute coronary events. Arch Intern Med. 2003;163:2345–2353.
- Fox KAA, Dabbous OH, Goldberg RJ, et al. Prediction of risk of death and myocardial infarction in the six months after presentation with acute coronary syndrome: prospective multinational observational study (GRACE). BMJ. 2006;333:1091–1091.
- D’Ascenzo F, Biondi-Zoccai G, Moretti C, et al. TIMI, GRACE and alternative risk scores in Acute Coronary Syndromes: a meta-analysis of 40 derivation studies on 216,552 patients and of 42 validation studies on 31,625 patients. Contemp Clin Trials. 2012;33:507–514.
- Kim J. Big data, health informatics, and the future of cardiovascular medicine. J Am Coll Cardiol. 2017;69:899–902.
- Motwani M, Dey D, Berman DS, et al. Machine learning for prediction of all-cause mortality in patients with suspected coronary artery disease: a 5-year multicentre prospective registry analysis. Eur Heart J. 2017;38:500–507.
- Loghmanpour NA, Kormos RL, Kanwar MK, et al. A Bayesian model to predict right ventricular failure following left ventricular assist device therapy. JACC Hear Fail. 2016;4:711–721.
- Weng SF, Reps J, Kai J, et al. Can machine-learning improve cardiovascular risk prediction using routine clinical data? PLoS One. 2017;12:1–15.
- Friedman JH. Greedy function approximation: a gradient boosting machine. Ann Statist. 2001;29:1189–1232.
- Hernesniemi JA, Mahdiani S, Lyytikäinen LP, et al. Cohort description for MADDEC – mass data in detection and prevention of serious adverse events in cardiovascular disease. In: Eskola H, Väisänen O, Viik J, Hyttinen J. editors. EMBEC & NBC 2017. IFMBE Proceedings. Vol. 65. Singapore: Springer.
- Roffi M, Patrono C, Collet J-P, et al. 2015 ESC Guidelines for the management of acute coronary syndromes in patients presenting without persistent ST-segment elevation. Eur Heart J. 2015;32:2999–3054.
- Ibanez B, James S, Agewall S, et al. 2017 ESC Guidelines for the management of acute myocardial infarction in patients presenting with ST-segment elevation: the Task Force for the management of acute myocardial infarction in patients presenting with ST-segment elevation of the European Society of Cardiology (ESC). Eur Heart J. 2018;39:119–177.
- van BS, Groothuis-Oudshoorn K. mice:Multivariate Imputation by Chained Equations in R. J Stat Softw. 2011;45:1–67.
- Beasley TM, Erickson S, Allison DB. Rank-based inverse normal transformations are increasingly used, but are they merited? Behav Genet. 2009;39:580–595.
- Venables WN, Ripley BD. Modern applied statistics with S. Springer; 2002.
- Kolek MJ, Graves AJ, Xu M, et al. Evaluation of a prediction model for the development of atrial fibrillation in a repository of electronic medical records. JAMA Cardiol. 2016;1:1007–1013.
- Goff DC, Lloyd-Jones DM, Bennett G, et al. 2013 ACC/AHA guideline on the assessment of cardiovascular risk: a report of the American college of cardiology/American heart association task force on practice guidelines. Circulation. 2014;129:S49–73.
- Spertus JV, T. Normand S-L, Wolf R, et al. Assessing hospital performance after percutaneous coronary intervention using big data. Circ Cardiovasc Qual Outcomes. 2016;9:659–669.
- Miotto R, Li L, Kidd BA, et al. Deep patient: an unsupervised representation to predict the future of patients from the electronic health records. Sci Rep. 2016;17:26094.
- Shickel B, Tighe PJ, Bihorac A, et al. Deep EHR: a survey of recent advances in deep learning techniques for electronic health record (EHR) analysis. IEEE J Biomed Health Inform. 2018;22:1589–1604.
- Weber GM, Mandl KD, Kohane IS. Finding the missing link for big biomedical data. JAMA. 2014;311:2479–2480.
- Pajunen P, Koukkunen H, Ketonen M, et al. The validity of the Finnish hospital discharge register and causes of death register data on coronary heart disease. Eur J Prev Cardiol. 2005;12:132–137.
- Tolonen H, Salomaa V, Torppa J, et al. The validation of the Finnish hospital discharge register and causes of death register data on stroke diagnoses. Eur J Prev Cardiol. 2007;14:380–385.
- Sund R. Quality of the Finnish hospital discharge register: a systematic review. Scand J Public Health. 2012;40:505–515.
- Friedman JH. Stochastic gradient boosting. Comput Stat Data Anal. 2002;38:367–378.