
 ?Mathematical formulae have been encoded as MathML and are displayed in this HTML version using MathJax in order to improve their display. Uncheck the box to turn MathJax off. This feature requires Javascript. Click on a formula to zoom.
Abstract
Background: Dehydration appears prevalent, costly and associated with adverse outcomes. We sought to generate consensus on such key issues and elucidate need for further scientific enquiry.
Materials and methods: A modified Delphi process combined expert opinion and evidence appraisal. Twelve relevant experts addressed dehydration’s definition, objective markers and impact on physiology and outcome.
Results: Fifteen consensus statements and seven research recommendations were generated. Key findings, evidenced in detail, were that there is no universally accepted definition for dehydration; hydration assessment is complex and requires combining physiological and laboratory variables; “dehydration” and “hypovolaemia” are incorrectly used interchangeably; abnormal hydration status includes relative and/or absolute abnormalities in body water and serum/plasma osmolality (pOsm); raised pOsm usually indicates dehydration; direct measurement of pOsm is the gold standard for determining dehydration; pOsm >300 and ≤280 mOsm/kg classifies a person as hyper or hypo-osmolar; outside extremes, signs of adult dehydration are subtle and unreliable; dehydration is common in hospitals and care homes and associated with poorer outcomes.
Discussion: Dehydration poses risk to public health. Dehydration is under-recognized and poorly managed in hospital and community-based care. Further research is required to improve assessment and management of dehydration and the authors have made recommendations to focus academic endeavours.
Dehydration assessment is a major clinical challenge due to a complex, varying pathophysiology, non-specific clinical presentations and the lack of international consensus on definition and diagnosis.
Plasma osmolality represents a valuable, objective surrogate marker of hypertonic dehydration which is underutilized in clinical practice.
Dehydration is prevalent within the healthcare setting and in the community, and appears associated with increased morbidity and mortality.
Key messages
Introduction
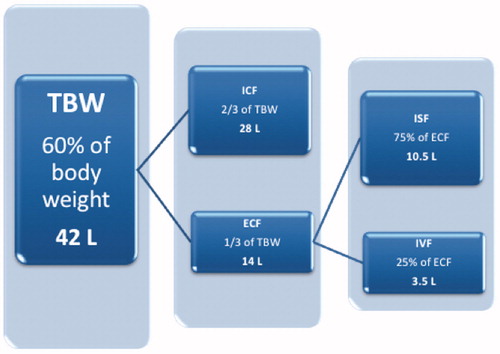
Water is critical for human survival. It is the largest single constituent of the human body, accounting for approximately 60% of adult body mass. It is the solvent in which many chemical reactions occur; distributes diverse molecules to cells (amongst them oxygen and metabolic substrates); is involved in the removal of waste products of metabolism (including carbon dioxide from cells, and as a major constituent of urine); and is essential for thermoregulation through redistribution of heat and via sweating. Through complex homeostatic mechanisms, total body water (TBW) is precisely regulated and distributed across the intracellular fluid (ICF) and extracellular fluid (ECF) compartments. ECF is further divided across the interstitial and intravascular spaces ().
Figure 1. Schematic representation of the body fluid compartments in humans and their relative sizes. The approximate absolute volumes of the compartments (in litres) are based on a 70 kg adult. TBW: total body water; ICF: intracellular fluid; ECF: extracellular fluid; ISF: interstitial fluid; IVF: intravascular fluid.
“Dehydration” is a term which, in clinical use, refers to a deficiency in total body water. Whilst no standard means of defining its presence or severity exists (see below), it appears to be both prevalent and costly within the healthcare setting. In 2015, 37% of patients aged over 65 years old admitted to a large UK hospital were dehydrated [Citation1]. Of 370,758 patients in the 2004 US National Hospital Discharge Survey, there were 518,000 hospitalizations primarily due to dehydration, incurring healthcare costs in excess of 5 billion dollars [Citation2]. The problem is not restricted to hospitalized patients, a recent UK study found one in every five older people living in long-term care to be dehydrated (serum osmolality >300 mOsm/kg) and half to be either dehydrated or at risk of becoming so (≥295–300 mOsm/kg) [Citation3]. Furthermore, it has been repeatedly shown that dehydration is associated with increased mortality and morbidity [Citation3–8].
Although a seemingly simple problem of “too little water”, dehydration is often inadequately identified and managed [Citation1]. This is, in part, due to the clinical challenge of managing a condition with little international consensus as to how it (or its severity) is defined or diagnosed [Citation9–12]. We organized an initiative bringing together a multidisciplinary group of experts to review and discuss current evidence on the subject, in order to generate consensus on key issues related to the diagnosis and management of dehydration as well as to highlight any needs for further scientific enquiry.
Materials and methods
We employed a modified Delphi process, combining expert opinion and evidence appraisal, to develop consensus statements and research recommendations. A similar method has been used and described previously by both the Acute Dialysis Quality Initiative (ADQI) [Citation13] and the Perioperative Quality Initiative (POQI) [Citation14]. The process is divided into three key phases: pre-conference, conference and post-conference activity. An expert group was compiled from various relevant specialist fields including critical care medicine, cardiology, anaesthesia, sports science and nutrition. Those invited were identified as international experts in dehydration and fluid management through broad discussion and literature review. A final faculty of 12 was then sub-divided into three groups, each assigned to cover one of the following subject areas:
Dehydration: description and definition
Objective markers of dehydration
Physiological impact of dehydration and patient outcome
The subject areas were originally proposed by those with extensive expertise and experience in human physiology and clinical practice; recruited faculty were then invited to suggest amendment, removal or additions. The final subject areas were agreed upon by the entire faculty, as both a pragmatic approach to the subject matter but also as topics deemed most in need of scientific enquiry. During the pre-conference phase, each group was assigned a chairman to coordinate activities and output. Using e-mail exchanges and teleconferences, groups refined discussion topics before undertaking extensive literature searches to generate bibliographies of key studies.
The framework for the intensive, face-to-face meeting was for small group discussions to alternate with plenary sessions. At the first plenary session, groups presented their assigned topic’s key areas of consensus and controversy, the supporting evidence and the planned focus for subsequent group discussions. Over the course of 2 d, consensus statements developed within small groups were then presented and discussed, before being refined in the plenary sessions. Through this iterative process, the statements evolved such that by the end of the final plenary, all members were able to agree consensus. In addition to this, each group compiled research recommendations to focus future academic endeavours within this subject.
After the conference, each group produced the supporting evidence for their statements. These were compiled and edited together to form a single manuscript. All attendees were given the opportunity to review and revise the entire manuscript before submission for publication. All those engaged in this consensus process were thus involved in all stages of development from proposing subject areas to refining discussion points and literature searches. All attendees have been included as authors of the manuscript.
Results
Fifteen consensus statements and seven research recommendations were generated across the three working groups. The consensus statements are numerically listed below and are immediately followed by brief supporting evidence. In some cases, two statements have been defended by a single section of supporting text. For ease of reference, presents the number of consensus statements produced per subject area. The research recommendations are presented in .
Table 1. Distribution of the fifteen consensus statements across the three subject areas.
Table 2. Dehydration research recommendations generated from all the working groups.
Dehydration: description and definition
1. There is no universally-accepted definition for dehydration in humans
Amongst the principal medical dictionaries, dehydration is defined simply as an excessive loss of body water [Citation15–17]. More expansive definitions are offered on the basis of differing physiological effects on the extracellular compartment: hypotonic, isotonic or hypertonic dehydration [Citation12]. The Dehydration Council prefers a more clinically focussed terminology of water-loss and salt-loss dehydration to highlight the two principal aetiologies of water deficit [Citation18]. However, European guidelines now refer to low-intake dehydration rather than water-loss, to reflect that its primary cause is insufficient drinking [Citation19]. In other sources, the compartment-specific terms of extracellular (salt-loss) or intracellular (low-intake) dehydration are used [Citation20, Citation21]. Some argue, however, that the term dehydration should refer only to the (osmotic-dependent) intracellular dehydration; extracellular fluid losses that lead to intravascular volume contraction should be described distinctly as volume depletion or hypovolaemia [Citation22,Citation23]. The American College of Sports Medicine published a Position Stand in which they describe dehydration as a process of water loss, that if continued without compensation will lead to the physiological state of hypohydration [Citation24].
In addition to the confusion that may be created by these varying definitions and categorizations, there is also a lack of specific detail that affords everyday clinical utility. Multiple recent reviews conclude with similar concern that there is a lack of consistency and clarity in defining dehydration, and its subtypes [Citation9,Citation11,Citation12,Citation18].
For clarity, in this article we will use the following terms:
Osmolarity as a measure of the concentration of all solutes per unit of solution volume; tonicity referring to the concentration (per unit of solution volume) only of those solutes which cannot cross a semipermeable membrane; and osmolality as a measure of the concentration of all solutes per unit of solvent mass.
Hypertonic dehydration to describe an uncompensated, predominantly pure water deficit (e.g. most commonly due to insufficient drinking or excessive sweating). This results in an increase in osmolality of the extracellular compartment (i.e. plasma and interstitial fluid) such that it becomes hypertonic with respect to the intracellular space [Citation9,Citation18,Citation23,Citation25,Citation26]. Other terms used to describe hypertonic dehydration include hyperosmotic, intracellular, water-loss and low intake dehydration.
Isotonic dehydration to describe a water deficit that is accompanied by a proportionate salt loss, as can be seen with diuretic use or secretory diarrhoea. There is, therefore, not an associated rise in the osmolality of the extracellular fluid and, as such, it remains isotonic with respect to the intracellular space. It is worth noting that there can also be an excessive salt loss causing a hypotonic dehydrated state [Citation9,Citation18,Citation23,Citation25,Citation26]. Other terms used to describe isotonic dehydration include iso-osmotic, extracellular and salt-loss dehydration.
2. The assessment of hydration status is complex, combining physiological and laboratory variables
Maintaining adequate total body water involves a complex network of homeostatic mechanisms that regulate water conservation, excretion and oral intake (through thirst) [Citation27]. Body water is dispersed across the extracellular and intracellular compartments; these volumes exhibit a constant state of flux, with inter-compartmental movement of water governed by osmotic gradients. Intracellular and extracellular ionic compositions differ substantially but are balanced across the cell membrane by electrochemical equilibrium [Citation28]. Water then moves freely across membranes to equalize osmotic forces. Further, there is intra-compartmental movement of water from the intravascular fluid to the interstitial fluid, determined by Starling forces and the lymphatic pump mechanisms, returning to the blood stream via lymph nodes and the thoracic duct [Citation29,Citation30]. This dynamic interplay of multiple variables highlights the challenges of body water assessment and management.
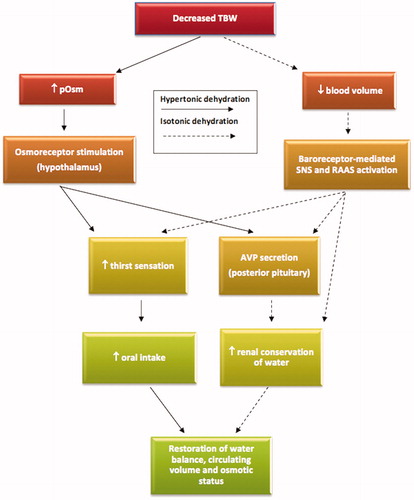
Dehydration represents a heterogeneous group of conditions with varying clinical and biochemical presentations. Hypertonic dehydration results in an osmotic pull of water from the intracellular compartment causing cellular dehydration and shrinkage. At an increase in plasma osmolality of around 2% (approximating to an absolute threshold above 285 mOsm/kg, with some variation between individuals [Citation31]), the loss of intracellular fluid stimulates the hypothalamic osmoreceptor response, initiating thirst and pituitary secretion of the antidiuretic hormone arginine vasopressin (AVP). Ultimately, increased oral fluid intake and augmented renal retention of water normalizes extracellular osmolality and intracellular hydration [Citation20,Citation32,Citation33]. The rapid osmotic redistribution of intracellular fluid to the extracellular compartment also means that, unless severe water deficits exist, intravascular volume will be relatively protected (i.e. fluid loss is primarily from within cell). However, in isotonic dehydration, the osmotic gradient between fluid compartments is absent. This results in a blunted AVP response to water loss and negligible redistribution of fluid into the extracellular space. As such, intravascular losses are substantially greater in isotonic dehydration than that seen in comparable levels of hypertonic dehydration [Citation26,Citation34]. Intravascular volume depletion (in excess of a 10% threshold) will be sensed by baroreceptors in the arterial tree stimulating the renin–angiotensin–aldosterone system, AVP release, thirst sensation and sympathetic outflow in order to restore fluid status and haemodynamic stability [Citation18,Citation26,Citation35]. Accordingly, although the osmotic response is more sensitive, blood volume plays an additional pivotal role in the regulation of water balance (). It is noted that aetiological processes driving both hypertonic and isotonic dehydration can occur concurrently, complicating clinical assessment and treatment as well as definition [Citation21,Citation25,Citation26].
Figure 2. The homeostatic responses of the two major forms of dehydration: hypertonic (primarily osmotic-dependent response) and isotonic (primarily volume-dependent response). The osmotic response is more sensitive and acts as the principal determinant of water balance. Note that both responses can co-exist. TBW: total body water; pOsm: plasma osmolality; SNS: sympathetic nervous system; RAAS: renin–angiotensin–aldosterone system; AVP: arginine vasopressin.
In summary, haemorrhage, pathological polyuria, vomiting, diarrhoea, drug-induced diuresis or poor oral fluid intake can all lead to a deficiency in body water – to “dehydration”. However, for the reasons explained above, the same volume of water deficit can produce different biochemical and haemodynamic effects [Citation26]. Therefore, although much of the physiology of dehydration can be well described, the clinical presentation may be indistinct and as such demands broad, comprehensive assessment. Different approaches to diagnosis, prevention and treatment are needed for the different types of dehydration.
3. “Dehydration” and “hypovolaemia” are terms that are commonly used interchangeably. This is incorrect
In 1941, Nadal et al. elegantly described and demonstrated the importance of distinguishing two types of dehydration, depending on whether the water deficit involved a corresponding loss of salt or not [Citation25]. As discussed in previous sections, hypertonic dehydration protects intravascular volume due to osmotic forces drawing fluid into the extracellular compartment, which is rarely associated with intravascular hypovolaemia and requires hypotonic fluid therapy for correction. Isotonic dehydration is characterized by extracellular and, therefore, intravascular volume loss, which requires volume resuscitation with salt-containing fluid. Although the conditions can co-exist (e.g. in a person suffering secretory diarrhoea who also has a poor oral intake of fluids) they are separate pathophysiological processes requiring different treatments. Despite the passage of nearly 80 years since the paper of Nadal et al., the medical community continues to use the terms dehydration and hypovolaemia interchangeably. This group agrees with the sentiment expressed by Mange et al., that “proper use of the terms dehydration and volume depletion informs communication and should improve patient care” [Citation23]. The term “hypovolaemia” should be reserved to refer specifically to intravascular volume depletion, which may be a sequelae to dehydration (most commonly in isotonic dehydration) but is not synonymous with it.
4. Dehydration is a term commonly used to suggest an absolute deficit in body water. This is over-simplistic and could lead to inappropriate intervention
and
5. Abnormalities in hydration status include relative and/or absolute abnormalities in total body water and serum/plasma osmolality. Raised osmolality usually, but not exclusively, indicates dehydration
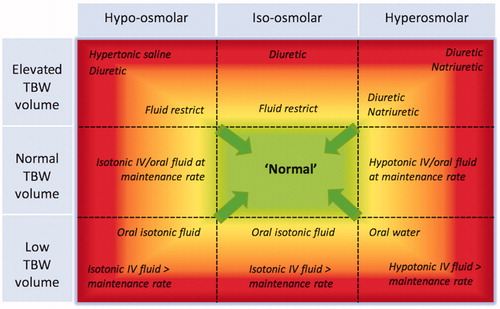
Dehydration is commonly associated with hyperosmolality. However, as already discussed, there is a range of osmolar states that may occur with dehydration, dependant on the extent of associated salt loss [Citation18,Citation21,Citation26]. Similarly, clinicians should be aware of the concept of a relative water deficit: for example, excess solute administration from intravenous saline infusions will increase the extracellular compartment osmolality and volume with subsequent contraction of intracellular water, thereby establishing a hypervolaemic hyperosmolar state with a relative intracellular dehydration [Citation22]. The reader may find it helpful for interpretation of the wide-ranging presentations of abnormal hydration to consider a matrix-like relationship between osmotic status and the volume of total body water. provides a graphical display of this relationship and incorporates treatment options for the varying abnormal physiological states.
Figure 3. The relationship between osmotic state and total body water (TBW). It is possible for patients to exist in any one of the nine panels. The graded colouration reflects severity of condition. Possible treatment options for different parts of each panel are written in italics, with the arrows representing intended effects of intervention to normalize physiology. IV: intravenous (Image reproduced with permission from the Perioperative Quality Initiative, POQI).
Objective markers of dehydration
6. Direct measurement of serum/plasma osmolality is the gold standard for determining dehydration
Plasma osmolality (pOsm) is the main homeostatic parametre against which humans regulate intracellular hydration [Citation36]. When people drink too little fluid relative to their losses, their extracellular fluid volume drops while their electrolyte content remains constant. As a result, osmolality (the number of solute particles per kg of solvent) and osmolarity (number of solute particles per litre of solution) rise [Citation18,Citation26,Citation37,Citation38]. As osmolality must equalize through body fluids and because most osmotically active solutes cannot easily cross cell membranes, water moves from inside cells to join extracellular fluid until equilibration. Inadequate fluid intake thus raises the osmolality of all intracellular and extracellular body fluids. The main reduction is in the volume of intracellular fluid, but there will be a concomitant though much smaller reduction in extracellular fluid [Citation39,Citation40].
In the absence of excessive electrolyte loss or gain, plasma osmolality (pOsm) can thus generally be used as an index of abnormal fluid status (dehydration or fluid overload). Direct laboratory measurement of plasma osmolality is performed using freezing point depression or vapour pressure depression osmometres (which rely on the thermodynamics of phase changes to determine percentage water content), with variance coefficients of 0.9% and 1.1%, respectively [Citation41]. These techniques require competent technicians and prompt testing of samples with minimal thermal disruption [Citation42].
Among other proposed markers of hydration status, pOsm is unique in that it can be used to diagnose fluid deficit from a single value in an individual, with respect to a reference interval in the general population. In experiments on healthy volunteers, pOsm demonstrates a 90% sensitivity and 100% specificity for detecting dehydration associated with a 2% fall in body mass [Citation39]. Isotonic dehydration will not be reliably detected by changes in plasma osmolality. Instead, for people with a clinical history which may predispose to isotonic dehydration (e.g. prolonged diarrhoea, vomiting or acute blood loss), their intravascular volume status should be assessed as per statement 11, below.
Although urine measures of osmolality (including specific gravity and colour) are non-invasive and intuitive markers of hydration, inter-individual and intra-individual diurnal variation limit their use as instantaneous markers [Citation39,Citation43,Citation44]. Further, urine and plasma osmolality correlate poorly, in part due to their differing urea concentrations. Urea contributes ∼1% to blood osmolality but as much as 40% to the osmolality of urine [Citation26]. Assessment of urine specific gravity, colour and osmolality as markers of serum osmolality in 313 older British adults has shown all these urinary markers to have extremely poor diagnostic accuracy, possibly due to declining renal function with age – in older people they provide little better than a guess at hydration status [Citation45].
Creatinine (derived from the metabolism of muscle creatine) is freely filtered and subject to proximal renal tubular secretion. The ratio of the concentration of urea (or blood urea nitrogen, BUN) to that of creatinine (U:Cr or BUN:Cr) will rise when creatinine concentration is low in the context of a low skeletal muscle mass (e.g. in the elderly, cachectic and chronically malnourished and critically ill) [Citation46–48]. Urea (the end-product of nitrogen-containing amino-acid metabolism), meanwhile, is freely filtered at the glomerulus then both resorbed and secreted by renal tubules. U:Cr ratio will rise when urea concentration rises disproportionately to the rise in creatinine. This is the case in dehydration, when urea concentrations in the renal medulla (and thus plasma) rise in the face of continued free creatinine filtration [Citation49]. A U:Cr ≥ 80 (when both components are measured in mmol/L) – equivalent to blood urea nitrogen BUN:Cr >20 (when both are measured in mg/dL) – has thus been traditionally considered a marker of dehydration (or intravascular volume depletion) [Citation50,Citation51]. However, U:Cr is not specific to dehydration and may rise for other reasons: urea, for instance, also rises in hypercatabolic states (sepsis, major surgery, starvation) [Citation48], with the large “blood protein meal” of an upper gastrointestinal bleed [Citation52] and with high-dose glucocorticoid administration [Citation53].
The diagnostic utility of saliva osmolality is affected by oral artefacts such as recent fluid consumption and factors influencing saliva flow rate which include neural control and inherent inter-individual variability [Citation54]. It is therefore of limited value in the assessment of hydration status.
Physician assessment is often used as a standard for diagnosis of dehydration, but there is good evidence that it does not correlate with serum osmolality data. Of 102 medical admissions for “dehydration” in the US, only 17% had serum osmolality >295 mOsm/kg, probably because clinicians are relying on unhelpful signs [Citation55]. The authors are well aware of the received wisdom that a diagnosis of dehydration relies on clinical assessment of hydration status, but could not find good evidence for this within our comprehensive literature review.
7. In the absence of readily available directly measured serum/plasma osmolality, we recommend, as a surrogate, that plasma osmolarity be calculated (pOsmc) as follows:
The osmolarity of a liquid is a function of its water content and of the dissolved ions and gasses in the liquid. Thus, measuring molar concentrations of dissolved molecules will theoretically yield osmolarity. In reality, although many plasma osmolytes are routinely measured, some components, such as alcohols, mannitol, triglycerides or gamma-globulins are not. Despite this, several empirical formulae use the primary osmolytes (sodium, potassium, glucose and urea) to calculate plasma osmolarity. The correlation between such values and directly measured serum or plasma osmolality has been assessed in five cohorts of older European adults (595 people) across a wide range of ages, health status (healthy, frail and hospitalized) and residential status (living either in the community or in residential care). Across these, the Khajuria and Krahn equation [Citation56] best predicted measured pOsm of 39 different equations tested:
The equation is not perfect at predicting directly measured osmolality, however, because of the components of osmolality that are not included in the equation. If we aim to maximize sensitivity so that the fewest older adults with dehydration are missed, then a cut off of ≥295 mmol/L (in calculated osmolality) provides a sensitivity of 85% and specificity of 59% for directly measured serum osmolality of >300 mOsm/kg [Citation57,Citation58]. Other equations had lower diagnostic accuracy, so should not be used. This equation also appears to be useful in younger adults: a study involving 60 healthy volunteers (aged 19–46 years) assessed the validity of 36 osmolarity equations in their ability to predict directly measured plasma osmolality. The Kajuria and Khan equation was deemed one of only five that performed consistently well, with a mean difference of only −1.4 mOsm between the calculated osmolarity and the directly measured osmolality [Citation59].
We, therefore, recommend that, when direct measurement is not readily available, plasma osmolality be calculated using the Khajuria–Krahn equation as a screening test for hypertonic dehydration. An elevated calculated osmolarity can be verified by direct measurement of osmolality. This measured osmolality, when interpreted in the clinical context of the patient and in conjunction with assessment of volume status can then be used to establish the diagnosis of dehydration and inform management.
8. Measured plasma osmolality >300 mOsm/kg classifies a person as hyperosmolar
Using data from 16 controlled fluid balance studies in men and women (ages ranging from ∼18 to 88 years), mean pOsm in healthy euhydrated individuals was found to be 284 mOsm/kg (range 279–291 mOsm/kg), but higher in older adults [Citation36]. Typical day-to-day (intra-individual) biological variation (coefficient of variation) appears to be 1.3% [Citation39]. Thus, pOsm values of 290 mOsm/kg have been considered indicative of an upper cut-off for euhydration in healthy adults (with other proposed cut-offs discussed below) [Citation24,Citation60]. However, it has been argued that such mean pOsm values in healthy young adults (∼285 mOsm/kg) may have been a consequence of (trial-related) prescribed fluid consumption prior to blood sampling inducing a mildly diluted state [Citation39]. Slightly higher group mean pOsm values (290–293 mOsm/kg) have been reported in some studies of healthy, apparently euhydrated, individuals [Citation39,Citation61,Citation62]. The group mean pOsm is often ∼5 mOsm/kg higher in euhydrated elderly individuals [Citation63,Citation64] and approximately 50% of free-living individuals between 20 and 90 years of age may have a plasma tonicity of >295 mmol/L[Citation65] (tonicity is allied to calculated osmolarity but does not include assessment of urea). An associated coefficient for intra-individual variation of 0.8% suggests that pOsm remains tightly regulated in healthy individuals aged > 70 years, even if around a slightly higher set point [Citation66].
For every ∼2% loss of body mass by sweating, pOsm increases by ∼5 mOsm/kg [Citation67]. However, there was a ∼30% shared variance in the pOsm distribution across 61 individuals assessed when assumed to be euhydrated and again when intentionally dehydrated by 2–6% body mass. POsm values ≥295 mOsm/kg were observed in 13% of the euhydrated individuals, while pOsm values ≤295 mOsm/kg occurred in 16% of the dehydrated subjects [Citation61]. This suggests that pOsm values of ∼295 mOsm/kg should not be considered to indicate an atypical hyperosmolar state per se, but should prompt further clinical assessment to determine hydration status.
Using analytic and biological variation data from a young cohort (mean age 24 ± 4 years), a pOsm value of 301 ± 5 mOsm/kg was diagnostic of dehydration at the 95% probability level [Citation39]. This value was calculated by adding the reference change value to the euhydrated grand mean. Importantly, the reference change value is not affected by ageing [Citation66] and may also have diagnostic relevance for older populations [Citation39] although some caution is warranted given that the euhydrated grand mean may be slightly higher in this population. These empirical data showed good consistency with extant definitions for elevated pOsm, at least in the context of dehydration [Citation18,Citation57,Citation65] and, taken together, suggest that a pOsm of >300 mOsm/kg represents an appropriate threshold for diagnosing hypertonic dehydration.
9. Plasma osmolality ≤280 mOsm/kg classifies a person as hypo-osmolar
There is, perhaps, less consensus regarding an appropriate pOsm for classifying an individual as hypo-osmolar. Indeed, euhydration is sometimes only defined with reference to an upper pOsm limit [Citation24,Citation60]. Stated normative lower-limit reference values for pOsm typically range between 275 and 280 mOsm/kg [Citation26,Citation57,Citation65] but the empirical evidence base for these values is often not clear. If it is assumed that any values more than 2 standard deviations from the group mean represent a pOsm approximating the lowest 2.5 per cent of the population, then typical representative literature estimates for a healthy young population range between 273 and 283 mOsm/kg [Citation63,Citation64,Citation67,Citation68]. These estimates are slightly higher (285–286 mOsm/kg) when data from older populations are analysed in the same way [Citation63,Citation64,Citation67]. Similarly, applying the approach of Cheuvront et al. [Citation39] for defining their 95% per cent probability upper-limit for pOsm yields an estimated 95% probability lower-limit for their data of 283 ± 5 mOsm/kg. Taken together, these data suggest that a pOsm of ≤280 mOsm/kg represents an appropriate threshold for characterizing a hypoosmolar state.
10. Tracer dilution techniques represent the gold standard for total body water measurement. These do not have utility in everyday clinical practice
Assessing hydration status through total body water (TBW) measurement in humans outside well controlled experimental settings is difficult. Currently, dilution techniques represent the gold standard methods to assess TBW: an inert substance (tracer) is administered orally or intravenously, and its concentration measured after an appropriate equilibration period. The tracer concentration may be determined in plasma or serum although some techniques employ expired gas analysis. Accuracy and reproducibility depend upon full equilibration having occurred across all body compartments [Citation11]. Equilibration periods in humans are generally at least 3-4 hours, which explains in part the fact that there are no readily available, reliable methods that can be applied at the bedside to aid clinical assessment of true total body water status [Citation69]. Commonly employed tracers include the naturally occurring stable isotopes deuterium oxide (D2O) and oxygen-18 (H218O) with radioisotopes such as tritiated water used less frequently. Although viewed as the gold standard, the smallest detectable change using these techniques is about 800 ml which approximates to about 2% of TBW [Citation69]. These tracer techniques do not allow for estimation of the volume of various body compartments and are unable to distinguish between intracellular and extracellular fluid.
Such measures in isolation do not indicate the hydration status of an individual per se but provide a baseline measure for longitudinal measurements. Although newer technologies including bioimpedence and bioreactance are becoming more readily available, limitations to these techniques mean that their use may also better be used to track changes in TBW rather than for measurement of absolute hydration status [Citation11,Citation70].
11. We recommend the use of NICE 174 clinical signs to assess abnormalities in volume status
The volume status of all patients should be assessed irrespective of their plasma osmolality. No one diagnostic test exists to accurately determine a patient’s intravascular volume status with respect to normovolaemia. We, therefore, recommend that the National Institute for Health and Care Excellence (NICE) guidelines on intravenous fluid therapy in adults in hospital be used in the initial assessment and resuscitation of any patients in the acute setting [Citation71]. Thus, the following are indicators that a patient may need urgent fluid resuscitation:
systolic blood pressure is less than 100 mmHg
heart rate is more than 90 beats per minute
capillary refill time is more than 2 seconds or peripheries are cold to touch
respiratory rate is more than 20 breaths per minute
National Early Warning Score (NEWS) of 5 or more
A passive leg raise test is effective in assessing if a patient is preload responsive. Having rested semi-recumbent, the patient’s upper body is lowered to horizontal, and their legs passively raised to 45°. If at 30–90 s, there are signs of haemodynamic improvement, such as an increase in stroke volume or cardiac output, this indicates that volume replacement may be beneficial. Likewise, the patient may be intravascularly fluid overloaded if in response to the test they demonstrate increased breathlessness or other deterioration. The degree and invasiveness of haemodynamic assessment required will be guided by the clinical severity of the case. One systematic review has assessed the signs of acute blood loss in adults, and suggests that severe postural dizziness (preventing assessment of standing vital signs) or a postural pulse increment, as a patient moves from sitting to standing, of ≥30 beats/min are the most useful signs of hypovolaemia due to significant blood loss [Citation72]. Additionally, the patient’s history, full clinical examination, current medication, clinical monitoring and laboratory investigations should be used to determine the likely fluid and electrolyte balance.
12. Outside of extremes, clinical signs and symptoms of dehydration in adults are subtle and may be unreliable. Clinical signs and symptoms should not be used in isolation for detecting abnormalities in hydration (volume or osmolality)
A systematic review of potential signs and markers of hypertonic dehydration in older adults found none with adequate sensitivity and specificity [Citation9]. Twenty-two of the included studies assessed 67 index tests (including skin turgor, capillary refill, mouth dryness, body temperature, thirst, urine concentration, confusion, and bioelectrical impedance) in adults aged at least 65 years old. Of all metrics assessed, only bioelectrical impedance, expressions of fatigue and observed reduced oral fluid intake correlated with dehydration to some degree in some studies – but often with low diagnostic accuracy. Dehydration was defined as serum osmolality ≥295 mOsm/kg, but sensitivity analyses using the cut-off of >300 mOsm/kg did not appear to improve accuracy of any markers. No clinical signs were consistently diagnostically accurate in more than one study. The review concluded that individual tests should not be used in older adults as they lack diagnostic accuracy [Citation9].
A further systematic review suggested that capillary refill time, neurological signs and skin, eye and mucous membrane signs have limited utility in diagnosing or assessing the severity of dehydration [Citation72]. In keeping, tachycardia, low systolic blood pressure, dry mucous membrane, dry axilla, poor skin turgor, sunken eyes, saliva flow rate and long capillary refill time have been shown to be of poor diagnostic accuracy for the detection of dehydration [Citation73]. Later individual studies in young adults also suggest lack of utility of urine specific gravity, body mass and bioelectrical impedance to diagnose hypertonic dehydration in one-time assessments [Citation39,Citation74].
Physiological impact of dehydration and patient outcome
13. There is a high prevalence of dehydration amongst outpatients and inpatients which is not reliably detected
We undertook a comprehensive, non-systematic literature review in keeping with methodology from recent similar consensus initiatives [Citation75,Citation76]. Searches were conducted using PubMed or the Healthcare Databases Advanced Search (HDAS) to seek out data relating to prevalence of dehydration (i) in care homes, (ii) amongst hospital patients on admission, and (iii) during subsequent hospital stay. Searches were limited to studies involving adult humans and, where relevant, to those that specifically referred to admission data or investigations. Outside of those that involved clinical coding databases, the literature is dominated by small studies. Further, interpretation is complicated by the aforementioned issue that there is no consensus for defining dehydration and, as such, a wide range of diagnostic criteria have been used to report its prevalence. Many of the diagnostic methods have limitations (discussed in statements 6, 7, 10 and 12). Population studies rely on accurate recognition of a dehydrated state, recognition of importance in causing hospital admission or impacting on outcome during such admission, and also on its subsequent coding on the administrative patient record. As a result, the prevalence of dehydration may have been substantially underreported. Serum U:Cr or BUN:Cr, osmolality or osmolarity represent empirical and widely accepted surrogate markers that are strongly associated with depletion of body water. When these biochemical markers are used to define dehydration, the prevalence dramatically rises. However, such studies (examples are cited below) are few in number and sample sizes are small (n = 39–2591). Overall there is sufficient evidence to support expert consensus within the authorship group that the prevalence of dehydration within healthcare systems is sufficient to be of major concern. This opinion aligns with that of NHS England who recently published a guidance report on nutrition and hydration in which they identified that, although difficult to quantify, dehydration is a significant healthcare burden within both the community and acute care settings [Citation77]. Similarly, a Commonwealth Fund report in 2000 described the prevalence of dehydration (and malnutrition) in US nursing homes as a “silent epidemic” [Citation78].
(i) Prevalence of dehydration in care homes
The elderly are particularly susceptible to dehydration due to age-related physiological and functional decline, including diminished thirst response and a decline in renal concentrating capacity; reduction in social drinking due to loss of friends and isolation; decisions to drink less due to concerns over access to toilets and issues around continence; multi-morbidity; and the side effects of polypharmacy [Citation79,Citation80]. Even amongst the community-dwelling elderly, the prevalence of dehydration (assessed using hypertonicity) has been shown to be as high 20–30% [Citation37,Citation65,Citation81]. The majority of care home residents appear not to achieve the requisite minimum daily fluid intake to maintain adequate hydration, although assessment of fluid intake outside of specialist units is notoriously poor [Citation82–87]. The problem of dehydration in long-term care facilities is thus well-recognized [Citation87]. Studies that have used biochemical markers of dehydration report a wide range of dehydration prevalence in care homes which reflects not only the choice of surrogate marker but also the threshold level deemed indicative of dehydration. The recent Dehydration Recognition In our Elders (DRIE) cohort study reported that 20% of 188 residents from multiple UK institutions had a serum osmolality >300 mOsm/kg (and 48% a value ≥295mOsm/kg) [Citation3]. Three further US care home studies reported 0, 19 and 38% of residents had a serum osmolality >300 mOsm/kg, with a further 8, 44 and 30%, respectively, having a serum osmolality between 295 and 300 mOsm/kg (this grey area is sometimes referred to as “impending dehydration”) [Citation85,Citation88,Citation89].
Other thresholds and measures provide even more varied assessments of dehydration prevalence. A behavioural intervention study from the US, aimed at improving oral fluid intake in nursing home residents, found 88% of the intervention and 67% of the control group to be dehydrated (defined as BUN:Cr > 20 and/or Osm >305 mOsm/kg) based on baseline (pre-intervention) serum biochemistry [Citation90]. Mentes used a more demanding threshold to determine prevalence: over a 6 month observational period, 31% of 35 care home residents suffered a dehydration “event” defined as either hospitalization for dehydration, the administration of intravenous fluid in the nursing home or a serum BUN:Cr >25 [Citation91]. Laboratory data from a Taiwanese cross-sectional study showed that amongst 111 care home residents 17.1% had a BUN:Cr > 20, 5.4% had pOsm > 300 and 2.7% had Na > 145 [Citation92].
Other methods for assessing the prevalence of dehydration have been applied, including clinical symptoms/signs (46% of 121 residents [Citation83]) bioelectrical impedence (47% of 51 residents [Citation93]) 24 h urine output (33% of 88 residents [Citation94]) and unrinometre measurements of urine specific gravity (25% of 16 residents [Citation95]). It is worth reiterating, however, that many clinical signs and assessments (including urine specific gravity and volume) are non-specific and with limited diagnostic, particularly in the elderly [Citation9,Citation55].
Fries et al. look at the data produced from over 2000 care home residents’ Minimum Data Set (MDS) assessments and reported a dehydration prevalence of 1–2% [Citation96]. Similarly, analysis of the MDS of nearly 800,000 care home residents from three countries (Iceland, USA and Canada) suggested that 1% were dehydrated (Iceland 1.2%, USA 1.4% and Canada 0.8%) [Citation97]. The MDS is a standardized, multi-domain, clinical coding tool that is obligatory for all Medicare/Medicaid long-term care facilities, and is designed to ensure that the needs of individual residents are addressed and met. The lower rates of recorded dehydration, when compared to other studies, may be related to its use of clinical signs, inherent limitations of coding systems and the possibility of detection bias, particularly for quality indicators such as dehydration [Citation98–100]. Despite the disparate reports of prevalence, there is a strong signal from studies that have used serum osmolality at sensible thresholds that dehydration remains a problem in care homes and this is a concern voiced by many [Citation37,Citation77–80,Citation86,Citation87,Citation101–104].
(ii) Prevalence of dehydration on admission to hospital
Several studies reported in this section (and the next) used ICD coding classification for diagnosis of dehydration. The studies, however, used a variety of codes to define a diagnosis of dehydration, the three principle ones being hyper-osmolality/natraemia (code 276.0), hypo-osmolality/natraemia (276.1) and volume depletion (276.5) [Citation105–111]. Although these clinical codes are not specific for dehydration and, as mentioned, coding systems have inherent limitations; the studies provide valuable indicators of dehydration prevalence. In the US, the admission rate (as per ICD coded primary admission diagnosis) has remained stable at ∼130 per 100,000 of the general population [Citation110]. In 1991, dehydration was recorded as a primary or concomitant diagnosis in 6.7% (731,695) of Medicare hospital admissions [Citation105]. Furthermore, 1.4% (146,960) of admissions had dehydration as the principal diagnosis, ranking it within the top ten most frequently diagnosed primary conditions and necessitating $446 million of Medicare reimbursement costs [Citation105]. Of 27,000 admission records at a single hospital over a 6 year period, 0.55% had a primary diagnostic ICD code associated with dehydration [Citation107].
Admission data for elderly patients reflect their known increased risk of dehydration. Two observational studies of patients aged >65 years who presented to large urban hospitals reported that 37% (UK study, 200 patients) [Citation1] and 46% (Slovenian study, 410 patients) [Citation112] had an admission pOsm > 300 mOsm/kg. Studies that have used methodology less reliable than pOsm have reported variable results: two studies using BUN:Cr reported 62% [Citation112] and 48% [Citation113] dehydration on admission; a UK study found that only 1.3% of 21,000 admissions aged >65 years had hypernatraemia (defined as Na > 145 mmol/L [Citation101]; and reviews of admission records have reported that 29% [Citation114] and 12% [Citation115] of elderly patient cohorts had documentation of dehydration diagnosis. Stroke patients also appear to have a particularly high prevalence of dehydration on admission: Rowat et al. reviewed blood results on the day of admission for over 2500 stroke patients and found that 36% were dehydrated (determined by a U:C > 80) [Citation116] and a similar prevalence (43%) was found amongst 324 ischaemic stroke patients admitted to a US institution [Citation117].
Dehydration has been repeatedly demonstrated to be a major culprit for avoidable hospital admissions both in the US [Citation2,Citation109–111] and in Europe [Citation118]. Xiao et al. estimated that avoidable hospitalizations with dehydration inflicted an economic burden on the US that amounted to over $1.14 billion for the year of 1999 [Citation109]. In 2004, Kim analysed the National Hospital Discharge Survey and found that approximately 518,000 admissions in the US for that year were primarily due to dehydration [Citation2]. Furthermore, the total healthcare costs attributed to those admissions was $5.5 billion.
(iii) Prevalence of dehydration during hospital admission
We specifically sought evidence for prevalence on dehydration that developed during hospitalization. Data were sparse, as we only reviewed those studies in which patients were determined to have been normally hydrated on admission, but who later developed dehydration whilst an inpatient. We do note, however, that the absence of a code for dehydration on admission does not mean that such dehydration was not present. The previously mentioned HOOP study identified elderly patients admitted to hospital with hyperosmolar states consistent with dehydration. They reported that two-thirds of those patients that were dehydrated on admission, remained so 48 hours later [Citation1]. In 1991, a retrospective study reviewed 160 adult cases of in-hospital hypernatraemia (>150 mmol/L) that occurred within a Welsh health district in a single year and found that 60% were of new onset, occurring whilst an inpatient. Whilst the administration of saline solutions may have contributed to this, dehydration was assigned as the aetiology to most of these cases [Citation119]. Likewise, a study in the US reported that within a cohort of hypernatraemic hospitalized patients, 83% developed the condition post-admission. Furthermore, it was found that the majority of these hospital-acquired hypernatraemic cases were iatrogenic, arising from inadequate prescription of water [Citation120]. Rowat et al. reviewed sequential blood results (U:Cr ratios) for 2591 stroke patients and found that 26% were not dehydrated on admission but developed dehydration at some stage during their hospital stay [Citation116]. Pash et al. reviewed all adult discharges, for a single year, on a clinical coding database used by over 600 US hospitals. Having excluded those patients known to be dehydrated on admission, they found that 2.1% of the remaining 4.2 million patients were diagnosed with dehydration post-admission [Citation106]. Wakefield et al. examined medical records for a US hospital over a 4 year period. From over 15,000 admissions, 3.5% had a post-admission diagnosis of one of the conditions with ICD codes associated with dehydration [Citation108]. These data highlight the clinical challenges of effectively meeting water requirements in hospital.
14. Dehydration in hospitalized patients and care home residents is associated with poorer outcomes;
and
15. Limited evidence suggests that the relationship between dehydration and poor outcome is causal
We performed a comprehensive search, again using PubMed or HDAS, to identify literature relevant to the relationship between hydration status and an array of clinical outcomes as specified below. Searches were limited to adult human studies.
(i) Mortality
There are no high-quality randomized controlled trials in older adults that have increased fluid intake in one arm and not in the other, and assessed effects on mortality [Citation104,Citation121]. In the absence of trial data, we must rely on the highest quality observational data available. In the US Medicare clinical coding database relating to more than 10 million hospitalizations of elderly patients (aged 65–99 years) during 1991, almost half of those hospitalized with a principal diagnosis of dehydration died within a year of admission, and 17.4% died within 30 days [Citation105]. For every principal diagnosis (respiratory illness, urinary system infections, cardiac conditions, frailty, diabetes, other metabolic disorders, gastroenteritis, other gastrointestinal conditions, cancer & sepsis) hospital admissions with a concomitant diagnosis of dehydration were associated with a significantly higher mortality within 30 d and up to one year, apart from deaths within 30 d of hospitalization for gastroenteritis [Citation105]. In the Hydration and Outcome in Older Patients (HOOP) prospective cohort study of 200 adults aged ≥65 years admitted as emergencies to a large UK teaching hospital, 7% of participants died in hospital. Hyperosmolar dehydration, defined as serum osmolality >300 mOsmol/kg at admission, was associated with a fourfold increase in 30-d mortality (16% versus 4%) [Citation1]. Might a diagnosis of dehydration simply be a proxy for frailty in the elderly? The relationship between dehydration and mortality remained in the HOOP data after adjustment for important confounders. Other studies with a similarly robust methodology (though still observational in nature) all suggest increased mortality in those who are dehydrated at baseline. These include a general elderly US population, UK stroke patients and US older people with diabetes [Citation122–124].
(ii) Process measures
There is limited evidence that dehydration on admission is associated with increased length of stay, readmission and economic burden in hospitalized elderly patients [Citation106,Citation125]. Patients who experienced post admission water deficit (defined by ICD coding, as described above) incurred total costs greater than 50% higher and an increased length of hospital stay (12.9 versus 8.2 d) when compared to propensity-matched hydrated patients [Citation106].
(iii) Acute kidney injury (AKI)
AKI has a mortality rate of 10–12% and dehydration is a significant risk factor in its development [Citation126]. In a 4000 patient, multi-national, cross-sectional study, dehydration was the most common cause of community acquired AKI (46% of cases) in low and low-middle income countries and the second most common cause in high-income countries (accounting for 38% of cases, second to hypotension at 40%) [Citation126]. Causes of dehydration in the community include advanced age; comorbidities; polypharmacy; limited access to drinking water; and excessively hot weather [Citation81,Citation126,Citation127]. In the UK, hypertension and diabetes mellitus are the comorbidities most commonly associated with renal impairment [Citation128]. In both conditions, dehydration can be superimposed, either as a result of the disease process itself or pharmacological treatment (diuretics). In hospitalized patients, markers of body water depletion such as raised plasma osmolality, BUN:Cr or U:Cr are associated with increased risk and severity of acute kidney injury [Citation129,Citation130]. Dehydration is an independent risk factor for secondary renal insults such as drug induced kidney injury [Citation131]. AKI is common in the perioperative setting, seen following orthopaedic, coronary artery bypass grafting, vascular, colorectal and hepatic surgery [Citation8,Citation132–134]. Whilst pathophysiology is multifactorial, relating for example to intraoperative blood loss, fluid shifts, patient comorbidities and post-operative infection, perioperative dehydration is a significant contributory factor [Citation135]. Maintenance of adequate hydration has a positive impact on outcomes in surgical patients vulnerable to AKI [Citation126]. The RELIEF trial, the largest clinical effectiveness trial of perioperative fluid therapy to date (n = 3000), demonstrated a significantly higher incidence of AKI (8.6 versus 5.0%) at 30 d in patients randomized to receive relative fluid restriction in the perioperative period, compared to those receiving a modestly liberal regimen [Citation136]. It is also worth noting that a higher U:Cr ratio is associated with reduced survival in chronic dialysis patients [Citation137,Citation138].
(iv) Thrombosis and thromboembolic disease
Dehydration increases blood viscosity and haematocrit and is thus a risk factor for intravenous and arterial thrombosis. The presence of dehydration at the time of admission following ischaemic stroke is associated with increased incidence of severe disability or death [Citation116,Citation117,Citation122]. The development or progression of dehydration during hospitalization for ischaemic stroke is associated with increased risk of stroke evolution [Citation139,Citation140], risk of secondary infection [Citation141], increased length of stay [Citation141], more severe hemi-spatial neglect [Citation142] and increased cost [Citation143]. Evidence from a few small interventional trials in this setting suggest that post-admission rehydration regimens aimed at the reduction of BUN:Cr ratios may reduce stroke evolution [Citation139], improve collateral cerebral perfusion [Citation144] and reduce length of stay [Citation141]. Such rehydration regimes do not have a similar impact in haemorrhagic stroke, which suggests that benefits might relate to improved reperfusion following ischaemic insult due to restoration of plasma volume and reduced plasma viscosity. There is some observational evidence to suggest an association between dehydration and the development of venous thromboembolism in a minority of patients after acute ischaemic stroke, but this has not been extensively studied [Citation145,Citation146]. There is a seasonal (monthly) variation in the incidence of venous thromboembolism (VTE): a retrospective single-centre analysis including almost 1500 consecutive patients noted that average blood urea nitrogen (BUN)-creatinine ratio was significantly higher in peak incidence months compared to the lowest incidence months, suggesting a potential mechanistic link between dehydration and VTE [Citation6].
Following established acute coronary syndrome (ACS), patients with hyperosmolarity experience longer length of stay, increased risk of secondary renal injury and cerebral ischaemic events and increased cardiovascular mortality [Citation147,Citation148]. Even mild dehydration may contribute to sudden cardiac death following ACS [Citation149]. ACS demonstrates a circadian oscillation, most typically occurring between the hours of 06:00 and midday [Citation4,Citation150]. A biologically plausible mechanism is that individuals are relatively dehydrated in the mornings following an overnight fast, creating prothrombotic conditions that contribute to infarct development [Citation151]. However, no interventional studies have been published which address whether rehydration following ACS has an effect on outcome.
(v) Delirium
A number of studies have associated dehydration with the development, duration and severity of delirium. Dehydration is known to impair mental performance in otherwise healthy individuals [Citation152] so it is perhaps unsurprising that a BUN:Cr ratio of >18 has been shown to be an independent predictor for development of delirium [Citation153] and that dehydration is found in 66% of patients with delirium [Citation154]. Dehydration is an independent predictor of inpatient mortality following a diagnosis of delirium [Citation155]. The mechanism by which dehydration effects cognitive function is not entirely understood, but cerebral hypoperfusion and hormonal changes may be contributing factors [Citation152,Citation156]. Dehydration and delirium are synergistic, with many factors, such as advanced age and reduced mobility common to both; it is difficult to differentiate how much hydration status contributes to confusion (and vice versa). Limited observational and interventional data suggest a benefit for timely correction of dehydration in this setting [Citation155]. Failure to correct dehydration prolongs the duration of delirium [Citation157], although elderly hospital inpatients at risk of falls were no more likely to have serum markers of dehydration than matched “non-faller” controls [Citation158]. Conversely, rehydration therapy in delirious individuals reduces the need for physicochemical restraint and reduces length of stay [Citation154].
(vi) Heart failure
Elevation of blood urea nitrogen, potentially indicative of dehydration, is predictive of mortality in decompensated and chronic heart failure [Citation159,Citation160]. A study involving 263 hospitals across the US, and including over 65,000 patients, found that the single best predictor for mortality in patients admitted with decompensated heart failure was admission BUN (superior to low systolic blood pressure) [Citation159]. That said, heart failure can drive U:Cr ratio up in the absence of dehydration, and renal failure can also complicate heart failure and thus raise circulating urea concentrations.
(vii) Critical illness
In a retrospective study of 4176 critically ill adult patients with a heterogeneous range of medical conditions admitted to a German ICU, high BUN concentration at ICU admission (defined as BUN >28 mg/dL, equivalent to urea >10 mmol/L) was robustly predictive of adverse outcome, even after adjustment for confounders including renal failure [Citation161]. This association is corroborated in an observational study of over 26,000 patients across 20 Boston intensive care units [Citation48].
(viii) Association between markers of dehydration and clinical endpoints in selected conditions
There is limited evidence that dehydration is a contributory factor for nephrolithiasis and constipation [Citation162,Citation163]. Elevated BUN is independently associated with mortality in community acquired pneumonia and in acute pancreatitis [Citation164–166]. Prophylactic liberal intravenous hydration also appears to limit pancreatitis following endoscopic retrograde cholangiopancreatography [Citation167]. It is unclear whether systemic hydration status has an effect on wound healing or on the incidence or severity of urinary tract infection [Citation168,Citation169].
Almost all of the literature on the impact of dehydration in the above-mentioned settings is retrospective and causality cannot be inferred. Limited interventional work suggests that rehydration improves outcomes (e.g. in stroke [Citation139] and delirium [Citation154]). There are no published randomized controlled trials of restrictive or liberal hydration regimes following events such as stroke or myocardial infarction. No firm conclusions can currently be drawn regarding the impact dehydration has in these conditions. On a cautionary note, there is evidence that excess intravenous administration of water and/or salt is harmful in sepsis [Citation170–172], critical care [Citation173–174], paediatric surgical admissions [Citation175] and perioperatively [Citation176–180]. Interpretation of study results is difficult since fluid therapy is a complex intervention, involving consideration of fluid & electrolyte balance, fluid volume and composition, applied in an array of different clinical settings [Citation181,Citation182].
Discussion
Dehydration is prevalent within the healthcare setting and in the community, and appears to be associated with increased morbidity and mortality. As such, dehydration represents a major challenge to clinicians and poses a significant risk to public health. It has a complex, varying pathophysiology that can lead to non-specific clinical presentations making assessment difficult. The lack of international consensus on definition and diagnosis further complicates the issue. Plasma osmolality, however, represents a valuable, objective surrogate marker of hypertonic dehydration which is underutilized in clinical practice. Furthermore, calculated osmolarity (using the Khajuria–Krahn formula) can be used as an effective screening tool for those at risk and we recommend its incorporation into routine care. Isotonic dehydration is particularly prone to intravascular hypovolaemia, which requires management that is distinct from hypertonic dehydration. The NICE clinical guideline 174 includes recommendations for assessment and management of intravascular hypovolaemia and its use is supported by the authors.
This manuscript highlights a number of other issues which are relevant to clinical practice. First, there is likely to be a high prevalence of unidentified dehydration in community based populations which only becomes apparent once a crisis point is reached and hospital admission is required. We should stress, however, that it is the elderly and comorbid who are at risk and that most healthy people drink adequately socially and in response to thirst; the push of drinking in excess of this has no credible scientific basis. Second, even in hospital, dehydration is under-recognized, under-treated, and poorly prevented. Third, whilst evidence is limited, dehydration appears to have a detrimental association with clinical endpoints across a range of medical conditions. Further research is required to improve assessment, diagnosis and management of dehydration and the authors have made recommendations to focus these academic endeavours. Interventional trials are required to assess the impact on clinical outcomes of regimens which aim to limit or treat dehydration.
Acknowledgements
The roundtable was supported by the Smiths Medical Endowed Chair at University College London and by researchers at the National Institute for Health Research University College London Hospitals Biomedical Research Centre.
Disclosure statement
H. M. and M. M. hold a patent related to a novel means of managing fluid delivery in hospital [Patent no. EP2525767B1]. H. M. consults for Deepmind Health, which has an interest in acute kidney injury. M. M. consults for Edwards Lifesciences and Baxter. M. M. is the founding Editor of Perioperative Medicine, sits on the Editorial Boards of The British Journal of Anaesthesia and Critical Care. M. M. is the founding Editor-in-Chief of TopMedTalk. L. F. has received financial support from Baxter for research activities. J. L., J. C., L. H., F. H., G. M., C. M., S. P., G. W. and T. W. report no conflicts of interest.
Related Research Data
References
- El-Sharkawy AM, Watson P, Neal KR, et al. Hydration and outcome in older patients admitted to hospital (The HOOP prospective cohort study). Age Ageing. 2015;44:943–947.
- Kim S. Preventable hospitalizations of dehydration: implications of inadequate primary health care in the United States. Ann Epidemiol. 2007;17:736.
- Hooper L, Bunn DK, Downing A, et al. Which frail older people are dehydrated? The UK DRIE Study. J Gerontol A Biol Sci Med Sci. 2016;71:1341–1347.
- Kloner RA. Natural and unnatural triggers of myocardial infarction. Prog Cardiovasc Dis. 2006;48:285–300.
- Feehally J, Khosravi M. Effects of acute and chronic hypohydration on kidney health and function. Nutr Rev. 2015;73:110–119.
- Elias S, Hoffman R, Saharov G, et al. Dehydration as a possible cause of monthly variation in the incidence of venous thromboembolism. Clin Appl Thromb Hemost. 2016;22:569–574.
- Kanagasundaram NS. Pathophysiology of ischaemic acute kidney injury. Ann Clin Biochem. 2015;52:193–205.
- Moghadamyeghaneh Z, Phelan MJ, Carmichael JC, et al. Preoperative dehydration increases risk of postoperative acute renal failure in colon and rectal surgery. J Gastrointest Surg. 2014;18:2178–2185.
- Hooper L, Abdelhamid A, Attreed NJ, et al. Clinical symptoms, signs and tests for identification of impending and current water-loss dehydration in older people. Cochrane Database Syst Rev. 2015;CD009647.
- McGarvey J, Thompson J, Hanna C, et al. Sensitivity and specificity of clinical signs for assessment of dehydration in endurance athletes. Br J Sports Med. 2010;44:716–719.
- Armstrong LE. Assessing hydration status: the elusive gold standard. J Am Coll Nutr. 2007;26:575S–584S.
- Crecelius C. Dehydration: myth and reality. J Am Med Dir Assoc. 2008;9:287–288.
- Kellum JA, Bellomo R, Ronco C. Acute Dialysis Quality Initiative (ADQI): methodology. Int J Artif Organs. 2008;31:90–93.
- Miller TE, Shaw AD, Mythen MG, et al. Evidence-based perioperative medicine comes of age: the Perioperative Quality Initiative (POQI). Perioper Med. 2016;5:26.
- Brooker C, editor. Churchill Livingstone medical dictionary. London: Churchill Livingstone; 2008.
- Martin E, editor. Concise medical dictionary. 9th ed. Oxford: Oxford University Press; 2015.
- Dorland WAN. Dorland’s illustrated medical dictionary. Philadelphia: Saunders/Elsevier; 2012.
- Thomas DR, Cote TR, Lawhorne L, et al. Understanding clinical dehydration and its treatment. J Am Med Dir Assoc. 2008;9:292–301.
- Volkert D, Beck AM, Cederholm T, et al. ESPEN guideline on clinical nutrition and hydration in geriatrics. Clin Nutr. 2019;38:10–47.
- Leib DE, Zimmerman CA, Knight ZA. Thirst. Curr Biol. 2016;26:R1260–R1265.
- Cheuvront SN, Kenefick RW. Dehydration: physiology, assessment, and performance effects. Compr Physiol. 2014;4:257–285.
- Feig PU, McCurdy DK. The hypertonic state. N Engl J Med. 1977;297:1444–1454.
- Mange K, Matsuura D, Cizman B, et al. Language guiding therapy: the case of dehydration versus volume depletion. Ann Intern Med. 1997;127:848–853.
- Sawka MN, Burke LM, Eichner ER, et al. American College of Sports Medicine position stand. Exercise and fluid replacement. Med Sci Sports Exerc. 2007;39:377–390.
- Nadal JW, Pedersen S, Maddock WG. A comparison between dehydration from salt loss and from water deprivation. J Clin Invest. 1941;20:691–703.
- Cheuvront SN, Kenefick RW, Charkoudian N, et al. Physiologic basis for understanding quantitative dehydration assessment. Am J Clin Nutr. 2013;97:455–462.
- Verbalis JG. Disorders of body water homeostasis. Best Pract Res Clin Endocrinol Metab. 2003;17:471–503.
- Nguyen MK, Kurtz I. Quantitative interrelationship between Gibbs-Donnan equilibrium, osmolality of body fluid compartments, and plasma water sodium concentration. J Appl Physiol. 2006;100:1293–1300.
- Taylor AE. Capillary fluid filtration. Starling forces and lymph flow. Circ Res. 1981;49:557–575.
- Levick JR, Michel CC. Microvascular fluid exchange and the revised Starling principle. Cardiovasc Res. 2010;87:198–210.
- Hughes F, Mythen M, Montgomery H. The sensitivity of the human thirst response to changes in plasma osmolality: a systematic review. Perioper Med. 2018;7:1.
- Bourque CW. Central mechanisms of osmosensation and systemic osmoregulation. Nat Rev Neurosci. 2008;9:519–531.
- Verbalis JG. How does the brain sense osmolality? J Am Soc Nephrol. 2007;18:3056–3059.
- Cheuvront SN, Kenefick RW, Montain SJ, et al. Mechanisms of aerobic performance impairment with heat stress and dehydration. J Appl Physiol. 2010;109:1989–1995.
- Dunn FL, Brennan TJ, Nelson AE, et al. The role of blood osmolality and volume in regulating vasopressin secretion in the rat. J Clin Invest. 1973;52:3212–3219.
- Institute of Medicine. Dietary reference intakes for water, potassium, sodium, chloride, and sulfate. Washington (DC): National Academies Press; 2005.
- Hooper L, Bunn D, Jimoh FO, et al. Water-loss dehydration and aging. Mech Ageing Dev. 2014;136–137:50–58.
- Sterns R, Spital A. Disorders of water balance. In: Kokko J, Tannen R, editors. Fluids and electrolytes. 2nd ed. Philadelphia: WB Saunders; 1990. p. 139–194.
- Cheuvront SN, Ely BR, Kenefick RW, et al. Biological variation and diagnostic accuracy of dehydration assessment markers. Am J Clin Nutr. 2010;92:565–573.
- Shirreffs SM, Merson SJ, Fraser SM, et al. The effects of fluid restriction on hydration status and subjective feelings in man. Br J Nutr. 2004;91:951.
- Draviam EJ, Custer EM, Schoen I. Vapor pressure and freezing point osmolality measurements applied to a volatile screen. Am J Clin Pathol. 1984;82:706–709.
- Bohnen N, Terwel D, Markerink M, et al. Pitfalls in the measurement of plasma osmolality pertinent to research in vasopressin and water metabolism. Clin Chem. 1992;38:2278–2280.
- Baron S, Courbebaisse M, Lepicard EM, et al. Assessment of hydration status in a large population. Br J Nutr. 2015;113:147–158.
- Perrier E, Vergne S, Klein A, et al. Hydration biomarkers in free-living adults with different levels of habitual fluid consumption. Br J Nutr. 2013;109:1678–1687.
- Hooper L, Bunn DK, Abdelhamid A, et al. Water-loss (intracellular) dehydration assessed using urinary tests: how well do they work? Diagnostic accuracy in older people. Am J Clin Nutr. 2016;104:121–131.
- Combe C, Chauveau P, Laville M, et al. Influence of nutritional factors and hemodialysis adequacy on the survival of 1,610 French patients. Am J Kidney Dis. 2001;37:S81–S88.
- Cartin-Ceba R, Afessa B, Gajic O. Low baseline serum creatinine concentration predicts mortality in critically ill patients independent of body mass index. Crit Care Med. 2007;35:2420–2423.
- Beier K, Eppanapally S, Bazick HS, et al. Elevation of blood urea nitrogen is predictive of long-term mortality in critically ill patients independent of “normal” creatinine. Crit Care Med. 2011;39:305–313.
- Mehta AR. Why does the plasma urea concentration increase in acute dehydration? Adv Physiol Educ. 2008;32:336.
- Weinberg AD, Minaker KL. Dehydration. Evaluation and management in older adults. Council on Scientific Affairs, American Medical Association. JAMA. 1995;274:1552–1556.
- Riccardi A, Chiarbonello B, Minuto P, et al. Identification of the hydration state in emergency patients: correlation between caval index and BUN/creatinine ratio. Eur Rev Med Pharmacol Sci. 2013;17:1800–1803.
- Mortensen PB, Nøhr M, Møller-Petersen JF, et al. The diagnostic value of serum urea/creatinine ratio in distinguishing between upper and lower gastrointestinal bleeding. A prospective study. Dan Med Bull. 1994;41:237–240.
- Beaufrere B, Horber FF, Schwenk WF, et al. Glucocorticosteroids increase leucine oxidation and impair leucine balance in humans. Am J Physiol Metab. 1989;257:E712–E721.
- Walsh NP, Laing SJ, Oliver SJ, et al. Saliva parameters as potential indices of hydration status during acute dehydration. Med Sci Sports Exerc. 2004;36:1535–1542.
- Thomas DR, Tariq SH, Makhdomm S, et al. Physician misdiagnosis of dehydration in older adults. J Am Med Dir Assoc. 2004;5:S31–S34.
- Khajuria A, Krahn J. Osmolality revisited-deriving and validating the best formula for calculated osmolality. Clin Biochem. 2005;38:514–519.
- Hooper L, Abdelhamid A, Ali A, et al. Diagnostic accuracy of calculated serum osmolarity to predict dehydration in older people: adding value to pathology laboratory reports. BMJ Open. 2015;5:e008846.
- Martín-Calderón JL, Bustos F, Tuesta-Reina LR, et al. Choice of the best equation for plasma osmolality calculation: comparison of fourteen formulae. Clin Biochem. 2015;48:529–533.
- Heavens KR, Kenefick RW, Caruso EM, et al. Validation of equations used to predict plasma osmolality in a healthy adult cohort. Am J Clin Nutr. 2014;100:1252–1256.
- Cheuvront SN, Sawka MN. Hydration assessment of athletes. Sport Sci Exch. 2005;18:1–12.
- Cheuvront SN, Kenefick RW. Am I drinking enough? Yes, no, and maybe. J Am Coll Nutr. 2016;35:185–192.
- Neal RA, Massey HC, Tipton MJ, et al. Effect of permissive dehydration on induction and decay of heat acclimation, and temperate exercise performance. Front Physiol. 2016;7:564.
- Mack GW, Weseman CA, Langhans GW, et al. Body fluid balance in dehydrated healthy older men: thirst and renal osmoregulation. J Appl Physiol. 1994;76:1615–1623.
- Stachenfeld NS, DiPietro L, Nadel ER, et al. Mechanism of attenuated thirst in aging: role of central volume receptors. Am J Physiol. 1997;272:R148–R157.
- Stookey JD. High prevalence of plasma hypertonicity among community-dwelling older adults: results from NHANES III. J Am Diet Assoc. 2005;105:1231–1239.
- Fraser CG, Cummings ST, Wilkinson SP, et al. Biological variability of 26 clinical chemistry analytes in elderly people. Clin Chem. 1989;35:783–786.
- Popowski LA, Oppliger RA, Patrick Lambert G, et al. Blood and urinary measures of hydration status during progressive acute dehydration. Med Sci Sports Exerc. 2001;33:747–753.
- Sawka MN, Toner MM, Francesconi RP, et al. Hypohydration and exercise: effects of heat acclimation, gender, and environment. J Appl Physiol Respir Environ Exerc Physiol. 1983;55:1147–1153.
- Schoeller D, Kushner R, Taylor P, et al. Measurement of total body water: isotope dilution techniques. In: Roche A, editor. Body composition assessment in youth and adults. Columbus (OH): Ross Laboratories; 1985.
- Armstrong LE. Hydration assessment techniques. Nutr Rev. 2005;63:S40–S54.
- NICE Clinical Guideline 174. Intravenous Fluid Therapy in Adults in Hospital. London: NICE; 2013.
- McGee S, Abernethy WB, Simel DL. The rational clinical examination. Is this patient hypovolemic? JAMA. 1999;281:1022–1029.
- Fortes MB, Owen JA, Raymond-Barker P, et al. Is this elderly patient dehydrated? Diagnostic accuracy of hydration assessment using physical signs, urine, and saliva markers. J Am Med Dir Assoc. 2015;16:221–228.
- Heavens KR, Charkoudian N, O’Brien C, et al. Noninvasive assessment of extracellular and intracellular dehydration in healthy humans using the resistance-reactance–score graph method. Am J Clin Nutr. 2016;103:724–729.
- Mehta R, Bihorac A, Selby NM, et al. Establishing a continuum of acute kidney injury – tracing AKI using data source linkage and long-term follow-up: workgroup statements from the 15th ADQI Consensus Conference. Can J Kidney Health Dis. 2016;3:102.
- Ackland GL, Brudney CS, Cecconi M, et al. Perioperative quality initiative consensus statement on the physiology of arterial blood pressure control in perioperative medicine. Br J Anaesth. 2019;122:542–551.
- NHS England. Guidance – commissioning excellent nutrition and hydration. England: NHS; 2015.
- Greene Burger S, Kayser-Jones J, Bell JP. Malnutrition and dehydration in nursing homes: key issues in prevention and treatment. The Commonwealth Fund 2000. Available from: https://www.commonwealthfund.org/publications/fund-reports/2000/jul/malnutrition-and-dehydration-nursing-homes-key-issues-prevention
- Begum MN, Johnson CS. A review of the literature on dehydration in the institutionalized elderly. E Spen Eur E J Clin Nutr Metab. 2010;5:e47–e53.
- Feinsod FM, Levenson SA, Rapp K, et al. Dehydration in frail, older residents in long-term care facilities. J Am Med Dir Assoc. 2004;5:S36–S41.
- Stookey JD, Pieper CF, Cohen HJ. Is the prevalence of dehydration among community-dwelling older adults really low? Informing current debate over the fluid recommendation for adults aged 70 + years. Public Health Nutr. 2005;8:1275–1285.
- Gaspar PM. Water intake of nursing home residents. J Gerontol Nurs. 1999;25:23–29.
- Holben DH, Hassell JT, Williams JL, et al. Fluid intake compared with established standards and symptoms of dehydration among elderly residents of a long-term-care facility. J Am Diet Assoc. 1999;99:1447–1450.
- Chidester J, Spangler A. Fluid intake in the institutionalized elderly. J Am Diet Assoc. 1997;97:23–28.
- Gaspar PM. Comparison of four standards for determining adequate water intake of nursing home residents. Res Theory Nurs Pract. 2011;25:11–22.
- Armstrong-Esther CA, Browne KD, Armstrong-Esther DC, et al. The institutionalized elderly: dry to the bone! Int J Nurs Stud. 1996;33:619–628.
- Kayser-Jones J, Schell ES, Porter C, et al. Factors contributing to dehydration in nursing homes: inadequate staffing and lack of professional supervision. J Am Geriatr Soc. 1999;47:1187–1194.
- Stotts NA, Hopf HW, Kayser-Jones J, et al. Increased fluid intake does not augment capacity to lay down new collagen in nursing home residents at risk for pressure ulcers: a randomized, controlled clinical trial. Wound Repair Regen. 2009;17:780–788.
- Marra MV, Simmons SF, Shotwell MS, et al. Elevated serum osmolality and total water deficit indicate impaired hydration status in residents of long-term care facilities regardless of low or high body mass index. J Acad Nutr Diet. 2016;116:828–836.e2.
- Simmons SF, Alessi C, Schnelle JF. An intervention to increase fluid intake in nursing home residents: prompting and preference compliance. J Am Geriatr Soc. 2001;49:926–933.
- Mentes JC. A typology of oral hydration problems exhibited by frail nursing home residents. J Gerontol Nurs. 2006;32:13–19.
- Wu S-J, Wang H-H, Yeh S-H, et al. Hydration status of nursing home residents in Taiwan: a cross-sectional study. J Adv Nurs. 2011;67:583–590.
- Robinson SB, Rosher RB. Can a beverage cart help improve hydration? Geriatr Nurs. 2002;23:208–211.
- Colling JC, Owen TR, McCreedy MR. Urine volumes and voiding patterns among incontinent nursing home residents. Geriatr Nurs (Minneap). 1994;15:188–192.
- Spangler PF, Risley TR, Bilyew DD. The management of dehydration and incontinence in nonambulatory geriatric patients. J Appl Behav Anal. 1984;17:1307957.
- Fries BE, Hawes C, Morris JN, et al. Effect of the national resident assessment instrument on selected health conditions and problems. J Am Geriatr Soc. 1997;45:994–1001.
- Jensdottir AB, Rantz M, Hjaltadottir I, et al. International comparison of quality indicators in United States, Icelandic and Canadian nursing facilities. Int Nurs Rev. 2003;50:79–84.
- Castle NG, Ferguson JC. What is nursing home quality and how is it measured? Gerontologist. 2010;50:426–442.
- Berg K, Fries BE, Jones R, et al. Identification and evaluation of existing quality indicators that are appropriate for use in long-term care settings. Health Care Financ Rev. 2001;23(4):19–36.
- Hutchinson AM, Milke DL, Maisey S, et al. The Resident Assessment Instrument-Minimum Data Set 2.0 quality indicators: a systematic review. BMC Health Serv Res. 2010;10:166.
- Wolff A, Stuckler D, McKee M. Are patients admitted to hospitals from care homes dehydrated? A retrospective analysis of hypernatraemia and in-hospital mortality. J R Soc Med. 2015;108:259–265.
- Lavizzo-Mourey R, Johnson J, Stolley P. Risk factors for dehydration among elderly nursing home residents. J Am Geriatr Soc. 1988;36:213–218.
- Bennett JA. Dehydration: hazards and benefits. Geriatr Nurs. 2000;21:84–88.
- Bunn D, Jimoh F, Wilsher SH, et al. Increasing fluid intake and reducing dehydration risk in older people living in long-term care: a systematic review. J Am Med Dir Assoc. 2015;16:101–113.
- Warren JL, Bacon WE, Harris T, et al. The burden and outcomes associated with dehydration among US elderly, 1991. Am J Public Health. 1994;84:1265–1269.
- Pash E, Parikh N, Hashemi L. Economic burden associated with hospital postadmission dehydration. J Parenter Enteral Nutr. 2014;38:58S–64S.
- Wakefield BJ, Mentes J, Holman JE, et al. Risk factors and outcomes associated with hospital admission for dehydration. Rehabil Nurs. 2008;33:233–241.
- Wakefield BJ, Mentes J, Holman JE, et al. Postadmission dehydration: risk factors, indicators, and outcomes. Rehabil Nurs. 2009;34:209–216.
- Xiao H, Barber J, Campbell ES. Economic burden of dehydration among hospitalized elderly patients. Am J Health Syst Pharm. 2004;61:2534–2540.
- Kruzikas DT, Jiang HJ, Remus D, et al. Preventable hospitalizations: a window into primary and preventive care, 2000. Agency for Healthcare Research and Quality; 2004.
- Jiang HJ, Russo CA, Barrett ML. Nationwide frequency and costs of potentially preventable hospitalizations, 2006: Statistical Brief #72. Healthcare cost and utilization project statistical briefs. Rockville, MD: Agency for Healthcare Research and Quality; 2006.
- Lešnik A, Piko N, Železnik D, et al. Dehydration of older patients in institutional care and the home environment. Res Gerontol Nurs. 2017;10:260–266.
- Bennett JA, Thomas V, Riegel B. Unrecognized chronic dehydration in older adults: examining prevalence rate and risk factors. J Gerontol Nurs. 2004;30:22–28.
- Jodaitis L, Vaillant F, Snacken M, et al. Orthostatic hypotension and associated conditions in geriatric inpatients. Acta Clin Belg. 2015;70:251–258.
- Ross MA, Compton S, Richardson D, et al. The use and effectiveness of an emergency department observation unit for elderly patients. Ann Emerg Med. 2003;41:668–677.
- Rowat A, Graham C, Dennis M. Dehydration in hospital-admitted stroke patients: detection, frequency, and association. Stroke. 2012;43:857–859.
- Schrock JW, Glasenapp M, Drogell K. Elevated blood urea nitrogen/creatinine ratio is associated with poor outcome in patients with ischemic stroke. Clin Neurol Neurosurg. 2012;114:881–884.
- Thygesen LC, Christiansen T, Garcia-Armesto S, et al. Potentially avoidable hospitalizations in five European countries in 2009 and time trends from 2002 to 2009 based on administrative data. Eur J Public Health. 2015;25:35–43.
- Long CA, Marin P, Bayer AJ, et al. Hypernatraemia in an adult in-patient population. Postgrad Med J. 1991;67:643–645.
- Palevsky PM, Bhagrath R, Greenberg A. Hypernatremia in hospitalized patients. Ann Intern Med. 1996;124:197.
- Abdelhamid A, Bunn D, Copley M. Effectiveness of interventions to directly support food and drink intake in people with dementia: systematic review and meta-analysis. BMC Geriatr. 2016;16:26.
- Bhalla A, Sankaralingam S, Dundas R, et al. Influence of raised plasma osmolality on clinical outcome after acute stroke. Stroke. 2000;31:2043–2048.
- Stookey JD, Purser JL, Pieper CF, et al. Plasma hypertonicity: another marker of frailty? J Am Geriatr Soc. 2004;52:1313–1320.
- Wachtel TJ, Tetu-Mouradjian LM, Goldman DL, et al. Hyperosmolarity and acidosis in diabetes mellitus: a three-year experience in Rhode Island. J Gen Intern Med. 1991;6:495–502.
- Frangeskou M, Lopez-Valcarcel B, Serra-Majem L. Dehydration in the elderly: a review focused on economic burden. J Nutr Health Aging. 2015;19:619–627.
- Mehta RL, Burdmann EA, Cerdá J, et al. Recognition and management of acute kidney injury in the International Society of Nephrology 0by25 Global Snapshot: a multinational cross-sectional study. Lancet. 2016;387:2017–2025.
- Ranucci M, Castelvecchio S, La Rovere MT. Renal function changes and seasonal temperature in patients undergoing cardiac surgery. Chronobiol Int. 2014;31:175–181.
- National Confidential Enquiry into Patient Outcome and Death (NCEPOD). Adding Insult to Injury. London; 2009.
- Thadhani R, Pascual M, Bonventre JV. Acute renal failure. N Engl J Med. 1996;334:1448–1460.
- Uchino S, Bellomo R, Goldsmith D. The meaning of the blood urea nitrogen/creatinine ratio in acute kidney injury. Clin Kidney J. 2012;5:187–191.
- Khalili H, Bairami S, Kargar M. Antibiotics induced acute kidney injury: incidence, risk factors, onset time and outcome. Acta Med Iran. 2013;51:871–878.
- Kateros K, Doulgerakis C, Galanakos SP, et al. Analysis of kidney dysfunction in orthopaedic patients. BMC Nephrol. 2012;13:101.
- Hartz AJ, Kuhn EM, Kayser KL, et al. BUN as a risk factor for mortality after coronary artery bypass grafting. Ann Thorac Surg. 1995;60:398–404.
- Mukand JA, Cai C, Zielinski A, et al. The effects of dehydration on rehabilitation outcomes of elderly orthopedic patients. Arch Phys Med Rehabil. 2003;84:58–61.
- Li L, Lau KS, Ramanathan V, et al. Ileostomy creation in colorectal cancer surgery: risk of acute kidney injury and chronic kidney disease. J Surg Res. 2017;210:204–212.
- Myles PS, Bellomo R, Corcoran T, et al. Restrictive versus liberal fluid therapy for major abdominal surgery. N Engl J Med. 2018;378(24):2263–2274.
- Oksa H, Pasternack A, Pasanen M. Serum urea-creatinine ratio as a prognostic index in hemodialysis patients. Clin Nephrol. 1987;27:125–130.
- De Lima JJ, da Fonseca JA, Godoy AD. Baseline variables associated with early death and extended survival on dialysis. Ren Fail. 1998;20:581–587.
- Lin L-C, Lee J-D, Hung Y-C, et al. Bun/creatinine ratio-based hydration for preventing stroke-in-evolution after acute ischemic stroke. Am J Emerg Med. 2014;32:709–712.
- Lin LC, Yang JT, Weng HH, et al. Predictors of early clinical deterioration after acute ischemic stroke. Am J Emerg Med. 2011;29:577–581.
- Lin W-C, Shih H-M, Lin L-C. Preliminary prospective study to assess the effect of early blood urea nitrogen/creatinine ratio-based hydration therapy on poststroke infection rate and length of stay in acute ischemic stroke. J Stroke Cerebrovasc Dis. 2015;24:2720–2727.
- Bahouth MN, Bahrainwala Z, Hillis AE, et al. Dehydration status is associated with more severe hemispatial neglect after stroke. Neurologist. 2016;21:101–105.
- Liu C-H, Lin S-C, Lin J-R, et al. Dehydration is an independent predictor of discharge outcome and admission cost in acute ischaemic stroke. Eur J Neurol. 2014;21:1184–1191.
- Chang S-W, Huang Y-C, Lin L-C, et al. Effect of dehydration on the development of collaterals in acute middle cerebral artery occlusion. Eur J Neurol. 2016;23:494–500.
- Kim H, Lee K, Choi HA, et al. Elevated blood urea nitrogen/creatinine ratio is associated with venous thromboembolism in patients with acute ischemic stroke. J Korean Neurosurg Soc. 2017;60:620–626.
- Kelly J, Hunt BJ, Lewis RR, et al. Dehydration and venous thromboembolism after acute stroke. QJM. 2004;97:293–296.
- Briongos Figuero S, Jiménez-Mena M, Ortega Marcos J, et al. Dehydration and serum hyperosmolarity as new predictors of mortality after acute coronary syndrome. Int J Cardiol. 2014;172:e472–e474.
- Aronson D, Hammerman H, Beyar R, et al. Serum blood urea nitrogen and long-term mortality in acute ST-elevation myocardial infarction. Int J Cardiol. 2008;127:380–385.
- Maeda H, Michiue T, Zhu B-L, et al. Potential risk factors for sudden cardiac death: an analysis of medicolegal autopsy cases. Leg Med. 2009;11:S263–S265.
- Suarez-Barrientos A, Lopez-Romero P, Vivas D, et al. Circadian variations of infarct size in acute myocardial infarction. Heart. 2011;97:970–976.
- Thornton SN. Overnight dehydration increases the risk of a morning infarct. Heart. 2011;97:1359–1359.
- Wilson M-M, Morley JE. Impaired cognitive function and mental performance in mild dehydration. Eur J Clin Nutr. 2003;57:S24–S29.
- Inouye SK, Viscoli CM, Horwitz RI, et al. A predictive model for delirium in hospitalized elderly medical patients based on admission characteristics. Ann Intern Med. 1993;119:474–481.
- Rudolph JL, Archambault E, Kelly B. A delirium risk modification program is associated with hospital outcomes. J Am Med Dir Assoc. 2014;15:957.e7–957.e11.
- Arinzon Z, Peisakh A, Schrire S, et al. Delirium in long-term care setting: indicator to severe morbidity. Arch Gerontol Geriatr. 2011;52:270–275.
- Rosen T, Connors S, Clark S, et al. Assessment and management of delirium in older adults in the emergency department: literature review to inform development of a novel clinical protocol. Adv Emerg Nurs J. 2015;37:183–196.
- Lin W-L, Chan Y-F, Wang J. Factors associated with the development of delirium in elderly patients in intensive care units. J Nurs Res. 2015;23:1.
- Doherty K, Archambault E, Kelly B, et al. Delirium markers in older fallers: a case-control study. Clin Interv Aging. 2014;9:2013.
- Fonarow GC, Adams KF, Abraham WT, et al. Risk stratification for in-hospital mortality in acutely decompensated heart failure: classification and regression tree analysis. JAMA. 2005;293:572.
- Gotsman I, Zwas D, Planer D, et al. The significance of serum urea and renal function in patients with heart failure. Medicine (Baltimore). 2010;89:197–203.
- Arihan O, Wernly B, Lichtenauer M, et al. Blood Urea Nitrogen (BUN) is independently associated with mortality in critically ill patients admitted to ICU. Rouet P, editor. PLoS One. 2018;13:e0191697.
- Ziemba JB, Matlaga BR. Epidemiology and economics of nephrolithiasis. Investig Clin Urol. 2017;58:299.
- Arnaud MJ. Mild dehydration: a risk factor of constipation? Eur J Clin Nutr. 2003;57:S88–S95.
- Fine MJ, Auble TE, Yealy DM, et al. A prediction rule to identify low-risk patients with community-acquired pneumonia. N Engl J Med. 1997;336:243–250.
- Lim WS, van der Eerden MM, Laing R, et al. Defining community acquired pneumonia severity on presentation to hospital: an international derivation and validation study. Thorax. 2003;58:377–382.
- Wu BU, Bakker OJ, Papachristou GI, et al. Blood urea nitrogen in the early assessment of acute pancreatitis: an international validation study. Arch Intern Med. 2011;171:669–676.
- Buxbaum J, Yan A, Yeh K, et al. Aggressive hydration with lactated Ringer’s solution reduces pancreatitis after endoscopic retrograde cholangiopancreatography. Clin Gastroenterol Hepatol. 2014;12:303–307.e1.
- Ousey K, Cutting KF, Rogers AA, et al. The importance of hydration in wound healing: reinvigorating the clinical perspective. J Wound Care. 2016;25:122–130.
- Beetz R. Mild dehydration: a risk factor of urinary tract infection? Eur J Clin Nutr. 2003;57:S52–S58.
- Hjortrup PB, Haase N, Bundgaard H, et al. Restricting volumes of resuscitation fluid in adults with septic shock after initial management: the CLASSIC randomised, parallel-group, multicentre feasibility trial. Intensive Care Med. 2016;42:1695–1705.
- Kelm DJ, Perrin JT, Cartin-Ceba R, et al. Fluid overload in patients with severe sepsis and septic shock treated with early goal-directed therapy is associated with increased acute need for fluid-related medical interventions and hospital death. Shock. 2015;43:68–73.
- Maitland K, Kiguli S, Opoka RO, et al. Mortality after fluid bolus in African children with severe infection. N Engl J Med. 2011;364:2483–2495.
- Silversides JA, Major E, Ferguson AJ, et al. Conservative fluid management or deresuscitation for patients with sepsis or acute respiratory distress syndrome following the resuscitation phase of critical illness: a systematic review and meta-analysis. Intensive Care Med. 2017;43:155–170.
- The National Heart, Lung and BIARDS (ARDS) CTN. Comparison of two fluid-management strategies in acute lung injury. N Engl J Med. 2006;354:2564–2575.
- Lowell JA, Schifferdecker C, Driscoll DF, et al. Postoperative fluid overload: not a benign problem. Crit Care Med. 1990;18:728–733.
- Arieff AI, Ayus JC, Fraser CL. Hyponatraemia and death or permanent brain damage in healthy children. BMJ. 1992;304:1218–1222.
- Ayus JC, Wheeler JM, Arieff AI. Postoperative hyponatremic encephalopathy in menstruate women. Ann Intern Med. 1992;117:891–897.
- Lane N, Allen K. Hyponatraemia after orthopaedic surgery. BMJ. 1999;318:1363–1364.
- Lobo DN, Bostock KA, Neal KR, et al. Effect of salt and water balance on recovery of gastrointestinal function after elective colonic resection: a randomised controlled trial. Lancet. 2002;359:1812–1818.
- Thacker JKM, Mountford WK, Ernst FR, et al. Perioperative fluid utilization variability and association with outcomes: considerations for enhanced recovery efforts in sample US surgical populations. Ann Surg. 2016;263:502–510.
- Hjortrup PB, Delaney A. Fluid management in the ICU: has the tide turned? Intensive Care Med. 2017;43:237–239.
- Vincent J-L, De Backer D. Circulatory shock. In: Finfer SR, Vincent J-L, editors. N Engl J Med. 2013;369:1726–1734.