
Abstract
Background
The burden of cardiovascular disease (CVD) prompted the American Heart Association to develop a cardiovascular health (CVH) metric as a measure to assess the cardiovascular status of the population. We aimed to assess the association between CVH scores and the risk of CVD mortality among a middle-aged Finnish population.
Methods
We employed the prospective population-based Kuopio Ischemic Heart Disease cohort study comprising of middle-aged men (42–60 years). CVH scores were computed among 2607 participants at baseline and categorized as optimum (0–4), average (5–9), or inadequate (10–14) CVH. Multivariate cox regression models were used to estimate the hazard ratios (HR) and 95% confidence intervals (CIs) of CVH score for cardiovascular mortality.
Results
During a median follow-up period of 25.8 years, 609 CVD mortality cases were recorded. The risk of CVD mortality increased gradually with increasing CVH score across the range 3–14 (p-value for non-linearity =.77). Men with optimum CVH score had HR (95% CI) for CVD mortality of 0.30 (CI 0.21 – 0.42, p < .0001) compared to those with inadequate CVH score after adjustment for conventional cardiovascular risk factors.
Conclusions
CVH score was strongly and continuously associated with the risk of CVD mortality among middle-aged Finnish population and this was independent of other conventional risk factors.
Achieving optimum cardiovascular health score reduces the risk of cardiovascular mortality.
Adopting the American Heart Association’s cardiovascular health metrics is a welcome approach for public health awareness and monitoring of cardiovascular health among Scandinavian population.
Key messages
1. Introduction
Cardiovascular disease (CVD) remains a global health burden and ranks among the top leading causes of mortality worldwide [Citation1]. Lifestyle factors, among other modifiable risk factors, have contributed significantly to CVD [Citation2]. Healthy diet, regular physical activity, and smoking cessation have been reported to reduce mortality by 15–40%, 20–30%, and 50%, respectively [Citation3]. However, as the prevalence of certain life-style related cardiovascular risk factors increases, e.g. diabetes and overweight or obesity, measures for CVD prevention remain crucial [Citation4,Citation5]. There are attempts to combine information on many CVD risk factors to show the importance of the metrics generated when maintained at optimal level, in relation to CVD mortality.
In 2010, the American Heart Association (AHA) proposed and developed a new metric for ideal cardiovascular health (CVH) as a means to assess the cardiovascular status of the population. This metric focused on seven cardiovascular-risk modifiable health behaviours and biological factors, comprising of smoking, body mass index (BMI), physical activity, fasting blood glucose, total cholesterol, blood pressure, and diet. This was part of AHA’s established goal to reduce mortality from CVD and stroke, while improving the cardiovascular health of the American population by 20% by 2020 [Citation6]. Studies have shown inverse associations between CVH status and risk of CVD in both subclinical and clinical settings [Citation7–14].
In Finland, CVD contributes to about 40% of total mortality across all ages and sex [Citation15]. Thus, assessing measures of CVD and their risk for CVD need to be explored and adopted in this population. Studying the applicability of the AHA’s CVH metrics approach may be paramount towards determining effective approaches to reduce CVD mortality among the Finnish population. To the best of our knowledge, the association between CVH metrics and risk of CVD mortality has not yet been assessed in the Finnish population. A recent meta-analysis further substantiated this, showing no prospective study has been done to demonstrate any association between ideal CVH metrics and cardiovascular mortality in any Scandinavian population [Citation16]. Therefore, we aimed to assess the association between CVH metrics (as defined by AHA) and the risk of CVD mortality among a middle-aged Finnish population, and to evaluate the applicability of AHA’s CVH score in this population.
2. Materials and methods
2.1. Study population
This study employed the ongoing prospective population-based Kuopio Ischemic Heart Disease (KIHD) risk factor cohort study. The KIHD was designed to investigate the different risk factors for developing CVD and other chronic diseases among middle-aged and aging men and women in Kuopio and the surrounding communities in Eastern Finland [Citation17,Citation18]. Briefly, the study commenced in 1984 with a baseline sample of 3433 men aged 42–60 years, who were randomly selected from the national population register, out of which 3235 were found to be eligible. At baseline examination between March 1984 and December 1989, 2682 men (82.9% of those eligible) volunteered to participate in this study, 186 did not respond to the invitation and 367 declined to give informed consent. The present analysis is based on 2607 men with non-missing data on CVH metrics, relevant co-variates, and CVD mortality. The research protocol (KIHD) was approved by the Research Ethics Committee of the University of Eastern Finland, Kuopio with reference number 143/97. The study protocol conforms to the ethical guidelines of the Declaration of Helsinki. Informed consent was obtained from all individual participants included in the study.
2.2. Data collection
A self-administered questionnaire was mailed to each participant prior to their visit to the study centre. The participants were then invited to the study centre for interviews and clinical examination. A trained research nurse was responsible for interviewing all the study participants, who also went through a health examination. Nutritional assessment was done using a 4-d food record diary. Information concerning education, type of occupation, smoking status and duration of regular smoking in years, alcohol consumption, and past medical condition was obtained using detailed questionnaires and were checked during medical examination by a physician. Additionally, physical examination including height, weight, and blood pressure (BP) were measured at the baseline. Body mass index was calculated as the weight in kilograms divided by height in meters squared (kg/m2). Resting blood pressure was measured with a random-zero sphygmomanometer (Hawskley, Lancing, UK) between 8 and 10 am after 5 and 10 min of rest in a seated position [Citation19]. The physical activity was measured using questionnaires involving a 12-month leisure activity history (modified from the Minnesota leisure time activity questionnaire), a 7-d leisure time activity recall, the 24-h total activity recording and the occupational activity interview. All metabolic indices were calculated using the product of duration of each activity and the caloric coefficient of the specific activity and intensity class. The intensity was expressed in metabolic units (MET), which is the ratio of metabolic rate during activity to the metabolic rate at rest [Citation20]. Adulthood socioeconomic status (SES) was assessed as a combined measure of income, education, occupation, occupational prestige, material standard of living, and housing conditions. The SES scale ranges from 0 through 25; 0 indicating the highest, and 25 the lowest SES.
2.3. Laboratory methods
Participants provided blood specimens between the hours of 8 and 10 in the morning after having abstained from alcohol ingestion for 3 d, smoking for 12 h, and eating for 12 h. After the subject had rested for 30 min in the supine position, blood sample was drawn from the antecubital vein with Terumo Venoject VT-100PZ vacuum (Terumo Corp., Tokyo, Japan), without the use of tourniquet. The cholesterol contents of serum lipoprotein fractions and triglycerides were measured enzymatically (Boehringer, Mannheim, Germany). Serum high-density lipoprotein cholesterol (HDL-C) and its subfractions were separated from fresh serum samples using ultracentrifugation and precipitation. Blood glucose was measured by glucose dehydrogenase method (Merck, Darmstadt, Germany) after precipitation of proteins by trichloric acetic acid [Citation19].
2.4. Assessment of cardiovascular health metrics
The CVH metrics adopted in this study was in conformity with the newly developed CVH metrics of the AHA, consisting of seven health behaviours and factors including healthy diet score (HDS), BP, physical activity, BMI, smoking status, plasma total cholesterol, and fasting blood glucose [Citation6]. The level of each CVH metric was classified at baseline as ideal, intermediate, or poor (). (1) Healthy diet score: The AHA has considered an “ideal” adult diet as the consumption of four or five of the following: at least 4.5 cups per day of fruits and vegetables, at least two 3.5-ounce servings a week of fish (oily is best), less than 1500 milligrams a day of sodium, fewer than 450 calories (36 ounces) a week of sweets/sugar and at least three 1-ounce servings a day of whole grains. Additional three factors, considered as secondary dietary metrics, are also considered to contribute to a healthy diet. These are: less than 7% of total calories from saturated fat, at least 4 servings a week of nuts, legumes or seeds and none or fewer than 2 servings a week of processed meats [Citation6].
Table 1. Distribution of cardiovascular health metrics among participants and based on cardiovascular mortality.
Based on the available data in the KIHD study, the salt intake for the calculation of the HDS was substituted with the intake of processed meat, which has been shown to contain much salt (sodium) [Citation21]. Therefore, HDS among participants with 4–5 components was considered “ideal”; 2–3 components considered “intermediate” diet; and 0–1 as “poor” adult diet. (2) Blood pressure: Ideal BP was defined as systolic BP < 120 mmHg and diastolic BP < 80 mmHg. Intermediate BP was considered as having systolic BP of 120–139 mmHg or diastolic BP of 80–89 mmHg. Poor BP was defined as a systolic BP ≥ 140 mmHg or diastolic BP ≥ 90 mmHg. (3) Physical activity: Participants were considered to have ideal physical activity when they pursue at least 150 min per week of moderate-intensity physical activity (MET 3–6) or 75 min per week of vigorous intensity aerobic physical activity (MET > 6), or an equivalent combination of moderate- and vigorous-intensity aerobic activities. Intermediate physical activity was considered as having 1–149 min per week of moderate intensity physical activity (MET 3–6) or 1–74 min per week of vigorous intensity aerobic physical activity, or an equivalent combination of both. Poor physical activity was defined as no physical activity. (4) Body mass index: Ideal, intermediate and poor BMI were defined as <25 kg/m2, 25–29 kg/m2 and ≥30 kg/m2, respectively. (5) Smoking status: Ideal smoking status was defined as men who never smoked, whereas previous and current smokers were considered as having intermediate and poor smoking status, respectively. (6) Total cholesterol: Ideal total cholesterol level was <5.18 mmol/l (200 mg/dl), intermediate cholesterol level was 5.18–6.21 mmol/l (200–240 mg/dl), and ≥6.22 mmol/l (240 mg/dl) was considered poor total cholesterol level. (7) Blood glucose: Fasting blood glucose <5.55 mmol/l (100 mg/dl) was considered as ideal, 5.55–6.99 mmol/l (100–125 mg/dl) considered as intermediate, and ≥7.00 mmol/l (126 mg/dl) considered as poor.
The participants were assigned a score of 0 if they met the ideal level, with 1 and 2 for intermediate and poor levels respectively, based on the seven CVH metrics. In total, the metric scores for each subject ranged from 0 to 14, with lower scores representing a better CVH score. These scores were, thus, classified as optimum (0–4), average (5–9), or inadequate (10–14) CVH.
2.5. Cardiovascular disease mortality surveillance
All deaths that occurred from study enrolment to the end of 2014 were checked against the hospital documents, health centre wards, and death certificates. The sources of information were interviews, hospital documents, death certificates, autopsy reports, and medicolegal reports. All CVD deaths were ascertained by a computer linkage to the national death registry using the Finnish personal identification code (social security number), therefore no losses to follow-up was recorded in this study. CVD deaths were coded using International Classification of Diseases, Ninth Revision (ICD-9), and International Statistical Classification of Diseases, 10th Revision (ICD-10) codes. The documents related to the death were cross-checked in detail by two physicians. The Independent Events Committee, masked to clinical data, performed classification of deaths [Citation22].
2.6. Statistical analysis
Descriptive statistics were used to summarize the baseline characteristics of the participants. Baseline characteristics were presented as means (standard deviation, SD) or median (interquartile range, IQR) for continuous variables and number and percentages for categorical variables. To assess differences in baseline characteristics, we used analysis of variance for continuous variables and Chi-squared tests for categorical variables. Multivariate cox regression models were used to estimate the hazard ratios (HRs) and 95% confidence intervals (CIs) of CVH score for cardiovascular mortality after confirmation of no major departure from the proportionality assumptions using Schoenfeld residuals [Citation23]. CVH score was modelled based on the following categories: optimum; average; and inadequate, with inadequate CVH used as the reference comparison. We explored the shape of any dose-response relationship between CVH score (as a continuous variable) and CVD mortality, using restricted cubic spline with knots at the 5th, 35th, 65th, and 95th percentiles of the distribution of CVH score in a multivariate adjusted model.
Hazard ratios were calculated with adjustment for confounders in two models: (i) age, alcohol consumption and SES; (ii) plus HDL-C, use of cholesterol lowering medications, use of antihypertensives, history of CHD, and history of type 2 diabetes mellitus. These covariates were selected based on previously established roles as risk factors and their potential as confounders as a result of their known associations with cardiovascular mortality and also taking into consideration factors used in derivation of the CVH score. All statistical analyses were conducted using Microsoft windows software, IBM SPSS Statistics 25 (SPSS Inc., Chicago, IL). Two-sided p-value <.05 was considered statistically significant.
3. Results
The baseline characteristics of the participants are shown in . The mean age (SD) of the study population was 53.1 (5.1) years. The number of participants (%) in the different categories of the CVH score were as follows: inadequate, 362 (13.9); average, 1879 (72.1); and optimum, 366 (14.0). Among these participants, 658 (25.2%) of them had history of CHD at baseline. During the median follow-up years of 25.8 [IQR 18.4–27.9] years, 609 cases of CVD mortality occurred. Among CVD deaths recorded, 44 (7.2%), 435 (71%), and 130 (21.3%) had optimum, average, and inadequate CVH scores, respectively. The years from baseline to CVD deaths between the groups of CVH score, inadequate, average and optimum, are 15, 17 and 17.6, respectively (Supplementary Table).
Table 2. Baseline characteristics and outcomes of the participants.
The distribution of the CVH metrics among the KIHD study participants showed variations in the individual components and in the number of the ideal CVH metrics (). For the CVH behaviours, 77.9% of the participants attained the ideal physical activity level, 31.3% had ideal BMI, 32.2% never smoked, and <2% met the criteria for an ideal HDS. The cardiovascular health factors showed 12% of the participants had ideal blood pressure, 39% had ideal fasting blood glucose and 25.7% had ideal total cholesterol. However, only one participant achieved all the seven ideal CVH metrics.
A restricted cubic spline curve showed that the risk of CVD mortality increased gradually with increasing CVH score across the range 3–14 (p-value for non-linearity =.774) (). shows the association between CVH score and risk of CVD mortality. In analysis that adjusted for age, alcohol consumption and socioeconomic status, men who had an optimum CVH score had a 70% reduced risk of CVD mortality when compared with those who had an inadequate CVH score (HR: 0.30; 95%CI: 0.21–0.42, p < .0001). After further adjustment HDL-C, use of cholesterol lowering medication, use of antihypertensive medications, history of CHD and history of type 2 diabetes mellitus, (model 2), the association was minimally attenuated (HR: 0.35; 95%CI: 0.24–0.49, p < .0001). In subsidiary analysis that excluded men with any history of CVD at baseline, the respective association remained consistent (HR: 0.35; 95%CI: 0.21–0.59, p < .0001).
Figure 1. Dose–response curve of hazard ratio for cardiovascular disease mortality against cardiovascular health score. Restricted cubic spline functions were analysed with knots located at 5th, 35th 65th and 95th percentiles of cardiovascular health score distribution, with the referecne category set at 3; adjusted for age; alcohol consumption; socioeconomic status; high-density lipoprotein chlesterol; use of cholesterol lowering medications, use of antihypertensives, history of coronary heart disease and history of type 2 diabetes mellitus. The dashed lines represent the 95% confidence intervals. CVD, cardiovascular diseased; CVH, cardiovascular health.
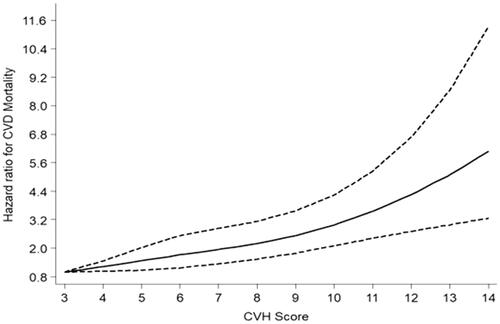
Table 3. Associations between cardiovascular health score and risk of cardiovascular mortality.
4. Discussion
Using the AHA CVH metrics, we have assessed the association between CVH score and risk of CVD mortality among an apparently healthy Scandinavian population. The study showed that men with an optimum or average CVH score had substantially lower risk of CVD mortality when compared with men with inadequate CVH score. The associations were independent of several established risk factors. Additionally, this finding remained persistent after the exclusion of men with any history of CVD at baseline. A dose–response analysis showed that the risk of CVD mortality increased gradually with increasing CVH score across the range 3–14.
Our recent findings are consistent with earlier studies conducted in other populations. In the Northern Manhattan Study, the relationship between the number of ideal CVH metrics and the risk of CVD was studied. The study revealed that there was a 59% lower risk of CVD events and 41% lower risk of all-cause mortality among participants with 5–7 ideal CVH metrics, when compared with those having 0–1 ideal CVH metrics [Citation10]. Similar results were seen using data from the National Health and Nutrition Examination Survey, where participants who had at least five ideal CVH metrics had reduced mortality from diseases of the circulatory system when compared to those who had no ideal health metric. Also, the risk for mortality from CVD was decreased by 88%, when comparing participants with minimum of 5 to those with no ideal CVH metrics [Citation12]. The Framingham Offspring Study reported a similar result, showing a unit increase in CVH score was associated with a 13% reduced risk of CVD. Each participant had the CVH score constructed by recoding the seven metrics, with a score of 1 indicating the ideal category for AHA metrics (versus 0 for non-ideal metric); thus, the CVH score varied from a minimum of 0 (indicating poor CVH) to a maximum of 7 (reflecting ideal cardiovascular health) [Citation7]. This was reverse of the coding of the CVH score in this current study (where 0 was ideal, 1 for intermediate and 2 for poor levels), nevertheless the results were similar. Among the Chinese population, Zhou and colleagues found an inverse association between ideal CVH metrics and risk of many cardiovascular endpoints including total CVD events and deaths from all cause and CVD [Citation24]. Similar findings were observed in the Kailuan Study, where a strong inverse relationship between ideal CVH metrics and risk of CVD was reported, with participants having 6–7 ideal CVH metrics had 82% lower risk for CVD events when compared to those with 0 ideal CVH metrics [Citation25,Citation26].
This study provides further insight on the prevalence of AHA CVH metrics among middle-aged men living in Eastern Finland. The distribution of the individual components of the metrics shows that most men attained the ideal physical activity according to AHA CVH metrics. However, ideal HDS was the least achieved among this KIHD study population. Similar findings have been reported in the United States. For instance, in the Aerobics Center Longitudinal Study (ACLS) cohort [Citation27], and the Mediators of Atherosclerosis in South Asians Living in America (MASALA) study participants, where more than half of the participants had ideal physical activity while very few achieved the ideal HDS or quality diet [Citation11].
Several studies have reported independent associations of individual risk factors such as physical inactivity, unhealthy diet, smoking, high blood pressure, overweight or obesity and the risk of CVD outcomes [Citation11,Citation28–37]. However, focusing on these factors individually can mask their cumulative effects on CVD mortality. For instance, in the current study, 77.9% of the participants maintained ideal physical activity level, whereas in the same population group, only 1.9% attained the ideal HDS. If physical activity is isolated as an approach to reduce CVD mortality among this population group, it may not achieve the set goal in the prevention of CVD mortality, if healthy diet is not considered and improved. Optimum CVH score compared to inadequate CVH score is strongly associated with reduced risk of CVD mortality among the Scandinavian population. Therefore, AHA CVH metrics is a welcome approach for public health awareness and to monitor the cardiovascular health among Scandinavian population. However, a future study is needed to investigate how CVH score can also be applied in Scandinavian women for the risk of CVD mortality.
4.1. Study limitations
There were some limitations in this study. First, the result cannot be generalized among the entire Scandinavian population, since it did not include women and other ethnicities. Second, the substitution of the salt intake in the AHA-definition with the intake of processed meat might have some effect in the computation of the HDS used in this study. Also, given the long period of follow-up, it is likely that the levels of CVH metrics may change over time, leading to the underestimation of true associations. Nevertheless, the strength of the study lies in the relatively large number of participants, being a representative sample of middle-aged male population in Eastern Finland. They were well characterized and followed-up during the study period with well-documented data.
5. Conclusion
CVH score was strongly and continuously associated with the risk of CVD mortality among a middle-aged Finnish population and this was independent of other conventional risk factors. This shows the value of coexistent effects of risk factor combinations on the risk of fatal CVD events in a male population.
Supplemental Material
Download Zip (42.8 KB)Acknowledgements
The authors thank the staff of the Kuopio Research Institute of Exercise Medicine and the Research Institute of Public Health and University of Eastern Finland, Kuopio, Finland, for the data collection in the study.
Disclosure statement
The authors report no relationships that could be construed as a conflict of interest.
Additional information
Funding
Related Research Data
References
- World Health Organization. The top 10 causes of death. 2017; [accessed 2018 Mar 20]. Available at: http://www.who.int/mediacentre/factsheets/fs310/en/
- Yusuf S, Hawken S, Ounpuu S, et al. Effect of potentially modifiable risk factors associated with myocardial infarction in 52 countries (the INTERHEART study): case-control study. Lancet. 2004;364:937–952.
- Iestra JA, Kromhout D, van der Schouw YT, et al. Effect size estimates of lifestyle and dietary changes on all-cause mortality in coronary artery disease patients: a systematic review. Circulation. 2005;112:924–934.
- Finucane MM, Stevens GA, Cowan MJ, et al. National, regional, and global trends in body-mass index since 1980: systematic analysis of health examination surveys and epidemiological studies with 960 country-years and 9·1 million participants. Lancet. 2011;377:557–567.
- Whiting DR, Guariguata L, Weil C, et al. IDF diabetes atlas: global estimates of the prevalence of diabetes for 2011 and 2030. Diabetes Res Clin Pract. 2011;94:311–321.
- Lloyd-Jones DM, Hong Y, Labarthe D, et al. Defining and setting national goals for cardiovascular health promotion and disease reduction: the American Heart Association's strategic Impact Goal through 2020 and beyond. Circulation. 2010;121:586–613.
- Xanthakis V, Enserro DM, Murabito JM, et al. Ideal cardiovascular health: associations with biomarkers and subclinical disease and impact on incidence of cardiovascular disease in the Framingham Offspring Study. Circulation. 2014;130:1676–1683.
- Polonsky TS, Ning H, Daviglus ML, et al. Association of cardiovascular health with subclinical disease and incident events: the multi-ethnic study of atherosclerosis. J Am Heart Assoc. 2017;6:pii:e004894.
- Folsom AR, Yatsuya H, Nettleton JA, et al. Community prevalence of ideal cardiovascular health, by the American Heart Association definition, and relationship with cardiovascular disease incidence. J Am Coll Cardiol. 2011;57:1690–1696.
- Dong C, Rundek T, Wright CB, et al. Ideal cardiovascular health predicts lower risks of myocardial infarction, stroke, and vascular death across whites, blacks, and hispanics: the northern Manhattan study. Circulation. 2012;125:2975–2984.
- Yang Q, Cogswell ME, Flanders WD, et al. Trends in cardiovascular health metrics and associations with all-cause and CVD mortality among US adults. JAMA. 2012;307:1273–1283.
- Ford ES, Greenlund KJ, Hong Y. Ideal cardiovascular health and mortality from all causes and diseases of the circulatory system among adults in the United States. Circulation. 2012;125:987–995.
- Ommerborn MJ, Blackshear CT, Hickson DA, et al. Ideal cardiovascular health and incident cardiovascular events: the Jackson Heart Study. Am J Prev Med. 2016;51:502–506.
- Gaye B, Canonico M, Perier M, et al. Ideal cardiovascular health, mortality, and vascular events in elderly subjects: the Three-City Study. J Am Coll Cardiol. 2017;69:3015–3026.
- World Health Organization. Noncommunicable Diseases (NCD) Country Profiles 2014. [2018 Aug 5]. Available at: http://www.who.int/nmh/countries/fin_en.pdf?ua=1
- Guo L, Zhang S. Association between ideal cardiovascular health metrics and risk of cardiovascular events or mortality: a meta-analysis of prospective studies. Clin Cardiol. 2017;40:1339–1346.
- Salonen JT. Is there a continuing need for longitudinal epidemiologic research? The Kuopio Ischaemic Heart Disease Risk Factor Study. Ann Clin Res. 1988;20:46–50.
- Laukkanen JA, Willeit P, Kurl S, et al. Elevated systolic blood pressure during recovery from exercise and the risk of sudden cardiac death. J Hypertens. 2014;32:659–666.
- Salonen JT, Nyyssönen K, Korpela H, et al. High stored iron levels are associated with excess risk of myocardial infarction in eastern Finnish men. Circulation. 1992;86:803–811.
- Lakka TA, Salonen JT. Intra-person variability of various physical activity assessments in the Kuopio Ischaemic Heart Disease Risk Factor Study. Int J Epidemiol. 1992;21:467–472.
- Susic D, Frohlich ED. Salt consumption and cardiovascular, renal, and hypertensive diseases: clinical and mechanistic aspects. Curr Opin Lipidol. 2011;23:11–16.
- Kunutsor SK, Khan H, Laukkanen T, et al. Joint associations of sauna bathing and cardiorespiratory fitness on cardiovascular and all-cause mortality risk: a long-term prospective cohort study. Ann Med. 2018;50:139–146.
- Therneau TM, Grambsch PM. Modeling survival data: extending the Cox Model. New York: Springer-Verlag; 2000.
- Zhou L, Zhao L, Wu Y, et al. Ideal cardiovascular health metrics and its association with 20-year cardiovascular morbidity and mortality in a Chinese population. J Epidemiol Community Health. 2018;72:752–758.
- Wu S, Huang Z, Yang X, et al. Prevalence of ideal cardiovascular health and its relationship with the 4-year cardiovascular events in a northern Chinese industrial city. Circ Cardiovasc Qual Outcomes. 2012;5:487–493.
- Liu Y, Chi H, Cui L, et al. The ideal cardiovascular health metrics associated inversely with mortality from all causes and from cardiovascular diseases among adults in a Northern Chinese industrial city. PLoS One. 2014;9:e89161.
- Artero EG, España-Romero V, Lee D, et al. Ideal cardiovascular health and mortality: Aerobics Center Longitudinal Study. Mayo Clin Proc. 2012;87:944–952.
- Jahangir E, De Schutter A, Lavie CJ. Low weight and overweightness in older adults: risk and clinical management. Prog Cardiovasc Dis. 2014;57:127–133.
- Stevens SL, Wood S, Koshiaris C, et al. Blood pressure variability and cardiovascular disease: systematic review and meta-analysis. BMJ. 2016;354:i4098.
- Buttar HS, Li T, Ravi N. Prevention of cardiovascular diseases: role of exercise, dietary interventions, obesity and smoking cessation. Exp Clin Cardiol. 2005;10:229–249.
- Lichtenstein AH, Appel LJ, Brands M, et al. Diet and lifestyle recommendations revision 2006: a scientific statement from the American Heart Association Nutrition Committee. Circulation. 2006;114:82–96.
- Cepeda-Valery B, Pressman GS, Figueredo VM, et al. Impact of obesity on total and cardiovascular mortality-fat or fiction? Nat Rev Cardiol. 2011;8:233–237.
- Taghizadeh N, Vonk JM, Boezen HM. Lifetime smoking history and cause-specific mortality in a cohort study with 43 years of follow-up. PLoS One. 2016;11:e0153310.
- Artham SM, Lavie CJ, Milani RV, et al. The obesity paradox: impact of obesity on the prevalence and prognosis of cardiovascular diseases. Postgrad Med. 2008;120:34–41.
- Carter BD, Abnet CC, Feskanich D, et al. Smoking and mortality-beyond established causes. N Engl J Med. 2015;372:631–640.
- Warburton DER, Nicol CW, Bredin S. Health benefits of physical activity: the evidence. CMAJ: Can Med Assoc J. 2006;174:801.
- Park S, Lee J, Kang DY, et al. Indoor physical activity reduces all-cause and cardiovascular disease mortality among elderly women. J Prev Med Public Health. 2012;45:21.