
Abstract
Aims: We investigated the combination of low systolic blood pressure (SBP) response, low exercise capacity (EC) and slow heart rate recovery (HRR) during an exercise test in mortality prediction.
Patients and methods: Our population consisted of 3456 patients from the Finnish Cardiovascular Study. A failure of SBP to increase >42 mmHg was defined as a low response. Low EC was defined as < 8 metabolic equivalents. 1-minute HRR ≤18 bpm from maximum was defined as slow HRR.
Results: During a median follow up of 10.0 years, 537 participants died. Reduced SBP response, low EC and slow HRR were independent predictors of all-cause and CV mortality (p < .001 for all). Patients with reduced SBP response, low EC and slow HRR had a very high mortality rate of 42.1% during follow up compared to only 4.5% of the patients without any of these risk factors. The hazard ratios for all-cause mortality in patients with one, two or three of the studied risk factors were 3.2, 6.0, and 10.6, respectively (p < .001 for all).
Conclusion: The combination of reduced SBP response, low exercise capacity, and reduced HRR in an exercise test is associated with very high mortality and can be used in risk stratification.
The combination of low blood pressure response, low exercise capacity and slow heart rate recovery in an exercise test is able to identify a group of patients in a very high mortality risk.
These parameters are easily derived from an exercise test.
All parameters are commonly available in clinical practice.
Key messages
1. Introduction
The clinical exercise test is a rather simple, low-cost and safe procedure. Traditionally ST-segment analysis from the electrocardiogram (ECG) during the test has been used for predicting the probability of coronary heart disease (CHD). However, the prognostic value of an exercise test has been more essential in recent studies. It has been shown that low or negative systolic blood pressure (SBP) response during exercise [Citation1–3], low exercise capacity (EC) [Citation4–10] and slow heart rate recovery (HRR) [Citation4–7,Citation11–15] after the test are independent predictors of all-cause and cardiovascular (CV) mortality, even when adjusted for other common CV risk factors. Combining the information from HRR and EC has been reported to enhance the prognostic capacity of an exercise test [Citation4,Citation5,Citation16,Citation17]. The incorporation of chronotropic incompetence [Citation4,Citation17] and resting heart rate [Citation4] or T-wave alternans [Citation16] to HRR and EC data further improved the prognostic evaluation. To the best of our knowledge, no prior studies have combined reduced (low or negative) SBP response, EC and the rate of HRR during an exercise test to predict mortality. The aim of this study was to determine whether this combination of risk factors improves the prognostic assessment, especially regarding mortality.
2. Patients and methods
2.1. Study cohort
All patients (n = 4178) referred for a routine exercise test between October 2001 and December 2008 at Tampere University Hospital and willing to participate were enrolled in the Finnish Cardiovascular Study (FINCAVAS). The FINCAVAS study design has been described in detail previously [Citation18]. The main indications for the exercise test were suspected CHD (47%), evaluation of CV performance (26%), palpitation (25%), adequacy of CHD treatment (13%), preoperative assessment (9%) and the evaluation of risk after myocardial infarction (8%). We excluded 217 patients with either atrial fibrillation/flutter or a pacemaker due to unreliable assessment of HRR. Additionally, patients without reliable follow-up data were excluded. 3456 of the remaining patients (2067 men and 1389 women) had technically successful bicycle ergometer exercise tests and were recruited in the present study. The exercise test was considered technically successful if storing of the hemodynamic data was successful and the objective exercise level was maximal or almost maximal (the other categories of an objective exercise level were reasonable and small). The test was symptom limited. Main reasons for termination of the test were fatigue (64%), dyspnoea (12%) and chest pain (6%). The Ethical Committee of the Tampere University Hospital District (Finland) approved the study protocol, and all patients gave an informed consent prior to the test as stipulated in the Declaration of Helsinki.
2.2. Exercise test protocol
The medical history of each patient was collected with a questionnaire. The patients remained in the supine position for 10 min prior to the exercise test. At the end of the resting period, SBP was measured with a brachial cuff, and the systolic value was used in the analyses as a measurement for resting SBP. The exercise test was performed using a bicycle ergometer with electrical brakes. The initial workload varied from 20 watts (W) to 30 W, and the load was increased by 10–30 W every minute. The protocol was chosen by the supervising physician depending on the presumed fitness level of the patient. The targeted length of the exercise was approximately 10 minutes [Citation19]. Exercise was stopped abruptly without a cool-down phase. During the test, the heart rate was continuously recorded with the ECG, whereas the blood pressure was measured manually every 2 min. The value of SBP at peak exercise was used in the analyses to calculate the SBP response. Peak SBP value was measured as close to the termination of the test as possible, even if the 2 minute interval from the previous measurement was not reached.
2.3. SBP response, EC and HRR
Reduced SBP response was defined as a failure of SBP to increase >42 mmHg at peak exercise compared to SBP at rest. The cut-off point was defined as the lower quartile value (Q1) of the exercise SBP response in our cohort. A similar cut-off point definition for SBP response in an exercise test has been used previously [Citation3].
EC was assessed in metabolic equivalents (METs). METs were estimated on the standardised basis of maximum workload and weight of the patient, with 1 MET equivalent to 3.5 mL oxygen uptake/kilogram/min. We used a cut-off point of < 8 METs as a definition of low EC based on previous studies [Citation5,Citation20,Citation21].
HRR was calculated by reducing heart rate at 1 minute after exercise from maximal heart rate. Slow HRR response was defined as ≤18 bpm. This cut-off point was based on previous studies taking into account the absence of a cool-down period after the exercise [Citation22–26].
2.4. Follow-up
All-cause mortality data was collected from the electronic medical record system of Tampere University Hospital. In addition, death certificates were received from the Causes of Death Register maintained by Statistics Finland. This has been shown to be a reliable source [Citation27]. The certificates included causes of death using the 10th revision of the International Classification of Diseases (ICD-10). The diagnosis numbers and certificate texts were used to classify the deaths as all-cause or CV deaths.
2.5. Statistical methods
Chi-square and t-test analyses were performed to compare dichotomous and continuous variables, respectively, between survivors and non-survivors. We used Cox proportional hazard multivariable regression model with continuous variables to investigate independent predictors of all-cause and CV mortality. Variables used in this analysis were SBP response, METs, HRR, age, sex, diabetes, history of myocardial infarction, beta-adrenergic blocker medication (without interruption), smoking, resting SBP, body mass index (BMI), any CV medication, medication for hypercholesterolaemia and history of CHD. Age and BMI did not unconditionally meet the proportional assumption, otherwise proportional assumption was met. Results were calculated also when stratified by age and BMI.
The subjects were classified into four different groups according to the number of the studied risk factors (reduced SBP response, low EC and slow HRR) present (zero, one, two or all three). Unadjusted survival differences between the groups were analysed with log-rank test using Benjamini-Hochberg procedure to account for multiple comparisons. Cox regression was used to calculate hazard ratios (HRs) for mortality in patients with the studied risk factors and their combinations. Cox regression analysis was also performed with age and sex adjustment. HR values were calculated in comparison to patients with none of the risk factors. Classification with SBP, EC and HRR was also compared to classification with EC and HRR only, using C-index [Citation28] to assess improvement in discrimination. To further analyse the additive effect of SBP to MET and HRR in risk classification, we calculated the continuous net reclassification improvement (NRI) and integrated discrimination improvement (IDI). Multicollinearity was controlled by calculating variance inflation factor (VIF) for all predictors in multivariate models. Multivariate models were validated using bootstrapping with 1000 iterations from the original samples to calculate p-values and confidence intervals (CI). Statistical analyses were performed using R software version 3.5.1. p-values under .05 were considered statistically significant.
3. Results
For all-cause mortality, median follow up time was 10.0 years (inter quartile range 8.1–12.1 years) and for CV mortality 8.6 years (inter quartile range 6.7–10.6 years). During the follow up 537 patients died, 209 of them due to a CV cause. Baseline characteristics and exercise test parameters of the study population in survivors and non-survivors are shown in .
Table 1. Baseline characteristics and exercise test parameters of the study population in survivors and non-survivors.
In Cox multivariable regression analyses using continuous variables, low SBP response, low EC and slow HRR were all independent predictors of all-cause and CV mortality (p < .01 for all) (). Age, sex and resting SBP were also independent predictors of both all-cause and CV mortality. Smoking, diabetes and previous myocardial infarction were independent predictors of all-cause mortality only (). Statistically insignificant predictors in Cox multivariable analyses were CHD, BMI, CV medication, medication for hypercholesterolaemia and the information whether possible beta blocker medication had been adequately interrupted prior to the test. Low SBP response, low EC and slow HRR, as dichotomous categorical classifiers, were all independent predictors of all-cause and CV mortality (p < .01 for all). The results remained essentially similar when stratified by age and BMI (data not shown).
Table 2. Significant predictors for all-cause and cardiovascular mortality in Cox multivariable regression analysis.
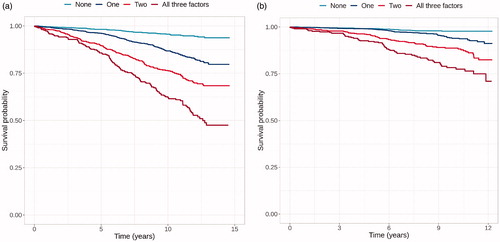
We applied categorical classification of the patients using reduced SBP response, low EC and slow HRR as risk factors. Of the study population, 1279 individuals had none of the studied risk factors, while 1254, 614 and 309 patients had one, two or three risk factors, respectively. There was a steep rising trend in all-cause and CV mortality as the number of risk factors increased. Of the patients with reduced SBP response, low EC and slow HRR, 42.1% died during follow up compared to only 4.5% of the patients without any of these risk factors. In the patients with all three risk factors, CV mortality during follow up was 18.4% compared to 1.9% in patients with none of the risk factors.
Unadjusted Kaplan-Meier survival curves for all-cause and CV mortality in patients with different number of risk factors are shown in . In pair-wise comparisons there was a statistically significant decrease in survival after each increase in the amount of risk factors (p < .001 for all).
Figure 1. Kaplan-Mayer survival curves for all-cause (a) and CV (b) mortality in patients with zero, one, two or three of the studied risk factors (low SBP response, low exercise capacity, slow heart rate recovery).
We calculated the HRs for mortality, in patients with different combinations of the studied risk factors, in comparison to patients with none of the risk factors. In patients with all three risk factors the HRs (95% CI) for all-cause () and CV () mortality were 10.6 (7.8–14.4) and 10.6 (6.6–17.1), respectively. There was a rising trend in HRs as the number of risk factors increased. In patients with low EC and slow HRR, HRs for all-cause () and CV () mortality were 7.8 (6.1–10.0) and 9.4 (6.3–14.2), respectively. This combination yielded the highest HRs for any of the two risk factor combinations. We also calculated the age- and sex-adjusted HRs. As expected, the absolute HRs were smaller after adjustments. However, the trend and proportions of HR values remained similar (). Number of patients and deaths in different combinations of the studied risk factors are shown in Supplemental Table 1. For predicted 5-year mortality risk, C-index using two risk factors (low EC and slow HRR) and all three risk factors were 0.699 and 0.705, respectively. The addition of low SBP response to MET and HRR also showed an improvement in the continuous NRI and IDI (NRI [CI]: 0.151 [0.069–0.233], p-value < 0.001 and IDI 0.008 [0.004 - 0.011], p-value < 0.001). None of the predictors in any multivariate model had VIF greater than 5.
Table 3. Hazard ratios (95% confidence intervals) for all-cause and cardiovascular mortality in different combinations of the studied risk factors. HRs are in comparison to patients with none of the risk factors.
4. Discussion
The clinical exercise test is a widely used and important diagnostic method in CV disease, especially CHD. Several parameters are routinely derived from the test and used to evaluate the risk for CV events and mortality. For such a widely used examination, it is extremely important that parameters used in the interpretation are reliable, reproducible, and easily measured. Moreover, cut-off points for different variables are important to enable reasonable clinical decision-making. Decreased EC [Citation4–10,Citation17], slow HRR [Citation4–7,Citation12–15,Citation17] and reduced SBP response [Citation1–3] in an exercise test are well-known and reliable predictors of CV events and mortality. In this regard, findings from the present study are in line with the previous literature. However, the predictive value of combining these three risk markers has not been studied in detail to this date. Our main objective was to investigate whether combining three easily obtained parameters SBP response, EC and HRR from an exercise test improves risk stratification that could be incorporated into clinical routine. Furthermore, we wanted to study if inclusion of SBP response could enhance the predictive power of this important diagnostic tool when combined to the more established risk factors, low EC and slow HRR.
Previously, several authors have investigated different combinations of parameters derived from the clinical exercise test. Mora et al. showed from a large prospective study that the combination of slow HRR and low EC yielded a substantially higher risk for all-cause and CV mortality than either of the risk factors alone [Citation29]. Similar results have been reported from our cohort [Citation16]. The latter study added T-wave alternans measurements to HRR and EC data reaching even higher predictive value for mortality. Kiviniemi et al. found in their population of patients with stable coronary artery disease that a risk score including EC, HRR and maximal chronotropic response enhanced the power of an exercise test to predict CV mortality [Citation17]. Indeed, the combination of low EC and slow HRR yielded the highest predictive value for any combination of two risk factors also in our study.
We used reduced SBP, low EC and slow HRR as categorical variables to define risk groups according to the number of risks factors present. This divided the subjects into four distinct risk groups. To the best of our knowledge, the additional value of reduced SBP response over low EC and slow HRR in the prediction of mortality has not been studied before in this manner. All-cause mortality increased from 26.5% in patients with any combination of two of the studied risk factors to 42.1% in patients with all three risk factors. The respective increase in HR was 1.8-fold. Accordingly, CV mortality increased from 11.1% to 18.4% and the respective increase in HR was 1.8-fold. In subjects with none of the risk factors, both CV mortality and all-cause mortality was very low (1.9% and 4.5%, respectively).
Our findings suggest that it is possible to identify a very high-risk group of patients from an exercise test by taking the three studied variables into account. Furthermore, our findings also have plausible biological explanations. Severe CHD, severe ventricular dysfunction and aortic or mitral valve stenosis have been proposed as possible mechanisms for reduced SBP response [Citation3]. On the other hand, the rate of HRR has been theorised to be related to the vagal tone after exercise [Citation22]. EC might be the most versatile parameter as it reflects the status of several organ systems during physical exercise. Low EC could be due to multiple reasons, e.g. cardiac insufficiency, respiratory diseases, inadequate peripheral circulation, anaemia or skeletal muscle fatigue [Citation30]. It is likely that underlying mechanisms behind reduced SBP and HRR are more complex than the above mentioned. Consequently, these variables are affected by different physiological and pathological mechanisms explaining the additive value of each parameter on mortality risk.
There were limitations with this study. We do not know whether the patient characteristics changed during the follow-up period. Also, we cannot assess causality from an observational study. In addition, corresponding to the majority of the Finnish population, our cohort consisted of mainly white Caucasians, and the results cannot be directly generalised to other populations. Cut-off points created for continuous risk variables are always more or less arbitrary. However, cut-off points used in the present study were derived either from the previous literature (HRR, EC) or based on the distribution of the variable in our cohort (SBP response). Moreover, cut-off points are widely used, and in many situations, they are necessary for clinical decision-making. We also tested the results with continuous variables and they were consistent to those derived from the cut-offs (data not shown). SBP response may vary depending on the exercise test protocol [Citation19]. In our study the initial workload and the increase in the load per minute varied as explained in the methods section. However, all studies were performed on the bicycle ergometer as it is more reliable to measure SBP when compared to SBP measurement during a treadmill test. Furthermore, the amount of initial workload and the increase in the load was chosen in order to keep the length of the exercise close to 10 min. Nevertheless, our results may not be generalised to exercise testing using different exercise protocols.
In conclusion, we have shown that reduced SBP response in an exercise test substantially strengthens the prognostic value of the test regarding mortality beyond low EC and slow HRR in a Finnish population. Although these findings must be verified in other populations, the combination of these three risk variables seems to identify a group of very high-risk patients from an exercise test. All these parameters are commonly available in clinical practice and can be easily measured on site during the test. We believe that our findings give clinicians a useful tool in stratifying patients to high and low risk categories.
Acknowledgements
The authors thank the staff of the Department of Clinical Physiology in the Tampere University hospital for collecting the exercise test data.
Disclosure statement
No potential conflict of interest was reported by the authors.
Additional information
Funding
References
- Gupta MP, Polena S, Coplan N, et al. Prognostic significance of systolic blood pressure increases in men during exercise stress testing. Am J Cardiol. 2007;100(11):1609–1613.
- de Liefde II, Hoeks SE, van Gestel YR, et al. Prognostic value of hypotensive blood pressure response during single-stage exercise test on long-term outcome in patients with known or suspected peripheral arterial disease. Coron Artery Dis. 2008;19(8):603–607.
- Barlow PA, Otahal P, Schultz MG, et al. Low exercise blood pressure and risk of cardiovascular events and all-cause mortality: systematic review and meta-analysis. Atherosclerosis. 2014;237(1):13–22.
- Ho JS, Fitzgerald SJ, Barlow CE, et al. Risk of mortality increases with increasing number of abnormal non-ST parameters recorded during exercise testing. Eur J Cardiovasc Prev Rehabil. 2010;17(4):462–468.
- Mora S, Redberg RF, Cui Y, et al. Ability of exercise testing to predict cardiovascular and all-cause death in asymptomatic women: a 20-year follow-up of the lipid research clinics prevalence study. JAMA. 2003;290(12):1600–1607.
- Aktas MK, Ozduran V, Pothier CE, et al. Global risk scores and exercise testing for predicting all-cause mortality in a preventive medicine program. JAMA. 2004;292(12):1462–1468.
- Dhoble A, Lahr BD, Allison TG, et al. Cardiopulmonary fitness and heart rate recovery as predictors of mortality in a referral population. J Am Heart Assoc. 2014;3(2):e000559.
- Kavanagh T, Mertens DJ, Hamm LF, et al. Prediction of long-term prognosis in 12 169 men referred for cardiac rehabilitation. Circulation. 2002;106(6):666–671.
- Gulati M, Pandey DK, Arnsdorf MF, et al. Exercise capacity and the risk of death in women: the St James Women Take Heart Project. Circulation. 2003;108(13):1554–1559.
- Salokari E, Laukkanen JA, Lehtimaki T, et al. The Duke treadmill score with bicycle ergometer: exercise capacity is the most important predictor of cardiovascular mortality. Eur J Prev Cardiolog. 2019;26(2):199–207.
- Cole CR, Blackstone EH, Pashkow FJ, et al. Heart-rate recovery immediately after exercise as a predictor of mortality. N Engl J Med. 1999;341(18):1351–1357.
- Vivekananthan DP, Blackstone EH, Pothier CE, et al. Heart rate recovery after exercise is a predictor of mortality, independent of the angiographic severity of coronary disease. J Am Coll Cardiol. 2003;42(5):831–838.
- Wandell PE, Carlsson AC, Theobald H. Effect of heart-rate recovery on long-term mortality among men and women. Int J Cardiol. 2010;144(2):276–279.
- Nishime EO, Cole CR, Blackstone EH, et al. Heart rate recovery and treadmill exercise score as predictors of mortality in patients referred for exercise ECG. JAMA. 2000;284(11):1392–1398.
- Sydo N, Sydo T, Gonzalez Carta KA, et al. Prognostic performance of heart rate recovery on an exercise test in a primary prevention population. J Am Heart Assoc. 2018;7(7):pii: e008143.
- Minkkinen M, Nieminen T, Verrier RL, et al. Prognostic capacity of a clinically indicated exercise test for cardiovascular mortality is enhanced by combined analysis of exercise capacity, heart rate recovery and T-wave alternans. Eur J Prev Cardiolog. 2015;22(9):1162–1170.
- Kiviniemi AM, Lepojarvi S, Kentta TV, et al. Exercise capacity and heart rate responses to exercise as predictors of short-term outcome among patients with stable coronary artery disease. Am J Cardiol. 2015;116(10):1495–1501.
- Nieminen T, Lehtinen R, Viik J, et al. The Finnish Cardiovascular Study (FINCAVAS): characterising patients with high risk of cardiovascular morbidity and mortality. BMC Cardiovasc Disord. 2006;6 (1):9.
- Laukkanen JA, Kurl S. Blood pressure responses during exercise testing-is up best for prognosis? Ann Med. 2012;44(3):218–224.
- Minkkinen M, Nieminen T, Verrier RL, et al. Impaired exercise capacity predicts sudden cardiac death in a low-risk population: enhanced specificity with heightened T-wave alternans. Ann Med. 2009;41(5):380–389.
- Hagnas MJ, Lakka TA, Kurl S, et al. Cardiorespiratory fitness and exercise-induced ST segment depression in assessing the risk of sudden cardiac death in men. Heart. 2017;103(5):383–389.
- Shetler K, Marcus R, Froelicher VF, et al. Heart rate recovery: validation and methodologic issues. J Am Coll Cardiol. 2001;38(7):1980–1987.
- Bilsel T, Terzi S, Akbulut T, et al. Abnormal heart rate recovery immediately after cardiopulmonary exercise testing in heart failure patients. Int Heart J. 2006;47(3):431–440.
- Watanabe J, Thamilarasan M, Blackstone EH, et al. Heart rate recovery immediately after treadmill exercise and left ventricular systolic dysfunction as predictors of mortality: the case of stress echocardiography. Circulation. 2001;104(16):1911–1916.
- Nieminen T, Leino J, Maanoja J, et al. The prognostic value of haemodynamic parameters in the recovery phase of an exercise test. The Finnish Cardiovascular Study. J Hum Hypertens. 2008;22(8):537–543.
- Leino J, Minkkinen M, Nieminen T, et al. Combined assessment of heart rate recovery and T-wave alternans during routine exercise testing improves prediction of total and cardiovascular mortality: the Finnish Cardiovascular Study. Heart Rhythm. 2009;6(12):1765–1771.
- Pajunen P, Koukkunen H, Ketonen M, et al. The validity of the Finnish Hospital Discharge Register and Causes of Death Register data on coronary heart disease. Eur J Cardiovasc Prev Rehabil. 2005;12(2):132–137.
- Gerds TA, Kattan MW, Schumacher M, et al. Estimating a time-dependent concordance index for survival prediction models with covariate dependent censoring. Statist Med. 2013;32(13):2173–2184.
- Mora S, Redberg RF, Sharrett AR, et al. Enhanced risk assessment in asymptomatic individuals with exercise testing and Framingham risk scores. Circulation. 2005;112(11):1566–1572.
- Adachi H. Cardiopulmonary Exercise Test. Int Heart J. 2017;58(5):654–665.