
Abstract
Purpose
The aim was to investigate whether serum uric acid (SUA) was associated with incident hypercholesterolaemia and hypertriglyceridaemia in middle-aged and older Chinese.
Methods
This prospective cohort study used data from the China Health and Retirement Longitudinal Study. A total of 6,063 participants were included, who were free of hypercholesterolaemia and hypertriglyceridaemia at baseline (2011) and were followed until 2015. Natural cubic spline models were conducted to investigate the dose-response association of SUA with incident hypercholesterolaemia and hypertriglyceridaemia. Moreover, SUA was categorized into four groups according to gender-specific quartiles. Log-binomial regression was performed to explore the association of SUA with hypercholesterolaemia and hypertriglyceridaemia, with the quartile 1 as a reference.
Results
After full adjustment, we observed a positive linear dose-response relationship between SUA and hypercholesterolaemia and hypertriglyceridaemia. Compared with the quartile 1 of SUA, the adjusted risk ratios (95% confidence interval) of hypertriglyceridaemia were 1.15 (0.95–1.39), 1.23 (1.02–1.49) and 1.31 (1.08–1.59) for quartile 2–4 (p-value for trend = .004), respectively. Whereas, we failed to find SUA significantly associated with hypercholesterolaemia. Sex-stratified analyses indicated that the association of SUA with hypertriglyceridaemia was more evident in the female.
Conclusions
These findings suggest that SUA may be positively associated with incident hypertriglyceridaemia.
The natural cubic spline model showed a positive linear dose-response relationship between serum uric acid levels and hypertriglyceridaemia.
Compared with the quartile 1 of SUA, the adjusted risk ratios (95% confidence interval) of hypertriglyceridaemia were 1.15 (0.95–1.39), 1.23 (1.02–1.49) and 1.31 (1.08–1.59) for quartile 2–4 (p-value for trend = .004), respectively.
Sex-stratified analyses indicated that the association of serum uric acid with hypertriglyceridaemia was more evident in the female.
KEY MESSAGES
Introduction
Hyperlipidaemia refers to a systemic metabolic disorder in which the concentration of total cholesterol (TC) and triglyceride (TG) in plasma significantly increase due to abnormal fat metabolism or fat transport [Citation1]. Subtypes of hyperlipidaemia include hypercholesterolaemia and hypertriglyceridaemia. Excessive energy intake and unhealthy dietary habits have made hypercholesterolaemia and hypertriglyceridaemia the most prominent global chronic disease today [Citation2]. Besides, hyperlipidaemia is considered to be one of the major risk factors for cardiovascular disease (CVD), such as myocardial infarction, angina pectoris, stroke and atherosclerosis [Citation3]. Patients with hyperlipidaemia are about twice as likely to have CVD as normal people [Citation4].
As a final enzymatic product of purine metabolism, serum uric acid (SUA) is related to CVD events, including obesity, diabetes, hypertension, stroke and metabolic syndrome [Citation5–9]. However, whether SUA is linked with hypercholesterolaemia or hypertriglyceridaemia has not been fully elucidated. Two cross-sectional studies from China and America reported that elevated SUA levels were associated with hypertriglyceridaemia [Citation10,Citation11]. Additionally, one prospective cohort study conducted in China, showed that elevated SUA levels may increase the risk of hypertriglyceridaemia [Citation12]. A retrospective 5-year cohort study of healthy Japanese adults reported that an elevated SUA increased the risk for developing high low-density lipoprotein cholesterol, as well as hypertriglyceridaemia [Citation13]. Nevertheless, a cross-sectional study from China failed to find that SUA levels related to hyperlipidaemia [Citation14]. Moreover, as far as we know, there is no study to explore the dose-response association of SUA levels with hypercholesterolaemia or hypertriglyceridaemia.
Therefore, we conducted a large prospective cohort study to investigate whether SUA was associated with incident hypercholesterolaemia and hypertriglyceridaemia in middle-aged and older Chinese. Besides, we evaluated the dose-response association of SUA with incident hypercholesterolaemia and hypertriglyceridaemia.
Materials and methods
Study population
We used data from the China Health and Longitudinal Retirement Survey (CHARLS), which was described in detail previously [Citation15]. Briefly, the CHARLS was a national population-based survey conducted by the National School of Development of Peking University and involved 17,708 participants (≥45 years) from 150 counties in 28 provinces. The response rate reached 80.5%. The CHARLS collected detailed information on a wide range of fields, including demographics, health status and so on [Citation15]. The current prospective cohort study used data from baseline (2011), the first (2013) and second (2015) follow-up surveys.
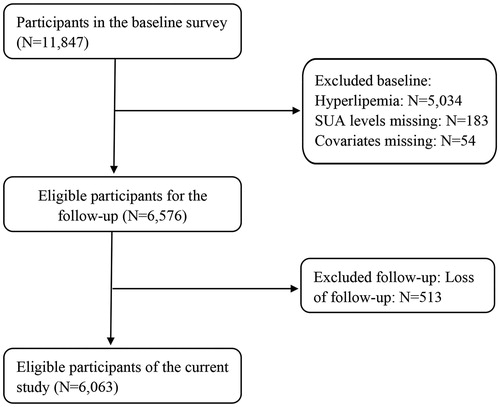
A total of 11,847 participants agreed and completed baseline questionnaires, medical examinations, and provided blood samples in 2011. After excluding participants with hypercholesterolaemia or hypertriglyceridaemia at baseline (n = 5,034, including 913 participants using antihyperlipidemic medications) and missing value on SUA levels (n = 183) and other covariates (n = 54), 6,576 individuals were included in the follow-up. Since 513 of them were lost, a total of 6,063 participants were eligible for the final analysis. According to the Chinese guidelines on the prevention and treatment of dyslipidemia in adults (2016) [Citation1], participants at baseline were considered to suffer from hypercholesterolaemia if they met at least one of the following criteria: (1) TC ≥5.20 mmol/L, and (2) usage of antihyperlipidemic medications. Participants at baseline were considered to suffer from hypertriglyceridaemia if they met at least one of the following criteria: (1) TG ≥1.70 mmol/L, and (2) usage of antihyperlipidemic medications. The details of the participants’ selection process are presented in . The ethical review committee of Peking University reviewed and approved the CHARLS, and all individuals filled out the informed consent form [Citation16].
Figure 1. Flow chart of this prospective cohort study. SUA: serum uric acid.
Assessment of SUA levels
The participants were invited to township hospitals or a district CDC, where trained medical staffs took 8-mL samples of fasting blood according to the standard protocol. All blood samples were transported to the CDC in Beijing within 2 weeks and stored at −80 °C until analysis at Capital Medical University laboratory [Citation17,Citation18]. According to gender-specific quartiles, SUA levels were categorized into four groups: <237, 237–280, 281–330 and ≥331 μmol/L for males; <190, 190–221, 222–260 and ≥261 μmol/L for females.
Assessment of covariates
Age (continuous), gender (males and females), nation (Han nationality and minority nationality), current marital status (married or not), educational levels (no formal education or illiterate, primary school, finished primary school, and junior high school or above), place of residence (urban and rural), smoking status (current smokers, former smokers and never smokers) and drinking status (regular drinkers, occasional drinkers, former drinkers and never drinkers) were obtained through a self-report questionnaire. Participants who had smoked ≥100 cigarettes during their lifetime and currently smoked were considered as current smokers; those who had completely quit smoking but had smoked ≥100 cigarettes in their lifetime were considered as former smokers. Regular drinkers were defined as those who were drinking more than once a month for more than a year; occasional drinkers were defined as those who were drinking but less than once a month for more than a year; former drinkers were defined as those who were not drinking but drank a year ago.
Height, weight and blood pressure were obtained through physical examination. Serum creatinine (Scr), fasting plasma glucose and glycated haemoglobin were all measured by laboratory examinations. Body mass index (BMI) was calculated by weight (kg)/height squared (m2). According to the Chronic Kidney Disease Epidemiology Collaboration equation, the estimated glomerular filtration rate (eGFR) was calculated as follows: eGFRCKD−EPI = 141 × min (Scr/κ, 1)α × max (Scr/κ, 1)−1.209 × 0.993age (×1.018 if female), where the units of Scr and age are mg/dL and years, respectively; κ is 0.7 for females and 0.9 for males; α is 0.329 for females and 0.411 for males; “min” indicates the minimum of Scr/κ or 1, and “max” implies the maximum of Scr/κ or 1 [Citation19]. Participants were considered to have hypertension if they met one of the following standards: (1) systolic blood pressure ≥140 mmHg, (2) diastolic blood pressure ≥90 mmHg, (3) self-reported physician-diagnosed hypertension, and (4) use of antihypertensive medications [Citation20]. According to the American Diabetes Association criteria, diabetes was defined as: (1) fasting plasma glucose ≥126 mg/dL (7.0 mmol/L), (2) glycated haemoglobin ≥48 mmol/mol (6.5%), (3) self-reported physician-diagnosed diabetes, or (4) taking specific treatment for previously diagnosed diabetes [Citation21].
Ascertainment of hypercholesterolaemia and hypertriglyceridaemia
According to the Chinese guidelines on the prevention and treatment of dyslipidemia in adults (2016) [Citation1], participants at baseline were considered to suffer from hypercholesterolaemia if they met at least one of the following criteria: (1) TC ≥5.20 mmol/L, and (2) usage of antihyperlipidemic medications. Participants at baseline were considered to suffer from hypertriglyceridaemia if they met at least one of the following criteria: (1) TG ≥1.70 mmol/L, and (2) usage of antihyperlipidemic medications. New cases of hypercholesterolaemia and hypertriglyceridaemia were investigated at the first and second follow-up surveys (2013 and 2015). Participants were considered to have hypercholesterolaemia or hypertriglyceridaemia as long as they were diagnosed with hypercholesterolaemia or hypertriglyceridaemia at one of the two follow-up surveys.
Statistical analyses
The trend of baseline characteristics was examined with linear regression for continuous variables or logistic regression for category variables using the median SUA value for each quartile after adjusting for age (continuous) and gender, except for itself. Because new cases of hypercholesterolaemia and hypertriglyceridaemia were investigated at the first and second follow-up surveys, we were unable to estimate person-year accurately. As a kind of generalized linear model, the log-binomial regression (family: binomial, link: log) has been proposed as a useful model to calculate relative risk. Like logistic regression, the log-binomial regression is also used for the analysis of a dichotomous outcome. The difference between the logistic regression and the log-binomial regression is that the connection function between the independent variable and the probability of the outcome is different: the logit function is used for logistic regression, whereas the log function is used for the log-binomial regression [Citation22]. The use of odds ratios in logistic regression to estimate relative risk appropriates for rare outcomes, however, may be misleading when the outcome is common. In general, the log-binomial regression produces an unbiased estimate of the relative risk [Citation23]. Due to the high incidence of hypercholesterolaemia or hypertriglyceridaemia in this study, odds ratios estimated by logistic regression cannot accurately replace risk ratios (RRs). Instead, natural cubic spline models linked to log-binomial regression were used to examine the dose-response association of SUA (continuous) with hypercholesterolaemia and hypertriglyceridaemia. If the above dose-response relationship was linear, we further conducted log-binomial regression to evaluate the association of SUA quartiles or continuous SUA levels (per 100 μmol/L elevation) with hypercholesterolaemia and hypertriglyceridaemia. Test for linear trend was performed using the median SUA levels for each quartile as a continuous variable in log-binomial regression. Previous studies have found that SUA levels are more strongly linked with adverse events in females than in males [Citation21,Citation24,Citation25], so we further carried out sex-specific analyses.
To explore the dose-response association of SUA (continuous) with TG (continuous) and TC (continuous), we conducted a sensitivity analysis. After excluding participants (n = 147) who were treated with lipid-lowering therapy during the follow-up period, we used natural cubic spline models linked to multiple linear regression to evaluate the dose-response association of SUA (continuous) with TG (continuous) and TC (continuous). If the above dose-response relationship was linear, multiple linear regression analysis was used to examine the overall slope.
Covariates in all the above analyses included age (continuous), gender, nationality, education levels, marital status and place of residence, body mass index (continuous), estimated glomerular filtration rate (continuous), smoking status, drinking status, hypertension and diabetes. All statistical analyses were carried out with STATA version 16.0 (Stata Corporation, College Station, TX). Statistical significance was defined as a two-tailed probability (p) value <.05.
Results
Characteristics of participants
A total of 6,063 individuals (3,042 men and 3,021 women) were included in this study. The mean ± standard deviation of baseline SUA in the whole population, men and women were 249.08 ± 72.01 umol/L, 287.59 ± 71.88 umol/L and 229.90 ± 59.45 umol/L, respectively. Baseline characteristics of participates by sex-specific quartiles of SUA levels are shown in . Participants with higher SUA are likely to be older and have a higher BMI, a higher proportion of regular drinkers and hypertension. In addition, they tend to have lower eGFR and rural resident rates. At the end of the 4-year follow-up, a total of 576 participants (9.5%) have hypercholesterolaemia and a total of 661 participants (10.9%) have hypertriglyceridaemia.
Table 1. Baseline characteristics of participants across sex-specific quartiles of serum uric acid levels.
Association of SUA levels with hypercholesterolaemia or hypertriglyceridaemia
As shown in , natural cubic spline models suggested a significant linear dose-response association of SUA with hypercholesterolaemia and hypertriglyceridaemia after adjusting for potential confounders. The relationship between SUA levels and hypercholesterolaemia or hypertriglyceridaemia is displayed in . Compared with the first sex-specific quartile of SUA levels, the full-adjusted the RRs of hypertriglyceridaemia were 1.15 (0.95–1.39), 1.23 (1.02–1.49) and 1.31 (1.08–1.59) for quartiles 2–4 (p-value for trend = .004), respectively. Similar results were also observed when we referred SUA levels as a continuous variable: a 100 μmol/L increment of SUA was linked with 13% (95% confidence interval [CI]: 2–25%) elevated risk of hypertriglyceridaemia in the full-adjusted model. In contrast, there was no significant link between SUA levels and hypercholesterolaemia. Sensitivity analysis () indicated a positive linear association of SUA (continuous) with TG (continuous) and TC (continuous).
Figure 2. Dose-response association of serum uric acid levels with hypercholesterolaemia and hypertriglyceridaemia. RRs: risk ratios. The association was adjusted for age (continuous), gender, nationality, education levels, marital status, place of residence, body mass index (continuous), the estimated glomerular filtration rate (continuous), smoking status, drinking status, hypertension and diabetes. The solid line and dashed line represent the estimated RRs and their 95% confidence intervals. (A) and (B) are corresponding to hypercholesterolaemia and hypertriglyceridaemia, respectively.
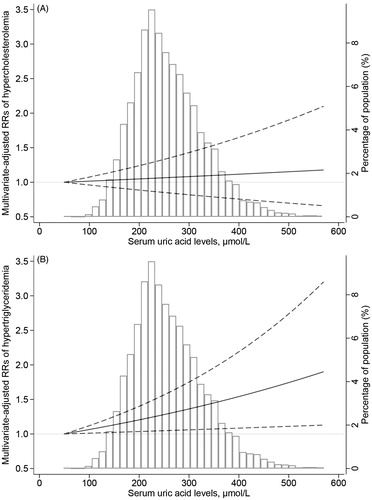
Figure 3. Dose-response association of serum uric acid levels (continuous) with total cholesterol (continuous) and triglyceride (continuous). The association was adjusted for age (continuous), gender, nationality, education levels, marital status, place of residence, body mass index (continuous), the estimated glomerular filtration rate (continuous), smoking status, drinking status, hypertension and diabetes. The solid line and dashed line represent the estimated regression coefficients and their 95% confidence intervals. (A) and (B) are corresponding to total cholesterol (continuous) and triglyceride (continuous), respectively.
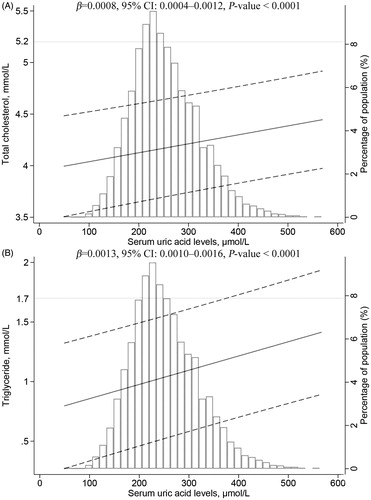
Table 2. Risk ratios (95% confidence intervals) of hypercholesterolaemia and hypertriglyceridaemia according to quartiles of SUA.
Sex-stratified analyses
As shown in , after adjustment for possible confounders, the significant association of SUA levels with hypertriglyceridaemia was more evident in females than the total population, whereas there was a null association in males. Additionally, the relationship between SUA levels and hypercholesterolaemia was still not statistically significant in males or females.
Discussion
To the best of our knowledge, there are few prospective cohort studies to investigate the association of SUA levels with hypercholesterolaemia or hypertriglyceridaemia and their dose-response association. This nationwide prospective cohort study suggests a positive linear dose-response relationship between SUA levels and incident hypertriglyceridaemia after controlling for potential confounders. Our findings add value to the current epidemiological evidence of SUA levels in relation to incident hypertriglyceridaemia.
In accordance with our results, one cohort study in the city of Ningbo, China has reported the positive relationship between SUA levels and hypertriglyceridaemia [Citation26]. Besides, Lu et al. performed a cross-sectional study in Chinese residents of Tianjin and found that SUA levels were positively linked with TG [Citation11]. Moreover, a cross-sectional study using data from the Third National Health and Nutrition Examination Survey, showed that elevated SUA levels were positively associated with TC and TG [Citation10]. In contrast, another cross-sectional study suggested that SUA levels were not related to hyperlipidaemia in overweight and obese Chinese adults [Citation14]. The reasons for the inconsistent results may be the difference in sample size, participant characteristics and study design.
Furthermore, we observed that SUA levels were higher in males than in females, which is consistent with previous researches [Citation27,Citation28], Two previous studies suggested that menopausal women had higher SUA levels than premenopausal women, and oestrogen therapy can also reduce male SUA levels [Citation29,Citation30]. Some researchers also believed that oestrogen may promote the excretion of uric acid by the renal tubules, whereas androgen may promote renal reabsorption of uric acid and inhibit renal reabsorption of uric acid [Citation31,Citation32]. Thus, we speculate that sex hormones may be responsible for sex differences in SUA levels. In addition, men are prone to have unhealthy lifestyles and eating habits such as smoking, drinking, and high purine, high calorie, high protein and high-fat diets, which are all the predisposing factors for the elevation of SUA levels. Moreover, another important factor may be the use of antihypertensive agents such as thiazide diuretics which are known to increase SUA levels [Citation27]. In China, diuretics belong to the most frequently prescribed first-line therapy of hypertension [Citation33]. China Hypertension Survey (2012–2015) reported that the prevalence of hypertension was 24.50% in men and 21.90% in women [Citation34]. Therefore, it is not surprising that antihypertensive treatment contributes to significantly higher SUA levels in men than in women.
Our sex-stratified analyses showed that the relationship between SUA levels and hypertriglyceridaemia seemed to be more pronounced among female participants. Previous studies suggested that the association of SUA levels with CVD events appeared to be stronger in females [Citation35–39]. Moreover, Lippi et al. enrolled a large retrospective cohort of unselected adult outpatients and uncovered that SUA levels were independently linked with TG in females but not in males [Citation40]. The results of the above studies further reconfirm our findings. Although the mechanisms remain still unclear, genetic factors, eating habits and lifestyle may explain the above phenomenon. In the future, the nature of the gender-specific relationship deserves further exploration. To explore the causes of different association of SUA levels with hypertriglyceridaemia between men and women will help us to further understand the role of SUA levels and provide a more reasonable treatment for adjusting SUA levels on individual patients.
Up to the present, the mechanisms linking SUA levels with the risk of hypertriglyceridaemia remain still not fully elucidated. Uric acid functions as a pro-oxidant within the cells [Citation41]. A study suggested that higher intracellular uric acid levels could induce mitochondrial translocation of the nicotinamide adenine dinucleotide phosphate oxidase subunit, the nicotinamide adenine dinucleotide phosphate oxidase 4, further leading to increased mitochondrial oxidative stress, mitochondrial dysfunction and citrate to release to the cytosol, ultimately promoting to the synthesis of lipid and TG [Citation42]. Besides, animal experiments showed that the activity of lipase in high SUA levels group was lower than that in low SUA levels group [Citation43]. Increased SUA levels may inhibit the decomposition of serum TG by reducing the activity of enzymes that catalyze the decomposition of TG, leading to a higher incidence of hypertriglyceridaemia in participants with high SUA levels [Citation12]. Furthermore, the elevated SUA levels may boost low-density lipoprotein oxidation and lipid peroxidation. Finally, uric acid or 1-methylic acid may stimulate the release of an unknown humoral factor from the bladder mucosa, which may cause an increase of serum TG [Citation44].
This study has several strengths. the CHARLS is of high quality in terms of survey methods and quality control, which guarantees high statistical power to provide a more reliable result. Besides, we explored the dose-response association of SUA with incident hypercholesterolaemia and hypertriglyceridaemia. Nevertheless, potential limitations deserve consideration. First, we only used SUA levels at baseline, so we were unable to account for within-individual variability in this study. Second, because our analyses are restricted to middle-aged and older Chinese, the results may not be generalized to young Chinese people (<45-years-old) or ethnic groups. Third, the participants are mainly from rural areas (87.48%), resulting in low representation of the urban population. Fourth, despite adjustment for a range of potential confounders, the possibility of residual and unmeasured confounders may not be ruled out, such as diet, drugs, genetics and physical activity information. Finally, the follow-up period of this prospective cohort study is comparatively shorter than other prospective cohort studies.
In summary, our findings suggest SUA levels may be positively related to hypertriglyceridaemia in middle-aged and older Chinese. Future studies are needed to confirm these results and explore other potential biological mechanisms.
| Abbreviations | ||
| BMI | = | body mass index |
| CDC | = | Centre for Disease Prevention and Control |
| CHARLS | = | China Health and Retirement Longitudinal Study |
| CI | = | confidence interval |
| CVD | = | cardiovascular disease |
| eGFR | = | estimated glomerular filtration rate |
| RRs | = | risk ratios |
| Scr | = | serum creatinine |
| SUA | = | serum uric acid |
| TC | = | total cholesterol |
| TG | = | triglyceride |
Acknowledgements
The authors are grateful to the field team of the China Health and Retirement Longitudinal Study for collecting the data and thank the China Center for Economic Research at Beijing University for providing the data.
Disclosure statement
No potential conflict of interest was reported by the author(s).
References
- Wang D, Chen J, Zhou Y, et al. Association between sleep duration, sleep quality and hyperlipidemia in middle-aged and older Chinese: the Dongfeng-Tongji Cohort Study. Eur J Prev Cardiolog. 2019;26(12):1288–1297.
- Huang L-H, Liu C-Y, Wang L-Y, et al. Effects of green tea extract on overweight and obese women with high levels of low density-lipoprotein-cholesterol (LDL-C): a randomised, double-blind, and cross-over placebo-controlled clinical trial. BMC Complement Altern Med. 2018;18(1):294.
- Ling Y, Shi Z, Yang X, et al. Hypolipidemic effect of pure total flavonoids from peel of Citrus (PTFC) on hamsters of hyperlipidemia and its potential mechanism. Exp Gerontol. 2020;130:110786.
- Karr S. Epidemiology and management of hyperlipidemia. Am J Manag Care. 2017;23(9):S139–S148.
- Wang T, Bi Y, Xu M, et al. Serum uric acid associates with the incidence of type 2 diabetes in a prospective cohort of middle-aged and elderly Chinese. Endocrine. 2011;40(1):109–116.
- Yu TY, Jee JH, Bae JC, et al. Serum uric acid: a strong and independent predictor of metabolic syndrome after adjusting for body composition. Metabol: Clin Exper. 2016;65(4):432–440.
- Wang J, Qin T, Chen J, et al. Hyperuricemia and risk of incident hypertension: a systematic review and meta-analysis of observational studies. PloS One. 2014;9(12):e114259.
- Chu NF, Wang DJ, Liou SH, et al. Relationship between hyperuricemia and other cardiovascular disease risk factors among adult males in Taiwan. Euro J Epidemiol. 2000;16(1):13–17.
- Li M, Hou W, Zhang X, et al. Hyperuricemia and risk of stroke: a systematic review and meta-analysis of prospective studies. Atherosclerosis. 2014;232(2):265–270.
- Peng TC, Wang CC, Kao TW, et al. Relationship between hyperuricemia and lipid profiles in US adults. BioMed Res Int. 2015;2015:1–7.
- Lu W, Song K, Wang Y, et al. Relationship between serum uric acid and metabolic syndrome: an analysis by structural equation modeling. J Clin Lipidol. 2012;6(2):159–167.
- Zheng R, Ren P, Chen Q, et al. Serum uric acid levels and risk of incident hypertriglyceridemia: a longitudinal population-based epidemiological study. Ann Clin Lab Sci. 2017;47:586–591.
- Kuwabara M, Borghi C, Cicero AFG, et al. Elevated serum uric acid increases risks for developing high LDL cholesterol and hypertriglyceridemia: a five-year cohort study in Japan. Int J Cardiol. 2018;261:183–188.
- Li L, Song Q, Yang X. Lack of associations between elevated serum uric acid and components of metabolic syndrome such as hypertension, dyslipidemia, and T2DM in overweight and obese chinese adults. J Diabetes Res. 2019;2019:1–8.
- Zhao Y, Hu Y, Smith JP, et al. Cohort profile: the China Health and Retirement Longitudinal Study (CHARLS). Int J Epidemiol. 2014;43(1):61–68.
- Lu Y, Wang P, Zhou T, et al. Comparison of prevalence, awareness, treatment, and control of cardiovascular risk factors in China and the United States. J Am Heart Assoc. 2018;7(3):e007462.
- Zhao Y, Crimmins E, Hu P, et al. China Health and Retirement Longitudinal Study, 2011–2012 national baseline blood data users’ guide. Beijing (China): China Center for Economic Research, Peking University; 2014.
- Joint Committee for Developing Chinese guidelines on Prevention and Treatment of Dyslipidemia in Adults. Chinese guidelines on prevention and treatment of dyslipidemia in adults. Zhonghua Xin Xue Guan Bing za Zhi. 2007;35(5):390–419.
- Levey AS, Stevens LA, Schmid CH, et al. A new equation to estimate glomerular filtration rate. Ann Intern Med. 2009;150(9):604–612.
- Whitworth JA. World Health Organization (WHO)/International Society of Hypertension (ISH) statement on management of hypertension. J Hypertens. 2003;21(11):1983–1992.
- American Diabetes Association. Diagnosis and classification of diabetes mellitus. Diabetes Care. 2013;36:S67–S74.
- Cummings P. Methods for estimating adjusted risk ratios. The Stata J. 2009;9(2):175–196.
- McNutt LA, Wu C, Xue X, et al. Estimating the relative risk in cohort studies and clinical trials of common outcomes. Am J Epidemiol. 2003;157(10):940–943.
- Freedman DS, Williamson DF, Gunter EW, et al. Relation of serum uric acid to mortality and ischemic heart disease. The NHANES I epidemiologic follow-up study. Am J Epidemiol. 1995;141(7):637–644.
- Reunanen A, Takkunen H, Knekt P, et al. Hyperuricemia as a risk factor for cardiovascular mortality. Acta Med Scand Suppl. 1982;668:49–59.
- Zheng R, Ren P, Chen Q, et al. Serum uric acid levels and risk of incident hypertriglyceridemia: a longitudinal population-based epidemiological study. Ann Clin Lab Sci. 2017;47:586–591.
- Conen D, Wietlisbach V, Bovet P, et al. Prevalence of hyperuricemia and relation of serum uric acid with cardiovascular risk factors in a developing country. BMC Public Health. 2004;4(1):9.
- Culleton BF, Larson MG, Kannel WB, et al. Serum uric acid and risk for cardiovascular disease and death: the Framingham Heart Study. Ann Intern Med. 1999;131(1):7–13.
- Hak AE, Choi HK. Menopause, postmenopausal hormone use and serum uric acid levels in US women–the Third National Health and Nutrition Examination Survey. Arthritis Res Ther. 2008;10(5):R116.
- Nicholls A, Snaith ML, Scott JT. Effect of oestrogen therapy on plasma and urinary levels of uric acid. Br Med J. 1973;1(5851):449–451.
- Stone ML, Richardson MR, Guevara L, et al. Elevated serum uric acid and self-reported heart failure in US adults: 2007–2016 national health and nutrition examination survey. Cardiorenal Med. 2019;9(6):344–353.
- Tsai EC, Boyko EJ, Leonetti DL, et al. Low serum testosterone level as a predictor of increased visceral fat in Japanese-American men. Int J Obes Relat Metab Disord. 2000;24(4):485–491.
- Lu Y, Chen R, Cai J, et al. The management of hypertension in women planning for pregnancy. Br Med Bull. 2018;128(1):75–84.
- Wang Z, Chen Z, Zhang L, et al. Status of hypertension in China: results from the China hypertension survey, 2012-2015. Circulation. 2018;137(22):2344–2356.
- Holme I, Aastveit AH, Hammar N, et al. Uric acid and risk of myocardial infarction, stroke and congestive heart failure in 417,734 men and women in the Apolipoprotein MOrtality RISk study (AMORIS). J Intern Med. 2009;266(6):558–570.
- Dai X, Yuan J, Yao P, et al. Association between serum uric acid and the metabolic syndrome among a middle- and old-age Chinese population. Eur J Epidemiol. 2013;28(8):669–676.
- Chiou WK, Wang MH, Huang DH, et al. The relationship between serum uric acid level and metabolic syndrome: differences by sex and age in Taiwanese. J Epidemiol. 2010;20(3):219–224.
- Sui X, Church TS, Meriwether RA, et al. Uric acid and the development of metabolic syndrome in women and men. Metabol: Clin Exper. 2008;57(6):845–852.
- Yang T, Chu CH, Bai CH, et al. Uric acid level as a risk marker for metabolic syndrome: a Chinese cohort study. Atherosclerosis. 2012;220(2):525–531.
- Lippi G, Montagnana M, Luca Salvagno G, et al. Epidemiological association between uric acid concentration in plasma, lipoprotein(a), and the traditional lipid profile. Clin Cardiol. 2010;33(2):E76–E80.
- So A, Thorens B. Uric acid transport and disease. J Clin Invest. 2010;120(6):1791–1799.
- Lanaspa MA, Sanchez-Lozada LG, Choi YJ, et al. Uric acid induces hepatic steatosis by generation of mitochondrial oxidative stress: potential role in fructose-dependent and -independent fatty liver. J Biol Chem. 2012;287(48):40732–40744.
- Gibson T, Kilbourn K, Horner I, et al. Mechanism and treatment of hypertriglyceridaemia in gout. Ann Rheum Dis. 1979;38(1):31–35.
- Balasubramanian T. Uric acid or 1-methyl uric acid in the urinary bladder increases serum glucose, insulin, true triglyceride, and total cholesterol levels in Wistar rats. Sci World J. 2003;3:930–936.