
Abstract
Background
Prostate cancer (PCa) is poor response to the immunotherapy for its high heterogeneity of immune microenvironment. In this study, we aim to introduce a new immune subtype for PCa involving M2 tumour associated macrophages (M2-TAMs).
Methods
Three hundred and sixty-two PCa patients and matched normal prostate tissues were selected from the Cancer Genome Atlas and Gene Expression Omnibus databases. Patients’ immune infiltration characters were then analyzed based on the gene expressions. The immune subtypes were identified by the method of unsupervised hierarchical clustering. Finally, the relationship between the M2-TAMs infiltration and anti-programmed death-ligand-1 (PD-L1) therapy was investigated in the IMvigor210 cohort.
Results
PCa expressed lower immune-related genes levels compared with the adjacent normal tissues. Based on the proved immunosuppressive mechanisms in PCa, tumour patients were classified into three independent subclasses with high infiltrated cytolytic activity (CYT), M2-TAMs and regulatory T cell (Tregs), respectively. Among these subtypes, M2-TAMs infiltration subtype showed the worst clinicopathological features and prognosis compared with the other two subtypes. The results of the IMvigor210 cohort demonstrated poor response of anti-PD-L1 therapy for patients with high M2-TAMs infiltration.
Conclusion
Prostate tumours involved in significant immunosuppression, and high infiltration of M2-TAMs can be applied to predict the effect of anti-PD-L1 therapy.
PCa patients can be classified into three immunotypes of high infiltrated CYT, M2-TAMS, and Tregs according to the immunosuppressive mechanisms.
High M2-TAMs infiltration subtype reflected the worst clinical characters, immune infiltration, and lowest expression of immune checkpoint inhibitors among the three subclasses in PCa.
High M2-TAMs infiltration predicts the low response rate of anti-PD-L1 therapy.
Key Messages
Introduction
Prostate cancer (PCa) is one of the most common malignant tumours in the world and the second leading cause of cancer death in men. Until 2018, there were about 359,000 cases of prostate cancer in the world, accounting for 6.7% of the total deaths in men [Citation1]. However, PCa patients have limited benefits from the current treatments. Nearly 20–35% of patients with localized prostate cancer are reported to experience recurrence after the radical prostatectomy [Citation2]. With the use of androgen deprivation therapy (ADT) for early-stage patients, most patients have not a durable response and eventually the disease progresses [Citation3]. Thus, new immunotherapies are required to treat PCa patients in recent years, however, some immunotherapeutic agents, like anti- programmed death-ligand-1 (PD-L1) or anti- programmed death-1 (PD-1), are applied to treat a fraction of advanced PCa patients with poor response rate [Citation4]. The interpatient clinical heterogeneities among these patients have not been resolved.
Tumour microenvironment (TME) is a highly heterogeneous ecosystem of tumour cells, immune cells and other stromal cells [Citation5]. The infiltrated immune cells in the TME have been shown to be significantly associated with the development and invasion in tumour patients. It was proved that high infiltrated immunosuppressive cells, such as M2 tumour associated macrophages (M2-TAMs) and regulatory T cell (Tregs), as important causes of treatment failure and shorter survival times in PCa patients [Citation6–8]. Of note, some defined as anti-tumour immune cells, like CD8+ T cells, were shown to be associated with lymph node metastasis in PCa [Citation9]. This seems to indicate a high degree of immunosuppression in PCa. Given this, deeply analyze the specific mechanisms of PCa immune microenvironment may help us to understand different treating prognoses. In recent years, new computer-based technologies are applied to estimate the infiltrated immune cells density in TME of bulk tumours by using gene expression profiles [Citation10–12]. By assigning values to each type of immune cell infiltration density, many tumour patients can be classified into different immune subtypes to predict the treatment and prognosis [Citation13–15]. This demonstrates that the clinical diagnosis guided by immune infiltration is available. However, to date, there have been few studies to systematically depict the characters of immune microenvironment and immunotypes in PCa based on genome-sequencing data. One study explored a classification based on immune related genes to predict the clinical prognosis of PCa, but this has limitations as it ignores the role of immune cells in tumour development [Citation16]. Besides, the precise relationship between immune cells and immunotherapy is still unclear. Hence, to explore the mechanisms of tumour microenvironments, and develop efficient predictors for clinical prognosis and therapy response in PCa is of great importance.
In this study, we performed the immunosuppressive characteristics of 362 PCa patients and their matched normal prostate tissues from TCGA and GEO databases based on the immunological profiles. According to the proved immunosuppressive mechanisms in PCa, tumour patients were classified into three independent subclasses with highly infiltrated cytolytic activity (CYT), M2-TAMs and Tregs, respectively. Patients with M2-TAMs subtype had the most immunosuppressive performance compared with the other two subtypes. Furthermore, analysis of the IMvigor210 cohort reflected that high M2-TAMs infiltrated patients showed poor response to anti-PD-L1 therapy. Our results demonstrated the unique immune characteristics of PCa and provide a more accurate theoretical basis for immunotherapy of prostate cancer.
Methods and materials
Patients and gene expression data
The gene expression profiles were obtained from the Cancer Genome Atlas (TCGA) and Gene Expression Omnibus (GEO) database, respectively as the discovery cohort and validation cohort. The patients with incomplete clinical, follow-up and pathological information were excluded. Finally, the FPKM RNA-Seq data and clinical information of 225 PCa patients and matched 51 normal prostate tissues were included from the TCGA database (https://portal.gdc.cancer.gov/), normalized gene expression data of 137 PCa patients and matched 70 normal prostate tissues were from the GSE70770 cohort (https://www.ncbi.nlm.nih.gov/geo/), respectively. The clinical information of GSE70770 cohort was further retrieved from a previous study [Citation17]. Gene symbol names of GSE70770 were annotated based on the annotation platforms GPL10588 by R language and data normalization were performed with the log2(x+1) expression, respectively.
The clinical information of the patients was summarized in Supplementary Table 1, As a previous study [Citation18], the D’Amico risk grade of PCa patients was identified based on the value of PSA, clinical T stage, and Gleason score.
Immune signatures
As a previous study [Citation19], CYT was computed as the geometric mean between the gene expression of PRF1 and GZMA. The prediction of immune cell infiltration of B cells, central memory CD4 T cell (CD4 + Tcm), effector memory CD4 T cell (CD4 + Tem), CD8 + T-cells and natural killer (NK) cells were performed using single-sample gene set enrichment analysis (ssGSEA) in the web analysis tool XCELL(https://xcell.ucsf.edu/). The signatures of interferon (IFN)-alpha response and IFN-gamma response pathway, innate immune cells and adaptive immune cells were obtained from two previous studies respectively [Citation19,Citation20]. The member genes of these signatures were listed in Supplementary Table S2. Gene list of immune-related genes were obtained from the IMMPORT database additionally (https://www.immport.org/home). Besides, we used ESTIMATE R package for calculating ESTIMATE immune score and stroma score of each sample. The prediction of M2 macrophage and Tregs fractions were computed by the web tool CIBERSORT (https://cibersort.stanford.edu/) when required. All signature values were normalized by limma package when required.
Identification of PCa immune subtypes
Three immune gene signatures were selected for classifying the PCa: CYT, M2-TAMsand Tregs. The infiltration of M2-TAMs and Tregs were estimated using the CIBERSORT by submitting FPKM RNA-Seq of TCGA data and log2(x+1) normalized gene expression matrix of GSE70770 data, respectively. The value of CYT was transformed using a logarithm. The cluster distance between each sample was defined Euclidean. Finally, the hierarchical cluster of 225 cases of tumour patients from the TCGA cohort and 137 cases from the GEO cohort was performed using the “Ward D2”, respectively.
For analysis of biological progress of M2-TAMs subtype, the top 10 upregulated hub genes of M2-TAMs subclass were selected from the two-fold differential expressed upregulated genes in M2-TAMs subclass compared to CYT and Tregs subclasses. The results of Go analysis were obtained from the DAVID online server by submitting gene symbols (https://david.ncifcrf.gov/). GSEA analysis was performed by uploading the transformed TPM RNA-Seq of the TCGA cohort to the GSEA server 3.0.
Analysis of a correlation between M2-TAMs subclass and response to immune checkpoint inhibitors (ICIs)
Two hundred and ninety-eight patients with urothelial cancer who received anti-PD-L1 blocker (pembrolizumab) therapy was obtained from the IMvigor210 cohort [Citation21]. The count RNA-Seq data and clinical information were collected from http://research-pub.gene.com/IMvigor210CoreBiologies. The DEseq2 R package was used to perform normalization, and the count RNA-Seq value was transformed into the TPM value for CIBEROST analysis when required.
Statistical analysis
All statistical analyses and visualization were conducted using R software (San Fransisco, CA, Version 3.5.1) and GraphPad Prism (GraphPad Software, La Jolla, CA, Version 7.0). A log-rank test was used to estimate an association between different groups and survival prognosis of PCa patients. The Mann-Whitney test and Chi-squared test were used to evaluate differences between groups of continuous and categorical variables, respectively. Correlation tests were based on the person and distance analysis. The univariate and multivariate Cox regression analyses were performed to detect the prognostic factors. All statistical p value were two-side, with p < .05 as statistically significant.
Result
Immune characteristics of PCa
To estimate immune cell infiltration in PCa, we firstly compared the immune infiltration of tumour and non-tumour prostate tissues respectively using ssGSEA. The multiple gene expression enrichment scores of seven immune cells and two inflammatory responses signal pathways were depicted in the TCGA cohort (). The results showed that significant lower immune score and stroma score in the tumour tissues compared with the normal tissues (). Several immune cells proportion between tumour and non-tumour prostate tissues were further analyzed. The infiltration of CD8 + T cell and NK cell in tumour lesion was significantly reduced compared with normal adjacent tissues (). In contrast, M2-TAMs and Tregs were highly infiltrated in prostate tumours than normal tissues ().
Figure 1. Prostate cancers showed immunosuppression in TCGA cohort. (A) The expression levels of immune-related genes and multigene signatures in tumour and non-tumorous prostate. Patients were ordered by the immune scores of each sample. RFS: recurrence free survival; CD4+ Tcm: central memory CD4 T cell; CD4 + Tem: effector memory CD4 T cell. (B, C) The difference of immune score and stroma score between normal and tumour prostate samples. p Values were computed using Mann-Whitney test (****p < .0001; *p < .05). (D–G) The difference expression of immune cell gene signature in normal and tumour prostate samples. p Values were computed using Mann-Whitney test (***p < .0001; **p < .001). M2-TAMs, M2 subtype tumour associated macrophages.
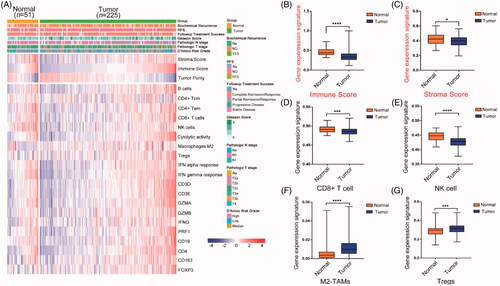
To validate the findings, we subsequently evaluated the difference of the immune infiltration between tumour and normal tissues of the prostate in the GEO cohort (Figure S1 (A)). Likewise, lower immune score and stroma score were observed in tumours compared with normal tissues, although there was no significance of immune score between tumour and normal in the GEO cohort (Figure S1(B, C)). The changes of immune infiltration in prostate tumours showed significantly lower CD8+ T cells and NK cells compared with that in normal tissues (Figure S1(D, E)). While the infiltration of M2-TAMs and Tregs in tumours showed higher than that in normal tissues comparatively (Figure S(1 F, G)). These results suggest that prostate cancer was immunosuppressed to some extends.
Immunosuppressive subtypes of PCa
Previous studies have proved that the immune resistance of PCa related to the infiltrated immunosuppressive cells in TME. It was reported that high infiltration of M2-TAMs [Citation22] promoted drug resistance in Castrate-resistant prostate cancer (CRPC) patients, and the Tregs were required to established and maintain the immune resistance. The CYT that represented immune activity of CD8 + T and NK cells had recently been used to predict the effect of immunosuppression in tumours [Citation23]. Notably, our study showed that higher infiltrated M2-TAMs significantly related to the lower CYT infiltrations in both data of the TCGA and GEO cohort (Figure S2 (A, D)). We hypothesized that PCa patients can be classified into different individual immune subtypes because of the immune divergence of these factors.
To investigate whether these immune mechanisms work jointly or separately in clinical samples in PCa, we further conducted an unsupervised hierarchical cluster of tumour samples by immune-related gene signatures within the TCGA cohort, the patients have finally identified three subtypes with highly infiltrated CYT, M2-TAMs, and Tregs (). Among these subtypes, the signature of CYT represented anti-tumour immunity, and other two clusters (M2-TAMs and Tregs) represented immunosuppressive components. Patients’ numbers of these clusters were 65, 97, 63 (28.9, 43.1 and 28.0%), respectively. Based on the immune characters, M2-TAMs cluster showed the lowest immune score among three clusters, which indicated significantly low immune infiltration in M2-TAMs subtype (), but the prediction of stroma score among three clusters showed no difference (). Differential clinical features among three clusters were then analyzed. Patients with M2-TAMs subclass showed the worst outcome compared with CYT and Tregs subtypes (–G)), the results showed that tumours with high D’Amico risk, high Gleason score (>7), and biochemical recurrence were concentrated in this subtype, which predicted a higher risk of recurrence with M2-TAMs infiltrated patients following localized treatment (–F)). In contrast, patients in CYT cluster were enriched in the lowest D’Amico risk and Gleason score compared with M2-TAMs and Tregs subtype, which indicated that cluster CYT had better clinical outcome. The rate of following-up treatment success showed poorly respond to the treatment in M2-TAMs subtype compared with the other two subtypes ().
Figure 2. Classification of prostate cancer based on immunosuppression mechanisms. (A) Unsupervised clustering of TCGA cohort (n = 225) prostate cancer by three immune-gene expression signatures (cytolytic activity, M2-TAMs and Tregs); expression levels of marker for T cells (CD4 and CD8A); Tregs (FOXP3); M2-TAMs (CD163 and CD206) and primary immune check points were also shown. (B, C) The differential expression of immune score and stroma score value among three immune subclasses (****p < .0001; *** p < .001; ns: negative significance, Mann-Whitney test). (D–G) The differential proportions of tumour patients classified by clinical characters within three immune subclasses.
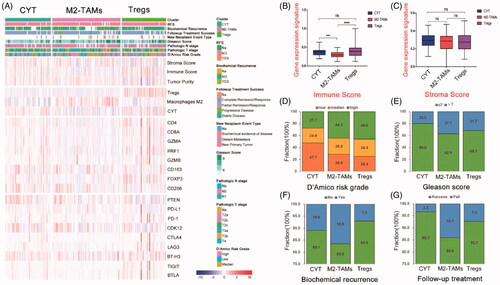
We further assessed the immune features of 137 PCa patients in GEO cohort (Figure S3 A). The results showed that GEO cohort was also classified into the three clusters (CYT, 55.5%; M2-TAMs, 24.8% and Tregs,19.7%), which indicated the stability of our immune classification. Consist with the TCGA cohort, M2-TAMs subclass in the GEO cohort showed lower immune infiltration compared with the other two subclasses (Figure S3(B)), but with no difference of stroma component among these subclasses (Figure S3 (C)). Besides, the difference of clinical features among three subtypes showed that patients in M2-TAMs subtype had the highest proportion for poor outcome compared with the other two clusters (Figure S3 (D–F)).
M2-TAMs infiltration subtype indicate poor prognosis
To investigate the prognostic difference of three immune subtype PCa patients, biochemical recurrence-free survival (RFS) was conducted using Kaplan-Meier survival curve in the TCGA cohort (). The results showed that patients with M2-TAMs and Tregs subclass had a shorter survival time compared with the CYT subclass. Notably, within the classification of three immune clusters for predicting RFS, patients with high M2-TAMs group were significantly associated with poor prognosis compared with that in low M2-TAMs group, which indicated that high M2-TAMs infiltration might effectively impact patients’ outcome. However, the Tregs or CYT group had no significance on RFS (–D)). Consistent with this, the cox proportion hazards model showed that M2-TAMs infiltration was one of the risk factors for predicting RFS (p = .023, ). And the effect of three subtype’s classification on biochemical recurrence survival in the GEO cohort obtained similar results (Figure S4). Of note, patients in high CYT group were significantly associated with better outcomes compared with those in low CYT group in the GEO cohort (Figure S4(B), Table S3), which indicated that CYT value may be one protector in PCa progression.
Figure 3. Association between three subtypes and prognosis in PCa in TCGA cohort. (A) Kaplan-Meier analysis of immune subtypes based on five-year recurrence free survival in TCGA cohort. p Value was calculated by the log-rank test among subtypes. (B–D) Kaplan-Meier analyses of tumours stratified by cytolytic activity, M2-TAMs, and Tregs infiltration score. p Value was calculated by the log-rank test.
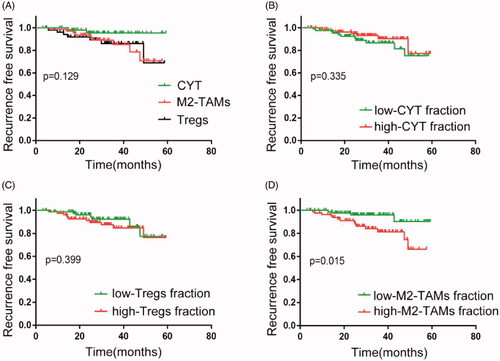
Table 1. Univariate and multivariate cox analysis for predicting RFS in the TCGA cohort.
Immunosuppressive performance of M2-TAMs infiltration in PCa
The infiltration of immune cells in TME had been shown to promote tumour immune escape by cross-talking with each other, thereby altering the proportion of immune cells in the TME of tumour patients [Citation24,Citation25]. Given this, we analyzed the infiltration abundance of innate and adaptive immune cells in three subtypes additionally. The results showed both innate immune cells and adaptive immune cells in M2-TAMs subclass had significantly reduced infiltration compared with CYT and Tregs subtypes (Figure S5( A)). Furthermore, the differential expression of immunomodulatory factors in three clusters showed that cluster M2-TAMs had poorly inflammatory induction compared with the other two subclasses (). It was observed that several genes relatively highly expressed in M2-TAMs subclass. Interleukin (IL)-4 and protein kinase B (AKT1) expression were related to the infiltration and polarisation of tumour-associated macrophages in TME of PCa, and BMP6 and GDF15 were reported to be related to the development of CRPC [Citation26] and docetaxel resistance [Citation27] respectively in PCa patients, theses may explain the reason why patients in M2-TAMs patients showed poor outcomes.
Figure 4. The immunosuppressive mechanisms of M2-TAMs subclass. (A) The median expression level of the immune-related genes in three subclasses of prostate cancer (Gene list: chemokines and chemokines receptor; interleukins and interleukins receptor; cytokines and cytokines receptor and interferons and interferons receptor). (B, C) Gene expression levels of PD-L1/PD-1 of three immune subclasses in TCGA cohort and GEO cohort prostate cancer samples. p Values were computed using Mann-Whitney test (****p < .0001; ***p < .001; ***p < .001; **p < .01; *p < .05; ns, p > .05). (D) Go analysis plots were shown the hub genes that up-regulated in the M2-TAMs subclass in prostate cancer samples. BP: biological process; CC: cellular component; MF: molecular function. (E) Gene set enrichment plots were shown the up-regulated genes in the M2-TAMs subclass compared to the CYT or Tregs subclass.
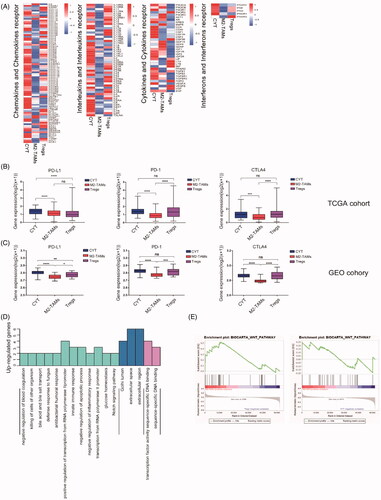
To uncover the immune resistance among three clusters, the differential expression of the immune checkpoint in these subtypes was further investigated from TCGA and GEO cohort respectively (; S5(B AKT1I)). Significantly lower expression of immune checkpoints was observed in M2-TAMs subclass compared with the other two clusters. Of note, patients in the M2-TAMs cluster showed lower expression of PD-L1 and PD-1 compared with the CYT or Tregs subclass, which indicated that M2-TAMs infiltration was associated with stronger resistance to the immune treatment.
We further interrogated the molecular biology progress of the M2-TAMs subclass (). In terms of biological progress function, M2-TAMs subclass showed significantly negative regulations on inflammatory response and apoptosis, which might explain the reasons why M2-TAMs subclass with lower immune infiltration. Besides, the results of GSEA analysis showed that highly expressed genes in M2-TAMs subclass related to the Wnt pathway compared with the other two subclasses, the Wnt pathway involved in immunosuppression in tumours ().
Association between the M2-TAMs infiltration and response to ICIs
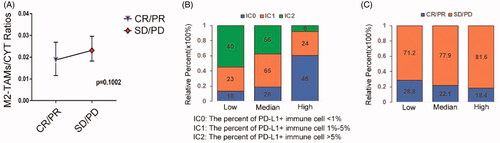
We further evaluated whether or not M2-TAMs infiltration had the ability to predict immunotherapy response. Two hundred and ninety-eight urothelial carcinoma patients who received anti-PD-L1 therapy in IMvigor210 cohort were selected to evaluate the relationship between the infiltration of M2-TAMs and response to ICIs. The results showed that the patients with progress response and stable response exhibited higher M2-TAMs to CYT ratios (). We classified patients into three groups based on their M2-TAMs to CYT ratios, the significantly reduced PD-L1+ immune cells were seen in high ratios group while low ratios group comprised of increased infiltration of PD-L1+ immune cells, respectively (p < .0001, ), which indicated that higher M2-TAMs infiltration showed lower effect treated with anti-PD-L1 blocker. At the same time, we found patients in high M2-TAMs/CYT ratios group showed a relatively poor clinical response to PD-L1 blockade therapy than those in low M2-TAMs/CYT ratios group comparatively (18.4 vs. 28.8%; ). These results indicated that high M2-TAMs infiltration in TME might reflect poor effective therapy with an inhibitor of anti-PD-L1. To some extent provided a valuable target for immune treatment in PCa.
Figure 5. M2-TAMs subclass showed poorly respond to ICIs. (A) The ratios of infiltration fractions of M2-TAMs to CYT value in the effective and ineffective anti-PD-L1 clinical therapy groups of the IMvigor210 cohort patients (n = 298). CR: complete response; PR: partial response; SD: stable response; PD: progress response (p = .1002, Mann-Whitney test; median (95% confidence interval)). (B) The proportions of patients with different PD-L1+ immune cells infiltrating fractions in three groups of low, medium and high M2-TAMs/CYT values (low vs. high: p < .0001; Chi-square test). (C) The proportions of patients with response to PD-L1 blockade therapy in three groups of low, medium and high M2-TAMs/CYT values (low vs. high: p = .136; Chi-square test).
Discussion
In prostate cancer, unsatisfactory effect of anti-PD-L1/PD-1 therapy has become a public problem because of the unstable immune check-points expression in PCa tissues [Citation28–30]. The poor prognosis of immunotherapy for PCa patients was thought to be related with microenvironment immunosuppression [Citation31,Citation32]. Some infiltrating immune cells, such as M2-TAMs [Citation22], Tregs [Citation33] were reported highly infiltrated in PCa and proved to be the performance of immunosuppression. However, whether these mechanisms interact or related to immunotherapy in PCa remains unclear. Based on the immunological profiles, we analyzed the different immune characters of 362 PCa patients and matched normal prostate tissues in TCGA and GEO cohort, respectively. We introduced a new immune subtype for PCa patients with high infiltration of CYT, M2-TAMs, and Tregs, our results showed that patients in high M2-TAMs infiltration subtype showed not only the worst clinical prognosis among the three subtypes, but the more significant is that patients with high M2-TAMs infiltration showed lower immune check-points expression compared with the other two subgroups, especially for expression of PD-L1/PD-1. Meanwhile, high M2-TAMs infiltration predicted poorly respond to the anti-PD-L1 treatment in the IMvgior210 cohort, suggesting that M2-TAMs infiltration may be an important factor to attenuated the remission rate of anti-PD-L1 therapy.
In fact, pieces of research have been proved the immunosuppression of M2-TAMs [Citation22,Citation34,Citation35]. Xu L et al. [Citation22] reported that in vitro-induced M2-TAMs induced the resistance of PCa cells to cytotoxic action of NK cell. Macrophages in lung squamous-cell carcinoma matrix can prevent T cells from migrating in TME and their interaction with stimulation of antigen-presenting cells populations [Citation35], which indicated that M2-TAMs infiltration can affect the activity of CD8 + T cells and NK cells respectively. In our study, the infiltration of CD8+ T cells and NK cells involving in anti-tumour immunity was significantly decreased in the tumour samples while with higher M2-TAMs infiltration comparatively (–F), which suggested that high infiltration of M2-TAMs may be one important reason for destroying the immune microenvironment homeostasis in PCa. On the other hand, we also found that IL-4 and AKT1 involved in M2 polarization were expressed highly in M2-TAMs subclass (). The higher expression of BMP6 and GDF15 in M2-TAMs subtype has been proved to be related to the development of CRPC [Citation26] and docetaxel resistance [Citation27], respectively in our study. These findings may explain the unique immunosuppression of M2-TAMs subclass.
Different from the M2-TAMs subtype, CYT and Treg subtypes showed higher immune infiltration (). Previous studies showed that the infiltration of Treg cells was related to the poor prognosis of PCa [Citation33]. In a study of PCa patients treated with GM-CSF-secreting allogeneic cellular vaccine, the CD8+ T-cell infiltrate was accompanied by a proportional increase in Tregs cells, suggesting that adaptive Treg resistance may dampen the immunogenicity of PCa [Citation8]. This may be the difference of immunosuppression between the Treg and M2-TAMs subclass.
Appearance of immune check-point blocker provides a new idea for the treatment of refractory PCa in recent years. However, series clinical trials showed a poorly respond to the treatment with anti-PD-L1 and anti-PD-1 blocker in PCa [Citation36–38]. In keynote-028, the total effective rate of patients treated with pembrolizumab (anti-PD-1 blocker) was only 13% [Citation36]. Another study of patients with recurrent or advanced PCa showed a response rate of 19% with pembrolizumab treatment [Citation37]. Thus, the reason why PCa patients treated with immune check-point blacker received poorly response remains unclear. Several evidence suggested that some immune cells infiltrated in TME can predict the response of immune checkpoint [Citation39–41]. In our study, the expression of PD-L1 and PD-1 were significantly lower in M2-TAMs subclass among three subclasses (), this suggests that M2-TAMs patients may have poor efficacy with treated of PD-L1 blockers. More important, another data analysis, the patients with urothelial carcinoma received anti-PD-L1 treatment in IMvgior210 cohort showed higher M2-TAMs infiltration was related to poor effective therapy (). Our results demonstrated that M2-TAMs subclass PCa patients may not be suitable for anti-PD-L1 or PD-1 treatment.
This study had a few limitations which should be addressed in the future. First, the sample size of this study was limited, there were only two cohorts, including 362 PCa patients. Second, this study lacked direct evidence to investigate the relationship between M2-TAMs infiltration and response rate of ICIs treatment for prostate cancer. Further confirmation of the mechanism of influence between M2-TAMs infiltration and anti-PD-L1 immune response will be the focus of future studies.
Conclusion
In conclusion, our study established a new immune subtype for PCa patients based on the immunosuppressive cell infiltration. High M2-TAMs infiltration subtype showed the lower expression of immune check-points in PCa patients. For prognosis of immune therapy, the levels of M2-TAMs infiltration could be as one potential maker for assessing the effective remission of PCa patients receiving immunotherapy.
Author contributions
MKC and SCZ designed the study and revised the manuscript. JWZ, CXD, CDL, YL collected, analyzed and interpreted the TCGA, GEO and IMvigor210 cohort data. JWZ, CXD, YL wrote and revised the manuscript. JKY, HFD, CY, ZPH and HYW participated in the data collections. DYL, ZJL, XX, QZZ, KYX, WBG and MX participated in the data analysis. JHZ and JMB participated in the language editing of the manuscript. All the listed authors have participated actively in the study. All authors read and approved the final manuscript.
Disclosure statement
The authors report no conflicts of interest.
Data availability statement
The authors confirm that the data supporting the findings of this study are available within the article and its supplementary materials.
Correction Statement
This article has been republished with minor changes. These changes do not impact the academic content of the article.
Additional information
Funding
References
- Bray F, Ferlay J, Soerjomataram I, et al. Global cancer statistics 2018: GLOBOCAN estimates of incidence and mortality worldwide for 36 cancers in 185 countries. CA Cancer J Clin. 2018;68(6):394–424.
- Stephenson A, Scardino P, Eastham J, et al. Preoperative nomogram predicting the 10-year probability of prostate cancer recurrence after radical prostatectomy. J Natl Cancer Inst. 2006;98(10):715–717.
- Watson P, Arora V, Sawyers C. Emerging mechanisms of resistance to androgen receptor inhibitors in prostate cancer. Nat Rev Cancer. 2015;15(12):701–711.
- Sharma P, Pachynski R, Narayan V, et al. Nivolumab plus ipilimumab for metastatic castration-resistant prostate cancer: preliminary analysis of patients in the CheckMate 650. Cancer Cell. 2020; 38(4):489–499.e3.
- Duan Q, Zhang H, Zheng J, et al. Turning cold into hot: firing up the tumor microenvironment. Trends Cancer. 2020;6(7):605–618.
- Erlandsson A, Carlsson J, Lundholm M, et al. M2 macrophages and regulatory T cells in lethal prostate cancer. Prostate. 2019;79(4):363–369.
- Seif F, Sharifi L, Khoshmirsafa M, et al. A review of preclinical experiments toward targeting M2 macrophages in prostate cancer. Curr Drug Targets. 2019;20(7):789–798.
- Obradovic A, Dallos M, Zahurak M, et al. T-Cell infiltration and adaptive Treg resistance in response to androgen deprivation with or without vaccination in localized prostate cancer. Clin Cancer Res. 2020;26(13):3182–3192.
- Petitprez F, Fossati N, Vano Y, et al. PD-L1 expression and CD8+ T-cell infiltrate are associated with clinical progression in patients with node-positive prostate Cancer . Eur Urol Focus. 2019;5(2):192–196.
- Le T, Aronow RA, Kirshtein A, et al. A review of digital cytometry methods: estimating the relative abundance of cell types in a bulk of cells. Brief Bioinform. 2020; bbaa219.
- Zhang Y, Ou D, Zhuang D, et al. In silico analysis of the immune microenvironment in bladder cancer. BMC Cancer. 2020; 20(1):265.
- Ye L, Zhang T, Kang Z, et al. Tumor-infiltrating immune cells act as a marker for prognosis in colorectal cancer. Front Immunol. 2019; 10:2368.
- Qin F, Xu Z, Yuan L, et al. Novel immune subtypes of lung adenocarcinoma identified through bioinformatic analysis. FEBS Open Bio. 2020;10(9):1921–1933.
- Jiang J, Pan W, Xu Y, et al. Tumour-infiltrating immune cell-based subtyping and signature gene analysis in breast cancer based on gene expression profiles. J Cancer. 2020;11(6):1568–1583.
- Zhou Y, Zhu G, Lu X, et al. Identification and validation of tumour microenvironment-based immune molecular subgroups for gastric cancer: immunotherapeutic implications. Cancer Immunol Immunother. 2020; 69(6):1057–1069.
- Zhang E, He J, Zhang H, et al. Immune-related gene-based novel subtypes to establish a model predicting the risk of prostate cancer. Front Genet. 2020; 11:595657.
- Ross-Adams H, Lamb AD, Dunning MJ, et al. Integration of copy number and transcriptomics provides risk stratification in prostate cancer: a discovery and validation cohort study. EBioMedicine. 2015;2(9):1133–1144.
- Gabriele D, Jereczek-Fossa BA, Krengli M, et al. Beyond D'Amico risk classes for predicting recurrence after external beam radiotherapy for prostate cancer: the CANDIOLO classifier. Radiat Oncol. 2016;11:23.
- Fujita M, Yamaguchi R, Hasegawa T, et al. Classification of primary liver cancer with immunosuppression mechanisms and correlation with genomic alterations. EBioMedicine. 2020;53:102659.
- Charoentong P, Finotello F, Angelova M, et al. Pan-cancer immunogenomic analyses reveal genotype-immunophenotype relationships and predictors of response to checkpoint blockade. Cell Rep. 2017;18(1):248–262.
- Mariathasan S, Turley SJ, Nickles D, et al. TGFβ attenuates tumour response to PD-L1 blockade by contributing to exclusion of T cells. Nature. 2018;554(7693):544–548.
- Xu L, Shen M, Chen X, et al. In vitro-induced M2 type macrophages induces the resistance of prostate cancer cells to cytotoxic action of NK cells. Exp Cell Res. 2018;364(1):113–123.
- Roufas C, Chasiotis D, Makris A, et al. The expression and prognostic impact of immune cytolytic activity-related markers in human malignancies: a comprehensive meta-analysis. Front Oncol. 2018;8:27.
- Bindea G, Mlecnik B, Tosolini M, et al. Spatiotemporal dynamics of intratumoral immune cells reveal the immune landscape in human cancer. Immunity. 2013;39(4):782–795.
- Varn FS, Wang Y, Mullins DW, et al. Systematic pan-cancer analysis reveals immune cell interactions in the tumor microenvironment. Cancer Res. 2017;77(6):1271–1282.
- Lee GT, Jung YS, Ha YS, et al. Bone morphogenetic protein-6 induces castration resistance in prostate cancer cells through tumor infiltrating macrophages. Cancer Sci. 2013;104(8):1027–1032.
- Huang CY, Beer TM, Higano CS, et al. Molecular alterations in prostate carcinomas that associate with in vivo exposure to chemotherapy: identification of a cytoprotective mechanism involving growth differentiation factor 15. Clin Cancer Res. 2007;13(19):5825–5833.
- Gevensleben H, Dietrich D, Golletz C, et al. The immune checkpoint regulator PD-L1 is highly expressed in aggressive primary prostate cancer. Clin Cancer Res. 2016;22(8):1969–1977.
- Baas W, Gershburg S, Dynda D, et al. Immune characterization of the programmed death receptor pathway in high risk prostate cancer. Clin Genitourin Cancer. 2017;15(5):577–581.
- Haffner MC, Guner G, Taheri D, et al. Comprehensive evaluation of programmed death-ligand 1 expression in primary and metastatic prostate cancer. Am J Pathol. 2018;188(6):1478–1485.
- Jansen CS, Prokhnevska N, Kissick HT. The requirement for immune infiltration and organization in the tumor microenvironment for successful immunotherapy in prostate cancer. Urol Oncol. 2019;37(8):543–555.
- Vidotto T, Saggioro FP, Jamaspishvili T, et al. PTEN‐deficient prostate cancer is associated with an immunosuppressive tumor microenvironment mediated by increased expression of IDO1 and infiltrating FoxP3+ T regulatory cells. Prostate. 2019;79(9):969–979.
- Watanabe M, Kanao K, Suzuki S, et al. Increased infiltration of CCR4‐positive regulatory T cells in prostate cancer tissue is associated with a poor prognosis. Prostate. 2019;79(14):1658–1665.
- Zheng T, Ma G, Tang M, et al. IL-8 secreted from M2 macrophages promoted prostate tumorigenesis via STAT3/MALAT1 pathway. IJMS. 2018;20(1):98.
- Peranzoni E, Lemoine J, Vimeux L, et al. Macrophages impede CD8 T cells from reaching tumor cells and limit the efficacy of anti-PD-1 treatment. Proc Natl Acad Sci U S A. 2018;115(17):E4041–E4050.
- Hansen A, Massard C, Ott PA, et al. Pembrolizumab for advanced prostate adenocarcinoma: findings of the KEYNOTE-028 study. Ann Oncol. 2018;29(8):1807–1813.
- Higa J, Wilenius K, Weidhaas JB, et al. Pembrolizumab for recurrent or advanced prostate cancer. J Clin Oncol. 2018;36(suppl 6):2.
- Antonarakis ES, Piulats JM, Gross-Goupil M, et al. Pembrolizumab for treatment-refractory metastatic castration-resistant prostate cancer: multicohort, open-label phase II KEYNOTE-199 study. J Clin Oncol. 2020;38(5):395–405.
- Daud AI, Loo K, Pauli ML, et al. Tumor immune profiling predicts response to anti-PD-1 therapy in human melanoma. J Clin Invest. 2016;126(9):3447–3452.
- Tumeh PC, Harview CL, Yearley JH, et al. PD-1 blockade induces responses by inhibiting adaptive immune resistance. Nature. 2014;515(7528):568–571.
- Eroglu Z, Zaretsky JM, Hu-Lieskovan S, et al. High response rate to PD-1 blockade in desmoplastic melanomas. Nature. 2018; 553:347–350.