
Abstract
Introduction
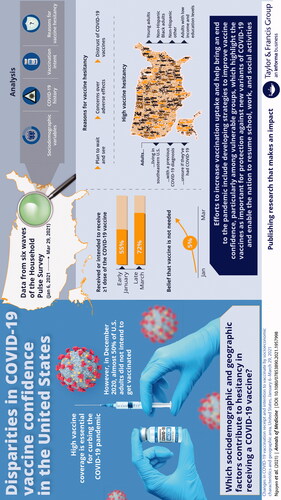
Previous studies suggested that almost one-third of U.S. adults did not plan to get a COVID-19 vaccine once it is available to them. The purpose of this study was to examine changes in vaccine intentions and attitudes by sociodemographic characteristics and geographic areas, factors associated with vaccination intent, and reasons for non-vaccination among a nationally representative sample of U.S. adults.
Methods
Data from six waves of the Household Pulse Survey (6 January – 29 March 2021) were analyzed. Differences between January and March were assessed using t-tests. Factors associated with vaccination intent were examined in multivariable logistic regression models.
Results
From early January to late March, vaccination receipt of ≥1 dose of the COVID-19 vaccine or intention to definitely get vaccinated increased from 54.7 to 72.3%; however, disparities in vaccination intent continued to exist by age group, race/ethnic groups, and socioeconomic characteristics. Vaccine receipt and the intent were the lowest for region 4 (southeastern U.S.) throughout this period. Adults who had a previous COVID-19 diagnosis or were unsure if they have had COVID-19 were less likely to intend to get vaccinated [prevalence ratio = 0.92 (95%CI: 0.90–0.93) and 0.80 (95%CI: 0.74–0.85), respectively]. The belief that a vaccine is not needed increased by more than five percentage points from early January to late March.
Conclusion
Intent to definitely get a COVID-19 vaccine increased by almost 18 percentage points from early January to late March; however, younger adults, adults who are non-Hispanic Black or other races, adults of lower socioeconomic status, and adults living in the southeastern U.S. region (Region 4) continue to have higher coverage gaps and levels of vaccine hesitancy. Emphasizing the importance of vaccination among all populations, and removing barriers to vaccines, may lead to a reduction of COVID-19 incidence and bring an end to the pandemic.
Receipt of ≥1 dose of the COVID-19 vaccine and intent to probably or definitely get vaccinated increased from early January to late March; however, disparities in vaccine intent continued to exist by age group, race/ethnic groups, and socioeconomic characteristics.
Vaccine receipt and the intent were the lowest for region 4 (southeastern U.S.) compared to other regions during this period.
Adults who had a previous COVID-19 diagnosis or were unsure if they have had COVID-19 were less likely to intend to get vaccinated; overall, the belief that a vaccine is not needed to be increased by more than 5% points from early January to late March.
KEY MESSAGES
Graphical Abstract
Introduction
As of 26 July 2021, 178 million or 69% of adults aged 18 or older in the United States (U.S.) had been vaccinated with at least 1 dose of a COVID-19 vaccine [Citation1]. While initial doses of the COVID-19 vaccine were prioritized for healthcare personnel, adults over 65 years, adults with comorbidities, and essential workers [Citation2,Citation3], the vaccine has been available to all adults nationally since 19 April 2021 [Citation4,Citation5]. However, studies conducted in September and December 2020 suggested that only 40 and 50%, respectively of U.S. adults planned to get a COVID-19 vaccine once it became available to them [Citation6,Citation7]. Among people reporting that they would not be vaccinated in December 2020, the major concerns cited were the side effects and safety of the vaccine, concerns about the speed of vaccine development and testing, and a feeling of distrust in government [Citation6]. While recent polls show that vaccination intent is increasing among the general public [Citation8,Citation9], disparities in vaccination receipt persist among subpopulations and geographical areas [Citation10,Citation11].
Attitudes towards the vaccine have changed over time as new information has emerged about vaccine characteristics and more people have been vaccinated. Since the first emergency use authorization (EUA) of the COVID-19 vaccines in December 2020 [Citation12], no study has examined changes in COVID-19 vaccine uptake and willingness to be vaccinated among a nationally representative sample of U.S. adults by sociodemographic characteristics and geographic areas. Understanding factors associated with receipt or intention to get the COVID-19 vaccine and reasons for non-vaccination is important for tailoring health communication campaigns and strategies to promote public confidence in COVID-19 vaccines and to ensure high and equitable vaccination coverage across all populations.
Data from national surveys can be used to monitor changes in COVID-19 vaccine behaviours and evolving attitudes towards vaccination-valuable insights that can be employed to identify and tailor messages for priority audiences efforts aimed at improving vaccine confidence, particularly among vulnerable populations who experience inequities related to social determinants of health. Research has shown racial and ethnic minority groups have been disproportionately affected by COVID-19 infections and deaths [Citation13] and yet are less likely to have received or report the intention to receive a COVID-19 vaccine [Citation6]. These groups are overrepresented among frontline essential workers, are less likely to be insured or have a usual source of care, and many are experiencing financial and food insecurity, housing instability, and other competing priorities that put them at increased risk of infection and death from the COVID-19 [Citation14–16].
This study examines changes in and factors associated with receipt of ≥1 dose of COVID-19 vaccine and vaccination intent from 6 January to 29 March 2021 by socioeconomic characteristics and geographic areas and reasons for non-vaccination using the Census Bureau’s Household Pulse Survey (HPS) [Citation17]. The HPS is a large, nationally representative survey that collects data on COVID-19 vaccination coverage and intent, as well as other social and economic characteristics during the pandemic. This study provides timely data on disparities in COVID-19 vaccine confidence by socioeconomic factors and geographic areas, which can be used to evaluate and target efforts to improve vaccine uptake. Ensuring high and equitable vaccination coverage in all populations is critical to preventing the spread of COVID-19 and bringing an end to the pandemic.
Methods
Survey design
The Household Pulse Survey (HPS) is a large, nationally representative household survey of appoximately 75,000 respondents conducted by the U.S. Census Bureau to help understand household experiences during the COVID-19 pandemic [Citation17]. The HPS utilizes the Census Bureau’s Master Address File (MAF), which has approximately140,000,000 valid housing units, to select a very large sample. It is designed to provide representative estimates at the national, state, and local level for 15 Metropolitan Statistical Areas (MSAs). To enable the HPS’s use of a rapid deployment internet and telephone interview system, email and mobile telephone numbers from the Census Bureau Contact Frame was paired with addresses in the MAF, for which there were 80% matches. Unique phone numbers and email addresses were identified and assigned to only one housing unit. The housing units in the MAF were limited to these addresses on the Contact Frame as the final eligible housing units for the HPS. The response rates for six waves of data collection from 6 January to 29 March 2021 ranged from 6.4 to 7.5% [Citation18]. This study was reviewed by the Tufts University Health Sciences Institutional Review Board and was not considered human subjects research.
COVID-19 questions
Beginning on 6 January 2021, the HPS added questions on COVID-19 vaccination coverage, intent, and reasons for not vaccinating. COVID-19 vaccination receipt (≥1 dose or fully vaccinated) was assessed by the following questions: “Have you received a COVID-19 vaccine?” and “Did you receive (or do you plan to receive) all required doses?” Among unvaccinated adults, intent to be vaccinated was assessed with the following question: “Once a vaccine to prevent COVID-19 is available to you, would you…definitely, probably, probably not, or definitely not get a vaccine”. Among all non-vaccinated respondents who did not report that they definitely planned to get vaccinated, respondents were asked reasons for not getting vaccinated: “Which of the following, if any, are reasons that you [probably will/probably won't/definitely won't] [get a COVID-19 vaccine/won't receive all required doses of a COVID-19 vaccine]”. Response options, in which respondents could select all that apply, were: (1) I am concerned about possible side effects of a COVID-19 vaccine, (2) I don't know if a COVID-19 vaccine will work, (3) I don't believe I need a COVID-19 vaccine, (4) I don't like vaccines, (5) My doctor has not recommended it, (6) I plan to wait and see if it is safe and may get it later, (7) I think other people need it more than I do right now, (8) I am concerned about the cost of a COVID-19 vaccine, (9) I don't trust COVID-19 vaccines, (10) I don't trust the government, and (11) Other (please specify). These questions underwent expert review at the Census Bureau and federal partner agencies, as well as cognitive testing labs at the Centre for Disease Control and Prevention (CDC) National Centre for Health Statistics.
Sociodemographic variables
Sociodemographic variables assessed were age group, sex, race/ethnicity, educational status, annual household income, insurance status, previous COVID-19 diagnosis, difficulty in paying for usual household expenses in the last seven days, receipt of benefits from the Supplemental Nutrition Assistance Program (SNAP) or the Food Stamp Program, having enough food to eat, and housing type. Age was categorized as 18–49, 50–64, and ≥65 years. Race/ethnicity was categorized as non-Hispanic (NH) white, NH black, Hispanic, NH Asian, and NH other/multiple races. Educational status was categorized as some high school or less, some college or college graduate, and above college graduate. Annual household income was categorized as <$35,000, $35,000–$49,999, $50,000–$74,999, ≥$75,000, or whether it was not reported. Insurance status was defined as having insurance or not having insurance. Previous COVID-19 diagnosis was defined as a “yes” response to the following question: “Has a doctor or other healthcare provider ever told you that you have COVID-19?” Having enough food to eat was categorized as “yes” if the respondent indicated having enough food to eat, regardless of whether the food is or is not always the kind of food that the respondent wanted to eat. Having enough food to eat was categorized as “no” if the respondent indicated that he/she sometimes or often did not have enough to eat. Housing type was categorized as (1) single-family home (defined as a one-family house detached from any other house), (2) condo or townhouse (defined as a one-family house attached to one or more houses), (3) multi-unit housing (defined as a building with two or more apartments), or (4) other (i.e. mobile home, boat, van, or recreational vehicle).
Analysis
Receipt of ≥1 dose of COVID-19 vaccine and intent to get vaccinated was assessed for each survey wave overall and by sociodemographic characteristics and geographic area. Because the vaccination intent questions were only asked of those who were not vaccinated or did not plan to be fully vaccinated, measuring intent over time would show bias as more people get vaccinated (reducing the sample size of those who are asked about intent). To reduce this potential for bias, vaccination intent was assessed among everyone in the sample, including those who were vaccinated [Citation19]. We categorized “definite intent” as those that had at least one dose of the vaccine or those who reported that they would “definitely” be vaccinated, and “probable intent” as those that had at least one dose of the vaccine or those who reported that they would “definitely or probably” be vaccinated. Definite and probable intent to get vaccinated were examined by sociodemographic characteristics and region, state, and select MSAs for six waves of data collection (6–18 January, 20 January–1 February, 3–15 February, 17 February–1 March, 3–15 March, and 17–29 March).
Differences in definite and probable intent were assessed from January to March overall and by socioeconomic characteristics and geographic areas. Contrast tests for the differences in proportions, comparing each category to the reference category were conducted with a 0.05 significance level (α = 0.05). Factors associated with definite and probable intent were examined in multivariable logistic regression models combining data from January to March. Prevalence ratios were assessed for vaccination intent while adjusting for age group, sex, race/ethnicity, educational status, annual household income, previous COVID-19 diagnosis, difficulty paying for household expenses, receipt of SNAP or Food Stamp benefits, having enough food to eat, and housing type. Proportions and 95%CIs of reasons for not getting vaccinated were stratified by three categories of intent (e.g. probably, probably won't, and definitely won't get a COVID-19 vaccine) from January to March, and differences were assessed by t-tests. Analyses accounted for the survey design and replicate weights using balanced replicate weighting procedures in SAS (version 9.4; SAS Institute, Inc.) and Stata (version 16.1). All results presented in this report are significant and noted otherwise if they are not.
Results
Differences in intent
Receipt of ≥1 dose of a COVID-19 vaccine and definite and probable intent increased from 6 January to 29 March 2021 (). Specifically, vaccination receipt and definite intent to get vaccinated increased from 54.7% in early January to 72.3% in late March, for an increase of 17.6 percentage points (pp). Potentially achievable coverage, or vaccination receipt and intent to definitely or probably get vaccinated, increased from 78.4% in early January to 84.4% in late March, for an increase of 6.0 pp. The proportion of adults who definitely did not plan to get vaccinated decreased from 8.8% in early January to 7.6% in late March; however, this difference was not significant. Definite and probable intent to get vaccinated increased across all sociodemographic characteristics from early January to late March ( and ). However, the difference in vaccination intent was highest among non-Hispanic blacks (definitely: 30.3 pp increase, probably: 15.9 pp increase) ( and ).
Figure 1. COVID-19 v accination receipt (≥1 dose) and intent by survey week, United States, 6 January to 29 March 2021.
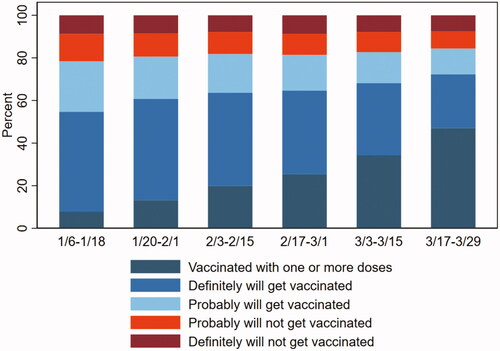
Table 1. Differences in and factors associated with receipt of ≥1 dose of COVID-19 vaccine and definite intent to get vaccinated among adults ≥18 years old, by socioeconomic characteristics and survey week, United States, 6 January to 29 March 2021.
Vaccination intent by socioeconomic status
In multivariable analyses, factors associated with intent to definitely or probably get vaccinated were age group, sex, race/ethnicity, educational attainment, annual household income, insurance status, previous COVID-19 diagnosis, difficulty paying for household expenses, receiving benefits from the Supplemental Nutrition Assistance Program (SNAP) or the Food Stamp Program, having enough food to eat, and housing type ( and ). Compared to adults aged 18–49 years, older adults were more likely to definitely plan to get vaccinated [≥65 years: adjusted prevalence ratio (aPR) = 1.45, 95% confidence interval (CI): 1.44–1.47; 50–64 years: aPR = 1.19, 95% CI: 1.18–1.20] (). Compared to non-Hispanic white adults, non-Hispanic Asian (aPR = 1.17, 95% CI: 1.16–1.19) and Hispanic adults (PR = 1.08, 95% CI: 1.06–1.09) were more likely to definitely get vaccinated; however, non-Hispanic black adults (aPR = 0.86, 95% CI: 0.85–0.88) and adults of other races (aPR = 0.93, 95% CI: 0.90–0.95) were less likely to definitely get vaccinated. Adults with lower education or lower incomes were less likely to definitely plan to get vaccinated. Adults who were not insured had difficulty paying for usual household expenses in the last 7 days, received benefits from SNAP or the Food Stamp program, or did not have enough to eat were also less likely to plan to get vaccinated than their respective counterparts ( and ). Compared to adults living in single-family homes, adults living in multi-unit housing were more likely to get vaccinated or definitely intend to get vaccinated (aPR = 1.06, 95% CI: 1.05–1.08) but adults living in other housing types, such as mobile homes, boat, van, or recreational vehicles were less likely (aPR = 0.84, 95% CI: 0.82–0.87). Adults who had a previous COVID-19 diagnosis or were not sure if they had a previous diagnosis were less likely to get vaccinated or definitely intend to get vaccinated than adults who never had COVID-19 (aPR = 0.92, 95% CI: 0.90–0.93; and 0.80, 95% CI: 0.74–0.85, respectively). Disparities by socioeconomic characteristics were similar for adults with probable intent to get vaccinated ().
Vaccination intent by geographic area
Vaccination receipt and intent to definitely get vaccinated increased from January to March across all Health and Human Services (HHS) regions, states, and 15 MSAs (); however, this continued to be lowest in Region 4 (Southeastern states: Alabama, Florida, Georgia, Kentucky, Mississippi, North Carolina, South Carolina, Tennessee) from January to March compared to all other regions. During March 17–29, definite intent ranged from 67.3% (Region 4) to 79.9% (Region 1; Northeast). Across states and the District of Columbia during this time frame, definite intent was highest for the District of Columbia (85.4%) and lowest for Wyoming (57.2%). Among the 15 MSAs during this time frame, the intent was highest for the San Francisco-Oakland-Berkeley, California Metro Area (86.1%) and lowest for the Phoenix-Mesa-Chandler, Arizona Metro Area (68.3%).
Table 2. Reasons for not intending to get a COVID-19 vaccine among adults ≥18 years old, by vaccination intent, United States, 6 January to 29 March 2021.
Reasons for not getting vaccinated
Reasons for not getting vaccinated changed slightly from January to March (). For example, the belief that the vaccine is not needed to be increased by 2.0, 5.8, and 5.6 pp among those who probably will, probably will not, or definitely will not get vaccinated, respectively. In late March, the main reasons among those who reported that they probably will or probably will not get vaccinated were that they plan to wait and see if it is safe and may get it later, they were concerned about possible side effects, and they believe other people need it more. Among those who reported that they definitely will not get vaccinated, the main reasons were distrust of COVID-19 vaccines (47.9%), concern about possible side effects (46.5%), and distrust in the government (40.1%).
Conclusion and discussion
While both receipt of and intention to get a COVID-19 vaccine have increased since January 2021, particularly among racial/ethnic groups, such as non-Hispanic black adults, almost one in 10 adults do not definitely plan to get vaccinated as of late March, with no significant improvement from early January. This may represent groups who are more reluctant to get vaccinated and may require additional efforts for increasing vaccination uptake, such as providing clear messages on vaccine safety and efficacy, highlighting vaccines as critical to resuming social activities, encouraging healthcare providers to recommend or have conversations about the importance of vaccines, and engaging communities to promote vaccine uptake and confidence. In addition to age and racial/ethnic differences in vaccine intentions, disparities continue to exist among vulnerable populations, such as individuals with lower levels of education and income, those lacking health insurance, and adults who have difficulty paying for usual household expenses, receive SNAP or Food Stamp benefits, or do not having enough food to eat. Although the COVID-19 vaccine is provided free of charge to all people in the United States [Citation20], the fact that people with lower incomes and those without health insurance were less likely to get the vaccine highlights the importance of understanding other barriers facing this population, including hesitancy and other logistical barriers.
It is concerning that people with a previous diagnosis of COVID-19 were less likely to get vaccinated or intend to get vaccinated and that the belief that the vaccine is not needed increased by 2–5 percentage points from January to March. Communicating to the public about the need for vaccination despite a history of COVID infection is important since it remains uncertain if infection confers immunity and if so, the duration of protection. The CDC recommends that people be vaccinated regardless of the history of prior infection of SARS-CoV-2 [Citation21].
COVID-19 vaccination coverage and intent varied by HHS region, state, and MSA. From January to March, vaccination intent was lowest in Region 4 (Alabama, Florida, Georgia, Kentucky, Mississippi, North Carolina, South Carolina, Tennessee). Lower vaccination and intent among these southeastern states may be driven by access issues, such as vaccine supply, vaccination clinic availability, lack of prioritization of vulnerable groups, or vaccine hesitancy [Citation11]. Previous studies have found that states and counties with high social vulnerability (poverty, unemployment, low income, and no high school diploma) had lower vaccination receipts [Citation11]. States can increase vaccination coverage and intent by (1) increasing confidence in vaccines among vulnerable groups, (2) monitoring and addressing barriers to vaccination, (3) directing vaccines to vulnerable communities, (4) offering free transportation to vaccination sites or making vaccination sites at more accessible locations, and (5) engaging communities to build trust and collaboration [Citation11]. More efforts are needed to understand these differences among states to identify best practices for improving COVID-19 receipt.
The findings in this study are subject to several limitations. First, although sampling methods and data weighting were designed to produce nationally representative results, respondents might not be fully representative of the general U.S. adult population. For example, a report found that data from the Household Pulse Survey may overestimate COVID-19 vaccination compared to the CDC’s COVID Data Tracker, which is derived from provider-reported state Immunization Information Systems [Citation22]. Second, vaccination status was self-reported and is subject to social desirabilitybias. Third, the HPS has a low response rate (<10%); although the non-response bias assessment conducted by the Census Bureau found that the survey weights adjusted for most of this bias [Citation23], some bias may remain. Finally, the HPS is a cross-sectional survey, and analysis of changes in perception from the same sample of persons was not possible.
Continued disparities in vaccination receipt and intent among different sociodemographic and geographic populations underscore the need for continued efforts to reach underserved communities, many of which are experiencing a disproportionate burden of COVID-19 infections and deaths. Vaccination intent was lowest among younger adults and non-Hispanic Black and non-Hispanic other racial groups, highlighting the importance of tailoring messages to increase vaccination uptake and confidence among these groups. In addition, despite the vaccine being available to everyone for free, many people, particularly vulnerable populations, are still hesitant about getting vaccinated. Recent polls show that the public’s enthusiasm for getting a COVID-19 vaccination has reached a plateau, and supply is now outstripping demand [Citation24,Citation25]. As public health officials attempt to vaccinate more hesitant groups, understanding barriers to vaccination and increasing confidence in vaccines will be essential to achieve the goal of herd immunity. Sharing clear and accurate messages about COVID-19 vaccines, highlighting vaccines as important for resuming social activities, ensuring that healthcare providers are recommending (or having discussions about the importance of) vaccination, and engaging communities and individuals reinforce the public’s confidence and trust in COVID-19 vaccines [Citation26].
Author contributions
Dr. Kimberly Nguyen conceptualized and designed the study, drafted the initial manuscript, and reviewed and revised the manuscript.
Ms. Kimchi Nguyen contributed to the conception and design of the study, carried out the analyses and the interpretation of the data, and critically reviewed the manuscript for important intellectual content.
Drs. Laura Corlin, Jennifer Allen, and Mei Chung contributed to the conception and design of the study and interpretation of the data and critically reviewed the manuscript for important intellectual content.
All authors approved the final manuscript as submitted and agree to be accountable for all aspects of the work.
Disclosure statement
The authors have no conflicts of interest relevant to this article to disclose. None of the authors have financial relationships relevant to this article to disclose.
Data availability statement
The data that support the findings of this study are publicly available at https://www.census.gov/programs-surveys/household-pulse-survey/datasets.html.
Additional information
Funding
References
- COVID-19 Vaccinations in the United States. CDC. Available from: https://covid.cdc.gov/covid-data-tracker/#vaccinations.
- Dooling K, McClung N, Chamberland M, et al. The Advisory Committee on immunization practices' interim recommendation for allocating initial supplies of COVID-19 vaccine – United States, 2020. MMWR Morb Mortal Wkly Rep. 2020;69(49):1857–1859.
- Dooling K, Marin M, Wallace M, et al. The Advisory Committee on immunization practices' updated interim recommendation for allocation of COVID-19 vaccine – United States, December 2020. MMWR Morb Mortal Wkly Rep. 2021;69(5152):1657–1660.
- Howard J. All 50 states now have expanded or will expand Covid vaccine eligibility to everyone 16 and up. CNN. Available from: https://www.cnn.com/2021/03/30/health/states-covid-19-vaccine-eligibility-bn/index.html
- Kim S. COVID vaccine eligibility by state. Newsweek. Available from: https://www.newsweek.com/covid-19-vaccine-eligibility-state-coronavirus-vaccination-1581644
- Nguyen KH, Srivastav A, Razzaghi H, et al. COVID-19 vaccination intent, perceptions, and reasons for not vaccinating among groups prioritized for early vaccination – United States, September and December 2020. MMWR Morb Mortal Wkly Rep. 2021;70(6):217–222.
- Nguyen KH, Kahn K, Hoehner J, et al. COVID-19 vaccination intent, perceptions, and reasons for not vaccinating among groups prioritized for early vaccination, United States, September 2020. CDC. Available from: https://www.cdc.gov/vaccines/imz-managers/coverage/adultvaxview/pubs-resources/COVID-online-report2020.html
- Growing share of Americans say they plan to get a COVID-19 vaccine – or already have. Pew Research. Available from: https://www.pewresearch.org/science/2021/03/05/growing-share-of-americans-say-they-plan-to-get-a-covid-19-vaccine-or-already-have/
- KFF COVID-19 vaccine monitor: February 2021. KFF. Available from: https://www.kff.org/coronavirus-covid-19/poll-finding/kff-covid-19-vaccine-monitor-february-2021/
- Kriss JL, Reynolds LE, Wang A, et al. COVID-19 vaccine second-dose completion and interval between first and second doses among vaccinated persons – United States, December 14, 2020–February 14, 2021. MMWR Morb Mortal Wkly Rep. 2021;70(11):389–395.
- Hughes MM, Wang A, Grossman MK, et al. County-level COVID-19 vaccination coverage and social vulnerability – United States, December 14, 2020–March 1, 2021. MMWR Morb Mortal Wkly Rep. 2021;70(12):431–436.
- COVID-19 vaccine emergency use authorization (EUA) fact sheets for recipients and caregivers. CDC. Available from: https://www.cdc.gov/vaccines/covid-19/eua/index.html
- Wortham JM, Lee JT, Althomsons S, et al. Characteristics of persons who died with COVID-19 – United States, February 12–May 18, 2020. MMWR Morb Mortal Wkly Rep. 2020;69(28):923–929.
- Millet GA, Jones AT, Benkeser D, et al. Assessing differential impacts of COVID-19 on Black Communities. Ann Epidemiol. 2020;47:37–44.
- Price-Haywood EG, Burton J, Fort D, et al. Hospitalization and mortality among Black patients and White patients with covid-19. N Engl J Med. 2020;382(26):2534–2543.
- CDC. National Center for Immunization and Respiratory Diseases (NCIRD), Division of Viral Diseases. Risk for COVID-19 infection, hospitalization, and death by race/ethnicity [updated 2021 Mar 12]. Available from: https://www.cdc.gov/coronavirus/2019-ncov/covid-data/investigations-discovery/hospitalization-death-by-race-ethnicity.html
- Household Pulse Survey. Census Bureau. Available from: https://www.census.gov/data/experimental-data-products/household-pulse-survey.html.
- Source of the data and accuracy of the estimates for the 2020 household pulse survey. Census Bureau. Available from: https://www2.census.gov/programs-surveys/demo/technical-documentation/hhp/Phase3_Source_and_Accuracy_Week_27.pdf
- Brewer NT, Gilkey MB, Thompson P. RE: progress in HPV vaccine hesitancy. Pediatrics. 2021;147(6):e2021051391A.
- Frequently asked questions about COVID-19 vaccination. CDC. Available from: https://www.cdc.gov/coronavirus/2019-ncov/vaccines/faq.html.
- CDC. Interim Clinical Considerations for Use of COVID-19 Vaccines Currently Authorized in the United States; 2021 [cited 2021 Apr 11]. Available from: https://www.cdc.gov/vaccines/covid-19/info-by-product/clinical-considerations.html?CDC_AA_refVal=https%3A%2F%2Fwww.cdc.gov%2Fvaccines%2Fcovid-19%2Finfo-by-product%2Fpfizer%2Fclinical-considerations.html
- Nguyen KH, Lu P, Meador S, et al. Comparison of COVID-19 vaccination coverage estimates from the household pulse survey, omnibus panel surveys, and COVID-19 vaccine administration data, United States, March 2021. CDC. Available from: https://www.cdc.gov/vaccines/imz-managers/coverage/adultvaxview/pubs-resources/covid19-coverage-estimates-comparison.html
- Nonresponse bias report for the 2020 household pulse survey. Census Bureau. Available from: https://www2.census.gov/programs-surveys/demo/technical-documentation/hhp/2020_HPS_NR_Bias_Report-final.pdf
- Poll shows COVID-19 vaccine enthusiasm has reached a plateau. The Hill. Available from: https://thehill.com/policy/healthcare/552129-poll-shows-covid-vaccine-enthusiasm-has-reached-a-plateau
- Covid vaccinations are slowing in the U.S. as supply outstrips demand. How states are targeting who's left. CNBC. Available from: https://www.cnbc.com/2021/04/30/covid-vaccinations-in-us-are-slowing-as-supply-outstrips-demand.html
- Vaccinate with confidence. CDC. Available from: https://www.cdc.gov/vaccines/partners/vaccinate-with-confidence.html