
Abstract
Background
Associating liver partition and portal vein ligation (ALPPS) technique is a promising strategy for unresectable primary liver tumours without sufficient future liver remnants (FLRs).
Objective
Our study explored the effect of corosolic acid (CA) on inhibiting tumour growth without compromising ALPPS-induced liver regeneration.
Methods
The ALPPS procedure was performed in Sprague–Dawley rats with orthotopic liver cancer. Blood, tumour, and FLR samples were collected, and the effect of CA on the inhibition of tumour progression and ALPPS-induced liver regeneration, and its possible mechanism, were investigated.
Results
The tumour weight in the implantation/ALPPS group was higher than in the implantation without ALPPS group (p < .05), and the tumour weight in the implantation/ALPPS/CA group was lower than in the implantation/ALPPS group (p < .05). On postoperative day 15, the hepatic regeneration rate, and the expression of Ki67+ hepatocytes in the FLRs had increased significantly in the group that underwent ALPPS. The number of cluster of differentiation (CD) 86+ macrophages markedly increased in the FLRs and in the tumours of groups that underwent the ALPPS procedure. Additionally, the number of CD206+ macrophages was higher than the number of CD86+ macrophages in the tumours of the implantation and the implantation/ALPPS groups (p < .01, respectively); however, the opposite results were observed in the CA groups. The administration of CA downregulated the expression of transforming growth factor-beta (TGF-β), CD31, and programmed cell death protein 1 (PD-1) but increased the number of CD8+ lymphocytes in tumours.
Conclusion
Corosolic acid inhibits tumour growth without compromising ALPPS-induced liver regeneration. This result may be attributed to the CA-induced downregulation of PD-1 and TGF-β expression and the increased CD8+ lymphocyte infiltration in tumour tissue associated with the suppression of M2 macrophage polarisation.
This study aimed to investigate the effect of CA on ALPPS-induced liver regeneration and hepatic tumour progression after ALPPS-induced liver regeneration.
Corosolic acid inhibits tumour growth without compromising ALPPS-induced liver regeneration. This result may be attributed to the CA-induced downregulation of PD-1 and TGF-β expression and the increased CD8+ lymphocyte infiltration in tumour tissue associated with the suppression of M2 macrophage polarisation.
Key Messages
Introduction
Associating liver partition and portal vein ligation (ALPPS) was proposed as a promising therapeutic surgical strategy for unresectable primary liver tumours without sufficient future liver remnants (FLRs) [Citation1]. The benefit of the ALPPS technique is that it induces more FLR growth in less time compared with classic approaches, such as portal vein embolisation and portal vein ligation [Citation2,Citation3]. The primary disadvantage of ALPPS is its high morbidity and mortality rates [Citation4,Citation5]. Satisfyingly, the morbidity and mortality rates in this field continue to decline with the development of experience and learning-curve achievements [Citation6–8]. However, a criticism of ALPPS focuses on the simultaneous massive stimulation of tumour growth along with the growth of residual tumour cells in the FLR. Several studies [Citation8–11] using clinical and experimental data [Citation3,Citation12,Citation13] showed inconsistent results. In addition, early tumour recurrence in clinical practice remains one of the main criticisms of ALPPS, the reasons for which remain unknown [Citation9–11]. Accordingly, there is an urgent need for drugs that can effectively inhibit tumour growth while minimising the effect on liver regeneration.
Corosolic acid (CA), a pentacyclic triterpene compound, is one of the lipophilic triterpene acids extracted from Lagerstroemia speciosa leaves [Citation14,Citation15]. It has been shown to have excellent antitumor-promoting potency in several types of tumours both in vitro and in vivo, and the targets of its antitumor effects include the signal transducer and activator of transcription (STAT)-3, nuclear factor kappa B (NF-κB), and Wnt/β-catenin [Citation16,Citation17]. However, the role of CA in liver tumours affected by the stimulation of liver regeneration remains largely unknown. It is also unclear whether transforming growth factor-beta (TGF-β)/vascular endothelial growth factor (VEGF), and programmed cell death protein (PD)-1/PD ligand 1 (PD-L1) pathways play a pivotal role in CA-induced tumour cell death. The current study aimed to investigate the effect of CA on ALPPS-induced liver regeneration and hepatic tumour progression after ALPPS-induced liver regeneration.
Method
Animals and ethical statements
All animal experiments were performed on four-week-old inbred male Sprague–Dawley (SD) rats weighing 180–200 g. The rats were obtained from the Animal Laboratories of Jilin University (China). The animals had free access to tap water and were fed a standard laboratory diet.
Cell culture
The Walker-256 carcinosarcoma rat cell line was obtained from the cell bank of the Experimental Animal Centre of the Cancer Hospital of the Chinese Academy of Sciences.
Harvesting the walker-256 tumour cells
The Walker-256 tumour cells were harvested as previously described [Citation18]. One millilitre of cell suspension containing approximately 2 × 10⁷ cells was inoculated into four-week-old male SD rats (n = 4) at a site on the inner thigh, 10 days after tumour-cell injection. Subcutaneous tumours (approximately 1.5 cm in diameter) were observed at the injection site.
Experimental groups
Experiments were conducted on the following animal groups. Group 1 (mock, n = 5); only a midline laparostomy was performed following manipulation of the liver hilum. Group 2 (implantation without ALPPS, n = 5); tumour tissue was implanted on the left and right parts of the median lobe. Group 3 (implantation/ALPPS, n = 5); tumour tissue was implanted, and the animals underwent the ALPPS procedure. Group 4 (implantation/ALPPS/CA, n = 5); tumour tissue was implanted, and the animals underwent the ALPPS procedure and were treated with CA.
Following the preoperative preparation, the skin of rats was cleaned with iodine and 70% alcohol. The animals were anaesthetised with 30 mg/kg of barbital sodium (Ketalar; Par Pharmaceutical Co., Inc., Spring Valley, NY, USA) via intraperitoneal injection. Following a midline laparotomy, the liver was dissected from its ligaments. Portal vein ligation of the right lobe, the common branch of the left lateral lobe, and the left median lobe was conducted, in addition to a caudate lobectomy, and the in situ splitting of the right and left parts of the median lobe was performed in groups 3 and 4. Following the ALPPS procedure [Citation19], the median lobe was explored, and the right and left median lobes were carefully pierced with an orthopaedic puncture needle [Citation20]. Then, the tumour tissue was inserted into the lobe, and gel foam was used to cover the wound and to stop the bleeding. In group 2, tumour tissue was implanted within the left and right median lobes in the same manner but in the absence of the ALPPS procedure. In group 4, continuous intraperitoneal injections of CA at a concentration of 20 mg/kg were given every two days starting on postoperative day 3 (POD3).
At POD15, all the animals were sacrificed following the intraperitoneal injection of an anaesthetic. Liver, lung, kidney, and tumour tissue were dissected and fixed in 4% buffered formalin for 24 h. Blood samples were collected by cardiac puncture, and the sera were stored at −80 °C.
Biochemical analysis
Serum aspartate aminotransferase (AST, C010-3), alanine transaminase (ALT, C009-3), albumin (ALB, C028-1), urea nitrogen (UREA, 013-2), and creatinine (CREA, 011-1) levels were measured using commercial assay kits (NanJing JianCheng Biological Technology, Inc., China) and a serum multiple biochemical analysers. Serum cytokine concentrations were measured using enzyme-linked immunosorbent assay kits (NanJing JianCheng Biological Technology, Inc., China) for interleukin (IL)-6 (A0107), tumour necrosis factor-alpha (TNF-α; A0119), IL-12 (A0111), TGF-β (A0134), and VEGF (A0176) according to the manufacturer’s instructions. At POD15, all the animals were sacrificed following the intraperitoneal injection of an anaesthetic after the tumour tissue had been inserted into the liver lobe, and we performed the quantifications of biochemical analysis after the blood samples had been collected.
Histological examination
The fixed tissue samples were embedded in paraffin. The blocks were sectioned at a thickness of 4 µm and then de-paraffinized. The dewaxing and rehydration of the sections were performed using the following procedure. The sections were incubated in xylene for 20 min, followed by decreasing the concentrations of ethanol (100%, 95%, and 75%), and were then washed with double-distilled water. Antigen retrieval was performed using the manufacturer’s buffer. The sections were blocked using 3% hydrogen peroxide and phosphate-buffered saline containing 5% bovine serum. Primary antibodies against cluster of differentiation (CD) 8 (ABclonal, A11856), CD86 (ABclonal, A10795), CD206 (ABclonal, A8301), CD31 (ABclonal, A0378), Ki67 (ABclonal, A11390), TGF-β (ABclonal, A10749), and PD-1 (ABclonal, A11973) were used in this study.
Image analysis
Immunohistochemical (IHC) staining was performed for each tissue slice. Cells that were treated with the nuclear deposition of violet pigment were positive (black arrow), while the nuclear deposition of blue pigment indicated negative cells (red arrow) (original magnification, x200). Tissue sections with primary antibodies replaced by rat isotype IgG1 served as a negative control. Five visual fields were selected from the top left, top right, bottom right, bottom left, and the middle of each slice and were imaged using a Minmei (v.9.5.2) microscope digital imaging system. The images were analysed using the ImagePro Plus 6.0 software program (Media Cybernetics, Rockville, MD, USA). The IHC images were opened in the ImagePro Plus software. Using the count and measure functions of the program, the positive cells were manually selected in several images to train the software. Following on, all the positive cells were automatically counted and processed by the software, and the sensitivity was set to level 4 [Citation21]. The number of nucleated cells with positive staining for the phenotypic marker in each area was counted. Data were reported as cells/mm2.
Statistical analysis
To conduct statistical analysis, the data were expressed as the mean ± standard deviation (SD). Statistical analyses were performed using the Mann–Whitney U test and a Student’s t-test. Differences with p < .05 were considered statistically significant. The statistical analyses were performed using the Prism 5.0 (GraphPad) software program.
Results
Macroscopic future liver remnants and transplanted tumour pathology
The ALPPS procedure was performed in SD rats with orthotopic liver cancer. The experiments were conducted on various groups including a mock group (group 1), an implantation without ALPPS group (group 2), an implantation/ALPPS group (group 3), and an implantation/ALPPS/CA group (group 4). To examine tumour growth, we conducted another experiment in which the animals were euthanized at POD10. We found that in groups 2, 3, and 4, the right and left median lobes were well-circumscribed with gray-white nodules that were different from those of the liver parenchyma in the area of inoculation; however, there was no difference in the size (mean volume; group 2, 265.0 mm3; group 3, 276.2 mm3; group 4, 295.2 mm3; p > .05, respectively) and the weight of the tumour tissue (mean weight; group 2, 0.36 g; group 3, 0.46 g; group 4, 0.41 g; p > .05, respectively). However, there were significant differences in the FLRs among the various groups ().
Table 1. The weight and size of the tumour in the FLR among group 2, group 3 and group 4 at POD10(V = ab2/2 (mm3)).
On POD15, all the animals were sacrificed, and the relevant markers were assayed. We found that in groups 2, 3, and 4, the right and left median lobes were well-circumscribed with gray-white nodules that were different from those of the liver parenchyma in the area of inoculation, without macroscopic signs of extrahepatic metastases or inoculation. Significantly enlarged right median lobes (FLRs) were observed in groups 3 and 4 after the ALPPS procedure. The size of the tumours in the FLR of group 4 was observed to be significantly smaller than those in group 3 (mean volume; 741.7 mm3 vs. 370.1 mm3, p < .05; see and ).
Figure 1. Surgical procedure images. (A) The associating liver partition and portal vein ligation (ALPPS) procedure in rats with orthotopic liver cancer: (a) exposure of the liver after laparotomy; (b) ligation of the portal vein branches. The silk knots (symbols on the image) represent the ligated portal vein (PV); 1 represents the PV of the right lobe (RL); 2 represents the hepatic pedicle of the caudate lobe (CL) and resected CL; 3 represents the PV of the left median lobe (LML) and left lateral lobe (LLL); (c) an ischaemic line emerging slightly to the right of the falciform ligament; (d) the median lobe (ML) was split in situ along the ischaemic line and implanted tumour tissue. (B) Exposure of the liver at POD15; (a) group 1, showing a normal liver; (b) group 2, showing the tumour observed within the LML and RML; (c) group 3, showing the future liver remnant (FLR) (RML) regeneration and the enlarged tumour observed within the LML and RML; (d) group 4, showing FLR (RML) regeneration and a reduced tumour within the LML and RML. (C) The resected ML; (a) group 1, the mock group; (b) group 2, the implantation without ALPPS group; (c) group 3, the implantation/ALPPS group; (d) group 4: the implantation/ALPPS/CA group.
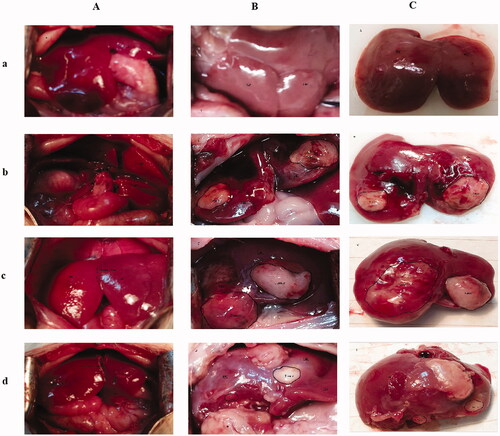
Table 2. The size (V = ab2/2 (mm3)) of tumour in the FLR among group 2, group 3 and group 4 at POD15.
Associating liver partition and portal vein ligation-induced liver regeneration is closely related to CD86+ Kupffer cells
We compared the hepatic regeneration rate (HRRs) among the different groups relative to those of the right median lobe (FLR). The HRRs of the groups that underwent the ALPPS procedure (group 3, 197.5 ± 7.4%, and group 4, 212.6 ± 12.1%) were significantly higher than those in the groups where the ALPPS procedure was not performed (group 1, 15.2 ± 3.8%, and group 2, 14.6 ± 3.7%, p < .01, respectively; see ).
Figure 2. The association between liver partition and portal vein ligation-induced liver regeneration is closely related to CD86+ Kupffer cells. (A) Associating liver partition and portal vein ligation-induced liver regeneration. (B) The number of CD86-positive Kupffer cells per square millimetre. (C) The number of CD206-positive Kupffer cells per square millimetre. (D) The number of Ki-67-positive hepatocytes per square millimetre. (E) Immunohistochemical staining for CD86 in the regenerating lobes in each group. (F) Immunohistochemical staining for CD206 in the regenerating lobes in each group. (G) Immunohistochemical staining for Ki-67 in the regenerating lobes in each group; scale bars, 50 µm. *P < .01 group 1 compared with group 3/group 4; **P < .01 group 2 compared with group 3/group 4. Cells that include the nuclear deposition of violet pigment were positive (black arrow), and cells with nuclear blue pigment deposition were negative (red arrow) (original magnification x200). Values are shown as the means ± the standard deviation. Group 1 is the mock group; group 2 is the implantation without ALPPS group; group 3 is the implantation/ALPPS group; group 4 is the implantation/ALPPS/CA group.
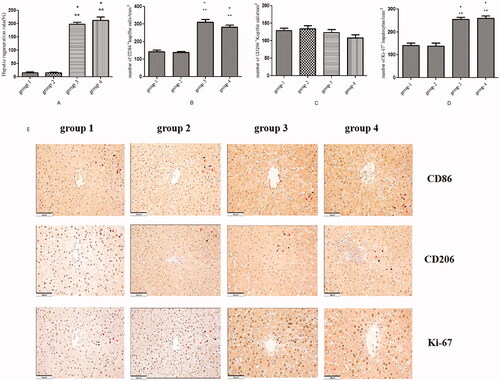
To verify the possible role of activated Kupffer cells (KCs) in ALPPS-induced liver regeneration, we measured the number of CD86+ (a specific M1 macrophage marker) and CD206+ (a specific M2 macrophage marker) KCs. In the liver, the number of CD86+ KCs per square millimetre (magnification, x20) in the groups that underwent the ALPPS procedure (group 3, 309.9 ± 16.1, and group 4, 283.2 ± 10.3) was significantly higher compared with the groups that did not undergo the ALPPS procedure (group 1, 142.2 ± 9.9, and group 2, 138.7 ± 6.1, p < .01, respectively; see ). Although the number of CD206+ KCs in the groups that underwent the ALPPS procedure (group 3, 123.4 ± 8.7, and group 4, 108.2 ± 8.8) was lower than in the groups where the ALPPS procedure was not effected (group 1, 129.0 ± 7.3, and group 2, 134.6 ± 8.4), there was no significant difference (all results p > .05; see ). In addition, there was no difference in the number of CD86+ KCs between groups 1 and 2 (p > .05). There was also no difference in the number of CD86+ KCs in group 4 compared with group 3 (p > .05). At POD15, the number of Ki67+ hepatocytes per square millimetre in the groups that underwent the ALPPS procedure (group 3, 255.3 ± 8.8, and group 4, 259.5 ± 11.1) was significantly higher than in the groups that did not undergo the ALPPS procedure (group 1, 141.0 ± 11.1, and group 2, 137.6 ± 14.1, p < .01, respectively; see ).
Existing studies have demonstrated that the inflammatory response may be among the multiple regenerative stimuli driven by the ALPPS procedure and that KCs are a source of proinflammatory mediators [Citation22]. Therefore, we also measured the serum levels of the proinflammatory cytokines IL-6, TNF-α, and IL-12. Our results showed that, at POD15, there were no differences between the groups that underwent the ALPPS procedure and the groups that did not receive this surgery (no data shown); this was similar to a previously reported profile on proinflammatory cytokines secreted by KCs during the early stage of liver regeneration [Citation23,Citation24]. Xu et al. [Citation23] showed that the expression of TGF-α, TNF, and IL-6 in KCs significantly increased during this period (24 ∼ 36 h) following partial hepatectomy (PH); the expression decreased after 36 h.
Corosolic acid inhibits tumour growth without compromising associating liver partition and portal vein ligation-induced liver regeneration
The HRR of group 3 was significantly higher compared with group 2 (p < .01; see ). The number of Ki67+ hepatocytes per square millimetre in the right median lobe of group 3 was greater than in group 2 (p < .01; see ). Additionally, the tumour weight of group 3 (0.84 ± 0.10) was significantly higher than in group 2 (0.45 ± 0.08, p < .05; see ). The number (337.8 ± 20.2) of Ki67+ tumour cells in the right median lobe of group 3 was greater than in group 2 (270.4 ± 17.1, p < .01; see ).
Figure 3. Corosolic acid inhibits tumour growth without compromising associating liver partition and portal vein ligation-induced liver regeneration. (A) The tumour inhibition rate under corosolic acid treatment. (B) The number of Ki-67-positive tumour cells per square millimetre. (C) Immunohistochemical (HIC) staining for tumour cells in the regenerating lobes in each group. (D) Immunohistochemical staining for Ki-67 in tumour tissue in the regenerating lobes in each group. Scale bars, 50 µm. *P < .01 for group 2 compared with group 3; **P < .01 group 3 compared with group 4; ***P < .05 group 2 compared with group 3. The HE staining of cells with violet-blue nuclear deposition pigment was positive; the HE staining of Ki-67 cells with the nuclear deposition of violet pigment was positive (black arrow), and the nuclear deposition of blue pigment was negative (red arrow) (original magnification x200). Values are shown as the means ± the standard deviation. Group 1 is the mock group; group 2 is the implantation without associating liver partition and portal vein ligation (ALPPS) group; group 3 is the implantation/ALPPS group; group 4 is the implantation/ALPPS/CA group.
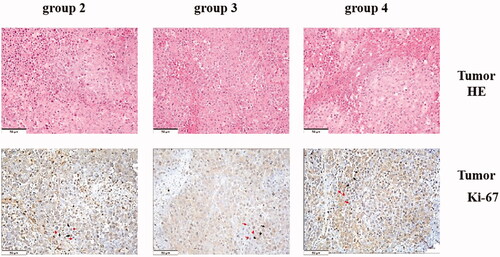
The effect of CA on liver regeneration has not been reported in previous literature. There were no differences between groups 3 and 4 in the HRR or the number of Ki67+ hepatocytes in the right median lobe, which suggested that the administration of CA did not affect liver regeneration or hepatocyte proliferation. However, interestingly, the tumour weight of group 4 (0.41 ± 0.16) was lower compared with group 3 (0.84 ± 0.10, p < .05). The number (253.8 ± 13.2) of Ki67+ tumour cells per square millimetre in the right median lobe of group 4 was significantly decreased compared with group 3 (p < .01; see ).
Administration of corosolic acid does not aggravate organ damage after associating liver partition and portal vein ligation
We observed some histopathologic changes in the lungs, kidneys, and livers of the animals in groups 2, 3, and 4 but not in group 1. Pulmonary interstitial edoema, the widening of the alveolar septum and inflammatory cell infiltration in the lung, the inflammatory cell infiltration of small arteries and para-arterioles in the renal cortex of the kidney, inflammatory cell infiltration in the portal area, and thickening of the Glisson capsule in the liver were observed (see ).
Figure 4. Organ damage and changes in the liver–renal function after associating liver partition and portal vein ligation. (A) The immunohistochemical staining for the liver in the regenerating lobes in each group. No histopathological findings were observed in group 1; inflammatory cell infiltration in the portal area and thickness of the Glisson capsule were observed in the three remaining groups (black arrow). (B) The HE staining of the lungs in each group. Inflammatory cell infiltration was observed in group 1 (black arrow); pulmonary interstitial edoema, inflammatory cell infiltration (black arrow), and the wideness of the alveolar septum (red arrow) were observed in group 2; pulmonary interstitial edoema and inflammatory cell infiltration were observed in the two remaining groups (black arrow). (C) The HIC staining of the kidneys in each group. Inflammatory cell infiltration of small arteries and para-arterioles in the renal cortex was observed in each group (black arrow). (D) Liver function. (E) Renal function. Scale bars, 50 µm. α, P < .01 for group 1 vs. group 2; β, P < .01 for group 1 vs. group 3; ɣ, P < .01 for group 1 vs. group 4; δ, P < .01 for group 2 vs. group 3; ρ, P < .01 for group 2 vs. group 4. The values are the means ± the standard deviation. Group 1 is the mock group; group 2 is the implantation without associating liver partition and portal vein ligation (ALPPS) group; group 3 is the implantation/ALPPS group; group 4 is the implantation/ALPPS/CA group.
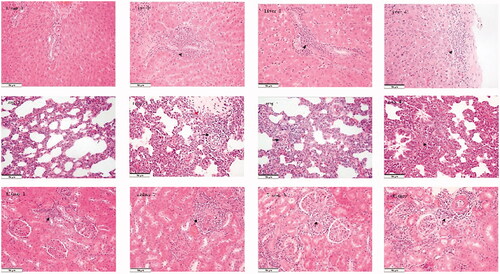
Furthermore, we assayed changes in liver and renal function (the serum levels of ALT, AST, ALB, UREA, and CREA). We found that ALPPS induced a significantly elevated ALT serum level (group 3, 91.3 ± 5.8, and group 4, 108.2 ± 6.4) and AST (group 3, 341.6 ± 22.4, and group 4, 390.5 ± 11.9), and caused a significant decrease in the serum level of ALB (group 3, 23.3 ± 1.8, and group 4, 25.2 ± 2.2) compared with those in the groups that did not undergo surgery (group 1 [ALT, 62.4 ± 1.5; AST, 246.0 ± 16.0; ALB, 37.9 ± 0.6], and group 2 [ALT, 67.0 ± 4.1; AST, 266.2 ± 9.0; ALB, 29.4 ± 1.0], p < .01, respectively; see ). However, there were no differences in the serum level of UREA or CREA among all four groups (data not shown; see ). Interestingly, there were no differences between groups 3 and 4 in ALT, AST, ALB, or bodyweight measures (209.8 ± 2.7 g; 208.8 ± 4.0 g; see ).
The administration of corosolic acid increases M1 and decreases M2 macrophages in tumours
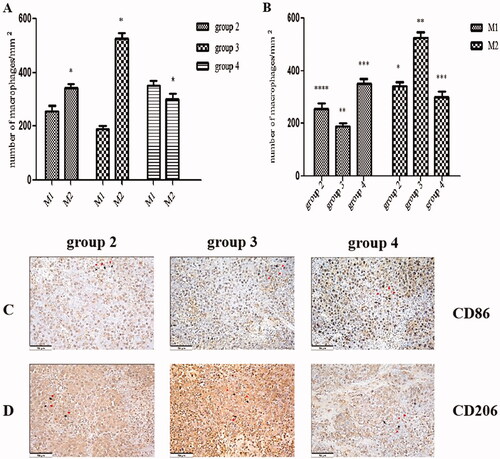
Next, we tested the effect of CA on the polarisation of tumour-associated macrophages (TAMs) in tumours via IHC (). The number (524.3 ± 23.3) of CD206+ M2 macrophages per square millimetre in tumour tissue in group 3 was significantly increased compared with group 2 (341.9 ± 16.3, p < .01; see ). In addition, the number of CD206+ M2 macrophages per square millimetre in the tumour tissue was significantly higher than the number (256.1 ± 18.9) of CD86+ M1 macrophages in the tumour tissue in group 2 (p < .01; see ). Similarly, the number of CD206+ M2 macrophages was significantly higher than the number (190.1 ± 10.1) of CD86+ M1 macrophages per square millimetre in the tumour tissue in group 3 (p < .01; see ). However, in group 4, the number (300.4 ± 21.3) of CD206+ M2 macrophages per square millimetre in the tumour tissue was significantly lower than the number (352.6 ± 17.3) of CD86+ M1 macrophages in the tumour tissue (p < .01; see ). In addition, the number of CD206+ M2 macrophages per square millimetre in group 4 was significantly decreased compared with group 3 (p < .01), and the number of CD206+ M1 macrophages in group 4 was significantly increased compared with group 3 (p < .01; see ).
Figure 5. The administration of corosolic acid increases M1 and decreases M2 macrophages in tumours. (A) The proportion of M1 and M2 macrophages per square millimetre in each group with implanted tumours. (B) The number of M1 and M2 macrophages per square millimetre in each group with implanted tumours. (C) The immunohistochemical (HIC) staining for CD86+ macrophages in the tumour tissue in each group with implanted tumours. (D) The HIC staining for CD206+ macrophages in tumour tissue in each group with implanted tumours. Scale bars, 50 µm. *P < .01 M1 vs. M2; group 2 vs. group 3; **P < .01 for group 3 vs. group 4; ***P < .01 for group 2 vs. group 4; ****P < .05 for group 2 vs. group 3. The HIC staining for cells with the nuclear deposition of violet pigment was positive (black arrow), and the nuclear deposition of blue pigment was negative (red arrow) (original magnification x200). Values are given as the means ± the standard deviation. Group 1 is the mock group; group 2 is the implantation without associating liver partition and portal vein ligation (ALPPS) group; group 3 is the implantation/ALPPS group; group 4 is the implantation/ALPPS/CA group.
Administration of corosolic acid downregulates the expression of transforming growth factor-beta and cluster of differentiation-31 in tumours
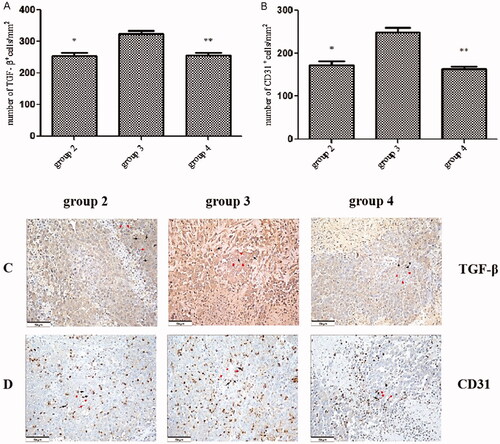
We examined the effect of CA administration on the expression of TGF-β and CD31 in tumours. A potent inducer of VEGF gene expression, TGF-β was reported to promote tumour spread and tumour-induced angiogenesis [Citation25], while CD31 is a marker of vascular endothelial differentiation. Tumour growth induced by ALPPS-triggered liver regeneration (group 3) significantly increased the number (324.0 ± 9.9) of TGF-β+ tumour cells per square millimetre compared with the group that did not undergo ALPPS (group 2; 253.5 ± 11.2, p < .01). The number (255.5 ± 9.0) of TGF-β+ tumour cells per square millimetre in group 4 was significantly lower than in group 3 (p < .01; see ). Furthermore, similar to TGF-β expression, there was a significant increase in the number of CD31+ cells per square millimetre in group 3 (249.2 ± 10.1) compared with group 2 (172.7 ± 9.0, p < .01). However, the number (163.8 ± 6.6) of CD31+ cells in group 4 was significantly decreased compared with group 3 (p < .01; see ). We also measured the serum levels of TGF-β and VEGF, and our results indicated no differences among the 3 groups (data not shown).
Figure 6. The expression of transforming growth factor-beta and cluster of differentiation 31 in tumours. (A) The number of transforming growth factor beta+ (TGF-β+) cells per square millimetre. (B) The number of CD31+ cells per square millimetre. (C) The immunohistochemical staining (HIC) for TGF-β+ cells in tumour tissue in each group. (D) The HIC staining for the cluster of differentiation (CD) 31+ cells in tumour tissue in each group. Scale bars, 50 µm. *P < .01 group 2 vs. group 3; **P < .01 group 3 vs. group 4. The HIC staining for cells with the nuclear deposition of violet pigment was positive (black arrow) and the nuclear deposition of blue pigment was negative (red arrow) (original magnification x200). Values are shown as the means ± the standard deviation. Group 1 is the mock group; group 2 is the implantation without ALPPS group; group 3 is the implantation/ALPPS group; group 4 is the implantation/ALPPS/CA group.
Administration of corosolic acid downregulates the expression of programmed cell death protein 1 and increases the number of infiltrating CD8+ lymphocytes in tumours
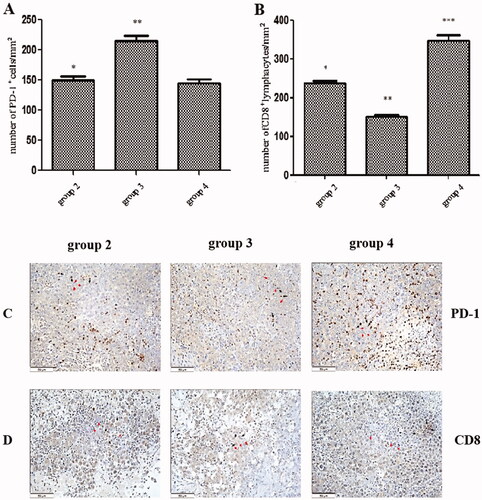
We investigated PD-1 expression and the number of infiltrating CD8+ lymphocytes in tumours. There was a significant increase in the number of PD-1+ cells per square millimetre in group 3 (215.3 ± 8.2) compared with group 2 (150.8 ± 5.2, p < .01). However, the number (145.2 ± 6.0) of PD-1+ cells per square millimetre in group 4 was significantly decreased compared with group 3 (p < .01; see ). In contrast, the number (151.8 ± 4.7) of infiltrating CD8+ lymphocytes per square millimetre in group 3 was significantly decreased compared with group 2 (238.9 ± 5.5, p < .01, respectively); however, the number (347.5 ± 14.4) of infiltrating CD8+ lymphocytes per square millimetre in group 4 was significantly increased compared with group 3 (p < .01; see ). Group 4 exhibited lower PD-1 expression with a higher level of CD8+ lymphocyte staining compared with group 3.
Figure 7. The expression of programmed cell death protein-1 and infiltrated cluster of differentiation 8+ lymphocytes in tumours. (A) The number of programmed cell death protein-1+ cells per square millimetre. (B) The number of clusters of differentiation is 8+ cells per square millimetre. (C) The immunohistochemical (HIC) staining for programmed cell death protein-1+ cells in the tumour tissue in each group. (D) The HIC staining for a cluster of differentiation 8+ cells in tumour tissue in each group. Scale bars, 50 µm. *p < .01 group 2 vs. group 3; **p < .01 group 3 vs. group 4; ***p < .01 group 2 vs. group 4. The HIC staining for cells with the nuclear deposition of violet pigment was positive (black arrow), and the nuclear deposition of blue pigment was negative (red arrow) (original magnification x200). Values are given as the means ± the standard deviation. Group 1 is the mock group; group 2 is the implantation without ALPPS group; group 3 is the implantation/ALPPS group; group 4 is the implantation/CA group.
Discussion
In this study, to simulate clinical practice, we successfully established an orthotopic rat liver tumour model with double implantation in the right (FLR) and left (deportalized) median liver lobes. To investigate the effect of ALPPS-induced FLR regeneration on the growth of occult carcinomas, we focussed only on the effect of the FLR regeneration on the progression and growth of tumours implanted in the FLR.
Our data suggest that tumour growth within the FLR was promoted by ALPPS-induced liver regeneration. However, several studies that also focussed on the progression and growth of tumours affected by ALPPS-induced liver regeneration in animal models reported inconsistent results [Citation3,Citation12,Citation13]. Kikuch et al. [Citation12] suggested that ALPPS induced a rapid increase in FLR volume without affecting remnant tumour progression during the early postoperative period in a mouse model. Kambakamba et al. [Citation3] indicated that ALPPS-induced liver regeneration did not appear to enhance the growth of colorectal metastases. Rocio et al. [Citation13] described the effect of the ALPPS technique on the spread and progression of tumours in a rat model. Our orthotopic liver tumour model found that at POD15, the postoperative tumour weight and the number of Ki67-positive tumour cells were significantly higher among the rats that underwent the ALPPS procedure compared with those that did not, which indicated that ALPPS-induced liver regeneration accelerated tumour growth in the FLR. These inconsistent conclusions may be explained by inconstant postoperative observation time points. Existing reports by García-Pérez et al. [Citation26,Citation27] demonstrated that the ALPPS procedure induced an increase in KCs, which are associated with liver regeneration. In the present experiment, we observed that the ALPPS procedure induced hepatocyte proliferation, and the number of CD86-positive KCs increased dramatically after the ALPPS procedure, indicating that the ALPPS procedure induced hepatocyte proliferation, which was associated with CD86+ KCs. This increase was accompanied by the progression and growth of tumours. In the liver, macrophages form a heterogeneous population, which may be tissue-resident (Kupffer) cells or bone-marrow-derived cells recruited from the bloodstream [Citation28]. A recent report [Citation29] showed that a subset of F4/80hiGATA6+ macrophages in the peritoneal cavity could be rapidly recruited to the injured liver via the mesothelium, and played an important role during liver regeneration. Although KCs may provide initial support to cancer cells, recruited monocyte-derived macrophages are believed to be more plastic, influenced by the tumour microenvironment, and prone to switching from the M1 (antitumor) to the M2 (protumor) phenotype [Citation30]. García-Pérez et al. [Citation15] speculated that regenerative stimuli driven by proinflammatory and hypoxic environments played a role in tumour progression. Our data showed that ALPPS-induced liver regeneration may have promoted tumour growth, and the large tumour size in the group that underwent the ALPPS procedure resulted in a dramatic increase in the number of M2 macrophages in tumours compared with the group that did not undergo the ALPPS procedure. In addition, the majority of macrophages in the tumour tissues in the implantation-without-ALPPS group and the implantation/ALPPS group were CD206+ M2 macrophages. Accordingly, we speculate that the CD86-positive macrophages may switch towards a pro-tumour M2 phenotype and induce tumour growth.
In patients with liver tumours, liver regeneration may induce the growth of occult lesions. There is an urgent need for drugs that can inhibit tumour growth without compromising liver regeneration. Chloroquine, an autophagy inhibitor, has been used to inhibit tumour growth; however, because it compromises liver regeneration, it cannot be used for hepatectomy, split-liver transplantation, or living-donor liver transplantation in patients with tumours [Citation31]. Accruing studies have shown that CA displays anticancer activity in various types of in vitro and in vivo tumours [Citation16,Citation17]. Our results indicate that, at a dosage of 20 mg/kg every other day for 12 days, the administration of CA may have suppressed tumour-cell proliferation and tumour growth without compromising ALPPS-induced liver regeneration. In addition, although the surgical ALPPS procedure appeared to have caused an inflammatory response in the lungs, kidneys, and liver (and even affected liver function), the administration of CA did not aggravate organ damage after ALPPS. Therefore, CA is an ideal potential drug for inhibiting the growth of occult lesions during ALPPS-induced liver regeneration. A drug typically used for treating obesity and type 2 diabetes, CA has shown excellent effects against diabetes in animal experiments and clinical trials [Citation32]. Its anticancer activity in several types of tumours has recently attracted increasing attention from scholars. A growing number of studies have shown that CA suppresses tumour growth by modulating many cellular signalling pathways, including the STAT-3, NF-κB, and Wnt/β-catenin pathways.
Recently, Sydrey et al. [Citation33] showed that PD-1 expression by TAMs inhibited phagocytosis and tumour immunity and that all PD-1+ TAMs expressed an M2-like surface profile, while PD-1– TAM tended towards the expression of an M1-like profile. Our data showed that the number of CD206+ M2 macrophages increased significantly and accounted for a vast majority of the macrophages in the tumours induced by ALPPS; however, the number of macrophages decreased significantly, while the number of CD86+ macrophages increased markedly after CA administration. That is, the administration of CA induced a significant shift of CD206+ M2 macrophages towards CD86+ M1 macrophages in tumour tissue.
To further investigate the effect of CA on the expression of PD-1 in the tumour microenvironment, we assessed the expression of PD-1 by IHC. Our results showed that the expression level of PD-1 was associated with the growth of tumours and that the administration of CA downregulated the expression level of PD-1, which was associated with the M1 polarisation of M2 macrophages. Tumour-associated macrophages are macrophages that infiltrate cancer tissue and are closely involved in the development of the tumour’s microenvironment [Citation34]. A significant proportion of TAMs is M2 macrophages, which are associated with cell proliferation, angiogenesis, metastasis, and invasion [Citation35]. It is well known that TAMs play an important role in cancer growth [Citation36]. Tumour-associated macrophages release many proangiogenic cytokines and growth factors, such as VEGF, which promotes tumour progression, and TGF-β, which inhibits the antitumor function of T cells and natural killer cells. Our results indicated that the expression of TGF-β and CD31 in tumours was significantly decreased when tumour growth was delayed by the administration of CA. Notably, there was no difference in serum TGF-ß or VEGF among the 3 groups, which indicated that the serum levels of TGF-β and VEGF were not affected by tumour growth. We found that CA suppressed the expression of CD31 and TGF-β in tumours, an outcome related to a reduced number of M2 macrophages. Recently, Mariathasan et al. [Citation37] indicated that TGF-β shaped the tumour’s microenvironment to restrain antitumor immunity by restricting T cell infiltration, results that are similar to ours. We found that the number of CD8+ lymphocytes was significantly higher in the CA-administered group than in the untreated group, and this effect was associated with the suppression of TGF-β expression by the administration of CA. Therefore, our data suggest that the mechanism by which CA impedes tumour growth may be through downregulation of the expression of PD-1 and/or the upregulation of the cytotoxic activity of CD8+ in tumours.
In summary, we showed that CA inhibited tumour growth without compromising ALPPS-induced liver regeneration in a rat model and that this effect may have resulted from the CA-induced regulation of PD-1 and TGF-β expression, as well as an increased CD8+ lymphocyte infiltration in tumour tissue associated with the suppression of M2 macrophage polarisation.
Ethics statement
All animal experiments were carried out according to the experimental practices and standards approved by the Animal Welfare and Research Ethics Committee at Jilin University (No: IZ-2009-008). The experiments protocols were reviewed and approved by the committee. All animals received humane care in compliance with the Guide for the Care and Use of Laboratory Animals published by the US National Institutes of Health (NIH Publication No. 85-23, revised 1996).
Author contributions
JZ and HX conceived and carried out the experiments; JZ and WZ wrote the manuscript; WL made the revision; XW provide the part of experiments design; WZ and YF made the data collection; FM and HX made the data analysis; JW and WZ perform the figure making; WL and XW performed the cell cultivation; JW and LY designed study and guide the experiments.
Disclosure statement
All of the authors had no any personal, financial, commercial, or academic conflicts of interest separately.
Data availability statement
The data that support the findings of this study are available from the corresponding author, upon reasonable request.
Additional information
Funding
References
- Schnitzbauer AA, Lang SA, Goessmann H, et al. Right portal vein ligation combined with in situ splitting induces rapid left lateral liver lobe hypertrophy enabling 2-staged extended right hepatic resection in small-for-size settings. Annals Surg. 2012;255(3):405–414.
- Croome KP, Hernandez-Alejandro R, Parker M, et al. Is the liver kinetic growth rate in ALPPS unprecedented when compared with PVE and living donor liver transplant? A multicentre analysis. HPB. 2015;17(6):477–484.
- Kambakamba P, Linecker M, Schneider M, et al. Impact of associating liver partition and portal vein ligation for staged hepatectomy (ALPPS) on growth of colorectal liver metastases. Surgery. 2018;163(2):311–317.
- Belghiti J, Dokmak S, Schadde E. ALPPS: innovation for innovation's sake. Surgery. 2016;159(5):1287–1288.
- Wigmore SJ. ALPPS: the argument against. Eur J Surg Oncol. 2017;43(2):249–251.
- Linecker M, Bjornsson B, Stavrou GA, et al. Risk adjustment in ALPPS is associated with a dramatic decrease in early mortality and morbidity. Annals Surg. 2017;266(5):779–786.
- Linecker M, Stavrou GA, Oldhafer KJ, et al. The ALPPS risk score: avoiding futile use of ALPPS. Ann Surg. 2016;264(5):763–771.
- Moris D, Ronnekleiv-Kelly S, Kostakis ID, et al. Operative results and oncologic outcomes of associating liver partition and portal vein ligation for staged hepatectomy (ALPPS) versus Two-Stage Hepatectomy (TSH) in patients with unresectable colorectal liver metastases: a systematic review and meta-analysis. World J Surg. 2018;42(3):806–815.
- Oldhafer KJ, Donati M, Jenner RM, et al. ALPPS for patients with colorectal liver metastases: effective liver hypertrophy, but early tumor recurrence. World J Surg. 2014;38(6):1504–1509.
- Wanis KN, Ardiles V, Alvarez FA, et al. Intermediate-term survival and quality of life outcomes in patients with advanced colorectal liver metastases undergoing associating liver partition and portal vein ligation for staged hepatectomy. Surgery. 2018;163(4):691–697.
- Adam R, Imai K, Castro Benitez C, et al. Outcome after associating liver partition and portal vein ligation for staged hepatectomy and conventional two-stage hepatectomy for colorectal liver metastases. Br J Surg. 2016;103(11):1521–1529.
- Kikuchi Y, Hiroshima Y, Matsuo K, et al. Impact of associating liver partition and portal vein occlusion for staged hepatectomy on tumor growth in a mouse model of liver metastasis. Eur J Surg Oncol. 2018;44(1):130–138.
- García-Pérez R, Ferrer Fábrega J, Varona-Bosque A, et al. Role of kupffer cells in the progression of CRC liver metastases after the first stage of ALPPS. Sci Rep. 2018;8(1):8089.
- Hou W, Li Y, Zhang Q, et al. Triterpene acids isolated from lagerstroemia speciosa leaves as alpha-glucosidase inhibitors. Phytother Res. 2009;23(5):614–618.
- Liby KT, Yore MM, Sporn MB. Triterpenoids and rexinoids as multifunctional agents for the prevention and treatment of cancer. Nat Rev Cancer. 2007;7(5):357–369.
- Nho KJ, Chun JM, Kim HK. Corosolic acid induces apoptotic cell death in human lung adenocarcinoma A549 cells in vitro. Food Chem Toxicol. 2013;56:8–17.
- Fujiwara Y, Komohara Y, Ikeda T, et al. Corosolic acid inhibits glioblastoma cell proliferation by suppressing the activation of signal transducer and activator of transcription-3 and nuclear factor-kappa B in tumor cells and tumor-associated macrophages. Cancer Sci. 2011;102(1):206–211.
- Vicentino C, Constantin J, Bracht A, et al. Long-chain fatty acid uptake and oxidation in the perfused liver of walker-256 tumour-bearing rats. Liver. 2002;22(4):341–349.
- Wei W, Zhang T, Zafarnia S, et al. Establishment of a rat model: associating liver partition with portal vein ligation for staged hepatectomy. Surgery. 2016;159(5):1299–1307.
- Li X, Zheng C-S, Feng G-S, et al. An implantable rat liver tumor model for experimental transarterial chemoembolization therapy and its imaging features. World J Gastroenterol. 2002;8(6):1035–1039.
- Zhang R, Liang Y, Wei S. M2 macrophages are closely associated with accelerated clavicle fracture healing in patients with traumatic brain injury: a retrospective cohort study. J Orthop Surg Res. 2018;13(1):213.
- Moris D, Vernadakis S, Papalampros A, et al. Mechanistic insights of rapid liver regeneration after associating liver partition and portal vein ligation for stage hepatectomy. World J Gastroenterol. 2016;22(33):7613–7624.
- Xu CS, Jiang Y, Zhang LX, et al. The role of kupffer cells in rat liver regeneration revealed by cell-specific microarray analysis. J Cell Biochem. 2012;113(1):229–237.
- Sica A, Invernizzi P, Mantovani A. Macrophage plasticity and polarization in liver homeostasis and pathology. Hepatology. 2014;59(5):2034–2042.
- Tai KF, Wang CH. Using adenovirus armed short hairpin RNA targeting transforming growth factor β1 inhibits melanoma growth and metastasis in an ex vivo animal model. Ann Plast Surg. 2013;71 Suppl 1:S75–S81.
- Garcia-Perez R, Revilla-Nuin B, Martinez CM, et al. Associated liver partition and portal vein ligation (ALPPS) vs selective portal vein ligation (PVL) for staged hepatectomy in a rat model. Similar regenerative response? PLOS One. 2015;10(12):e0144096.
- Zhao J, Xu H, Li Y, et al. NAFLD induction delays postoperative liver regeneration of ALPPS in rats. Dig Dis Sci. 2019;64(2):456–468.
- Tacke F. Targeting hepatic macrophages to treat liver diseases. J Hepatol. 2017;66(6):1300–1312.
- Wang J, Kubes P. A reservoir of mature cavity macrophages that can rapidly invade visceral organs to affect tissue repair. Cell. 2016;165(3):668–678.
- Delire B, Henriet P, Lemoine P, et al. Chronic liver injury promotes hepatocarcinoma cell seeding and growth, associated with infiltration by macrophages. Cancer Sci. 2018;109(7):2141–2152.
- Lin CW, Chen YS, Lin CC, et al. Amiodarone as an autophagy promoter reduces liver injury and enhances liver regeneration and survival in mice after partial hepatectomy. Sci Rep. 2015;5:15807.
- Sharma H, Kumar P, Deshmukh RR, et al. Pentacyclic triterpenes: new tools to fight metabolic syndrome. Phytomedicine. 2018;50:166–177.
- Gordon SR, Maute RL, Dulken BW, et al. PD-1 expression by tumour-associated macrophages inhibits phagocytosis and tumour immunity. Nature. 2017;545(7655):495–499.
- Lewis CE, Pollard JW. Distinct role of macrophages in different tumor microenvironments. Cancer Res. 2006;66(2):605–612.
- Liu Y, Cao X. The origin and function of tumor-associated macrophages. Cell Mol Immunol. 2015;12(1):1–4.
- Noy R, Pollard JW. Tumor-associated macrophages: from mechanisms to therapy. Immunity. 2014;41(1):49–61.
- Mariathasan S, Turley SJ, Nickles D, et al. TGFβ attenuates tumour response to PD-L1 blockade by contributing to exclusion of T cells. Nature. 2018;554(7693):544–548.