
 ?Mathematical formulae have been encoded as MathML and are displayed in this HTML version using MathJax in order to improve their display. Uncheck the box to turn MathJax off. This feature requires Javascript. Click on a formula to zoom.
Abstract
Purpose: Oncology studies employing digital dissection methodologies have provided some insight on the biological features of tumor microenvironment of Triple-negative breast cancer (TNBC), but molecular diagnostics rarely have therapeutic impact. We aimed to identify a novel prognostic biomarker to investigate immune characteristics of TNBC using transcriptomic features.
Patients and Methods: We extracted whole transcriptome from breast cancer tissue of 30 TNBC patients and then used bioinformatics approaches to characterize the different immune cell contents in tumor tissue and para-cancerous tissue. We extract 2 indicators to describe the major differences in immune infiltration in the microenvironment between tumor tissue and para-cancerous tissue. We then combined the 2 indicators that represent the levels of increased and decreased infiltration in each sample to obtain the Immune Infiltration Score (IIS). Then we compared the tumor-infiltrating immune cell contents and immune infiltrating status in TNBC samples with CIBERSORT and ESTIMATE score to validate the IIS. Finally, 132 TNBC patients from the Cancer Genome Atlas program (TCGA) dataset was used to validate the predictive power of IIS.
Results: 4 types of upregulated and 4 types of downregulated immune cells were identified in the tumor tissue samples of the TNBC patients. Then we developed a novel biomarker, IIS. Results showed that IIS score can clearly separate cancer and para-cancerous tissue. Using the same cutoff value of 0 in the TNBC-TCGA cohort, we show that those patients with a higher IIS had significantly higher PD-L1 expression and shorter progression-free survival time than those with a lower IIS value, indicating IIS score can be generalized to other TNBC datasets.
Conclusion: we explored the immune infiltration landscape in 30 TNBC patients and provided IIS as a novel and reliable biomarker to evaluate the progression-free survival and prognosis of the TNBC patients.
Introduction
Breast cancer is the most commonly diagnosed female cancer and comprises 23% of all cancer cases in women [Citation1]. Changes in breast tissue composition are mediated by receptors expressed on the surface of breast cancer cells that bind chemical messengers such as hormones and impact cell fate. Hence, breast cancer types are categorised into the following groups on the basis of their receptor status: (a) oestrogen receptor (ER) or progesterone receptor (PR) positive; (b) human epidermal growth factor receptor 2 positive (amplification of cerbB2) with or without ER and PR positive; and (c) triple-negative breast cancer (TNBC) defined by the absence of ER/PR expression and human epidermal growth factor receptor 2 amplification [Citation2]. TNBC mostly occurs in premenopausal young women under 40 years old and comprises of 15–20% of all breast cancer cases [Citation3]. Compared with other breast cancer sub-types, TNBC survival time is shorter, and there is a higher mortality rate [Citation3]. Due to its molecular profile, TNBC is not sensitive to endocrine or molecular targeted therapy. Consequently, surgery and chemotherapy are the main choices for systemic treatment. After the operation, the efficiency of postoperative chemo-radiotherapy is poor, and tumour recurrence is frequent [Citation4]. Therefore, accurate identification of individuals with TNBC who are most likely to respond to therapy is an unmet clinical need.
Increasing evidence indicates that tumorigenesis is tightly associated with the immunological surveillance and defense during the disease course, and these functions play a key role in mediating response to therapy [Citation5]. The tumour immune microenvironment (TIME) in TNBC is a highly complicated, heterogeneous construct consisting of diverse cell types and disordered gene expression. Importantly, the rapid expansion of tumour tissue induces hypoxia and necrosis, reprogramming the TIME gene expression landscape to radically affect immune cell survival, recognition, and anti-tumour function. In comparison to other breast cancers, the TIME in TNBC is associated with higher expression of vascular endothelial growth factors and other molecules promoting growth and migration of tumour cells, as well as tumour-infiltrating lymphocytes and tumour-associated macrophages [Citation6,Citation7]. It has been shown that the presence of tumour-infiltrating lymphocytes is correlated with a better prognosis and an improved response to neoadjuvant chemotherapy in TNBC [Citation8–10]. Furthermore, the interaction between death receptor 1 on T cells and programmed cell death ligand 1 on tumour cells, suppresses the immune system, resulting in tumour cell immune escape [Citation11]. As such, gaining a better understanding of the pathological impact and dynamics of different TNBC immune cells is essential for developing an effective TIME-related prognostic biomarker.
The aim of this study was to investigate immune characteristics in TNBC to identify novel prognostic biomarkers. To do this, RNA sequencing was performed in 30 TNBC patients, and bioinformatics approaches were used to differentiate the immune cell component in tumour tissue versus para-cancerous tissue. Machine learning were then used to develop a novel biomarker, termed the ‘immune infiltration score’ (IIS), which indexes the degree/presence of immune cell infiltration in the tumour microenvironment. In contrast to other available biomarkers that lack information on cellular proportions, IIS is based on the TIME immune cell component. Accordingly, IIS provides valuable information on a patient’s individual TIME composition relevant for personalised diagnosis, treatment, and prognosis.
Methods
Sample acquisition
30 pairs of cancerous tissue and matched para-cancerous samples from breast cancer patients who had not received chemotherapy or radiotherapy before samples collection were collected from the Maternity & Child Healthcare Hospital of Longhua District, (Shenzhen, China). The diagnosis of TNBC defined by the absence of ER/PR expression and human epidermal growth factor receptor 2 amplification was affirmed by two pathologists independently. The studies involving human participants were reviewed and approved by the Medical Ethics committee of Maternity & Child Health Care Hospital of Longhua District (NO.2019071201). All participating patients signed written informed consent and received standard-of-care treatment with surgical excision of lesions. All samples were snap-frozen using liquid nitrogen and stored at −80 °C until further processing.
RNA extraction and cDNA reverse transcription
RNA sequencing was performed by Guangzhou Huayin Health Medical Group (Guangzhou, China). Total RNA was extracted according to the instructions of the TRIZOL kit (Invitrogen, Carlsbad, California, USA). Qualified RNA was synthesised by reverse transcription using SMARTScribe™ reverse transcriptase (Clontech, Mountain View, California, USA) to prepare 5’RACE cDNA for high-throughput sequencing. CDNA was purified using the MinElute PCR Purification Kit (Qiagen, Germany).
Data processing and analysis
The original data obtained from high-throughput sequencing were converted to raw sequence reads by base calling, and the results were stored in FASTQ format. Low quality reads and reads without primers were discarded. PCR and sequencing errors were corrected by using unique molecular identifiers. Only duplicate reads with different unique molecular identifiers were retained in downstream processing. Original reads of RNA sequencing data were converted to normalised FPKM values. RNA-seq data have been deposited in the Annotate repository under accession numbers E-MTAB-10886.
Immune cell quantification
Cells in TNBC and surrounding cancerous tissue samples were divided into 5 categories, epithelial cells, haematopoietic stem cells, hyaloid cells, lymphoid cells, and stromal cells (Supplementary Figure S1A–E). Epithelial cells and progenitor cells were excluded from the analysis, as they are not considered relevant to the tumour immune microenvironment. Next, the xCell method was used to quantitatively analyse cellular component differences between cancer and para-cancerous tissues [Citation12]. xCell has the advantage/benefit to reconstruct the cellular composition by deconvolution of gene enrichment analysis profiles, and it can evaluate up to 64 cell types in a tumour environment. In addition, CIBERSORT and ESTIMATE are used to evaluate tumour-infiltrating immune cell contents and immune infiltrating status in TNBC samples to validate xCell results. We use an unsupervised clustering and visualisation method, Uniform Manifold Approximation and Projection (UMAP) algorithm in R to achieve multi-feature dimensionality reduction, and to visualise sample grouping, based on the significantly different immune cell components obtained. Z-score normalisation is used to normalise obtained cell content from the 30 tissue-normal pairs, where the mean and standard deviation is calculated by xCell score for the BRCA data set in the Cancer Genome Atlas program (TCGA).
To obtain the IIS score, we combined the 2 indicators that represented the levels of increased or decreased infiltration in each sample. In the linear combination, we define X1 and X2 to be the sum of normalised cells contents in the up-regulated and down-regulated groups, respectively. And we define a dependent variable Y to be a binary indicator that represents either cancer tissue or the para-cancerous tissue.
where X1 represents the sum of cell content in the up-regulated group after normalisation, and X2 represents the sum of cell content in the down-regulated group after normalisation. Variables a and b are the linear factors related to X1 and X2, c represents the intercept. We used Support Vector Machine to find the best fit of the two indicators:
Using the same methodology, we compared the best fit generated from logistic regression to the best fit derived from the Support Vector Machine, the decision boundary found by two algorithms generated very similar IIS results in TNBC-TCGA samples (cor = 0.99) (Supplementary Figure S3B). In addition, TNBC samples with IIS scores lower than 0 had significantly lower ESTIMATE scores (p < .01), another widely used algorithm to infer tumour infiltrating immune cells (Supplementary Figure S3A). The IIS score and corresponding X1 and X2 in our cohort are listed in Supplementary Table 3.
Statistical analysis
T-test was used to compare matched samples to find significantly altered cell content in each cell type. The Wilcoxon rank-sum test and Chi-Square test were used in comparing patient survival between TCGA IIS-positive and IIS-negative groups. Two-sided p-values < .05 were considered statistically significant.
Results
Clinicopathological characteristics
There were 30 adult patients were enrolled in this study, with 13 in grade II and 17 in grade III. Among all the patients, the age of the patients in grade II is older than those in grade III, but they were not significantly different. And the differences in tumour size, metastasis and p anthological type were not significant. The details of the clinical-pathological characteristics were listed in and Citation2.
Table 1. Details of the clinic pathological information of TNBC patient population.
Altered of immune cell infiltration in cancer tissue
We observed significant differences in the infiltration of macrophages, DC cells, granulocytes and other innate immune cells between cancer and para-cancerous tissue (). In TNBC, four types of immune cells were up-regulated in the TIME, including CD8 positive T cells and TH1 cells, activated dendritic cells (aDC), and macrophages (). The four down-regulated cell types were: Conventional dendritic cells (cDC), neutrophils, CD4 positive T cells and master cells (). It is worth noting that aDC showed a significant increase in the tumour tissue, in contrast to the significant decrease of cDC in tumour tissue, indicating that DC cells in the tumour microenvironment undergo a massive activation process. To validate our findings with xCell, we then used CIBERSORT to evaluate the proportion of immune cell types in the same dataset. The results in CIBERSORT showed high concordance with that in xCell (). CD8 positive T cells, Macrophages and Mast cells are significantly changed in both xCell and CIBERSORT. Although the difference between cDC and neutrophils components is not significant, it has the same trend as xCell results (, ).
Figure 1. (A) Immune cells with a significant difference in cell composition between TNBC microenvironment and para-cancerous tissue. Left: Innate immune cells, Right: Adaptive immune cells. Levels of significance are represented as ns (not significant) or asterisks, p ≤ .05, p ≤ .01, p ≤ .001 and p ≤ .0001 are represented as with *, **, *** and ****respectively. aDC, activated dendritic cell; cDC, conventional dendritic cell; Tcm, central memory T cell; Tem, effector memory T cell; TH, T helper cell, CA: cancerous tissue, CAP: para-cancerous tissue. (B) Stacked bar chart of total cell content in innate immune cells (Left), adaptive immune cells (middle) and stromal cells (right). Tem, pDC, Plasmacytoid dendritic cell; lDC, lymphoid dendritic cell; NKT, Natural killer T cell; Tregs, Regulatory T cell; MSC, mesenchymal stem cell, CA: cancerous tissue, CAP: para-cancerous tissue.
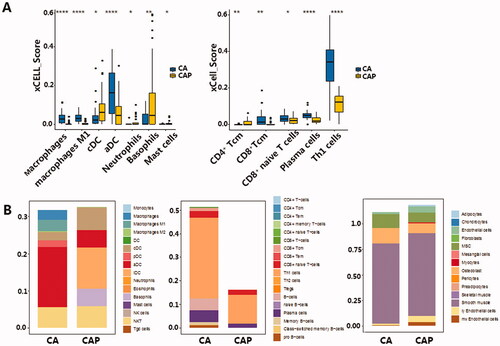
Figure 2. (A) Validation of cell components derived from CIBERSORT software. Macrophages, mast cells resting, and mast cells activated showed the same trend of insignificance. Although the difference in neutrophils component is not significant, it has the same trend as Xcell results. (B) UMAP clustering for 30 TNBC cancer tissues and 30 para-cancerous tissues. X axis and y axis represent UMAP components derived from immune profiles consisting of normalised immune-related cell counts in 10 types of cells, including 4 significantly up-regulated and 4 down-regulated cell components in the immune microenvironment. Levels of significance are represented as ns (not significant) or asterisks, p ≤ .05, p ≤ .01, p ≤ .001 and p ≤ .0001 are represented as with *, **, *** and ****respectively. (C) The immune infiltration score derived from the sum of normalised cells contents showed obvious differences in TNBC samples and para-cancerous samples. X axis represents TNBC and para-cancerous tissue, y axis represents the IIS score. CA: cancerous tissue, CAP: para-cancerous tissue.
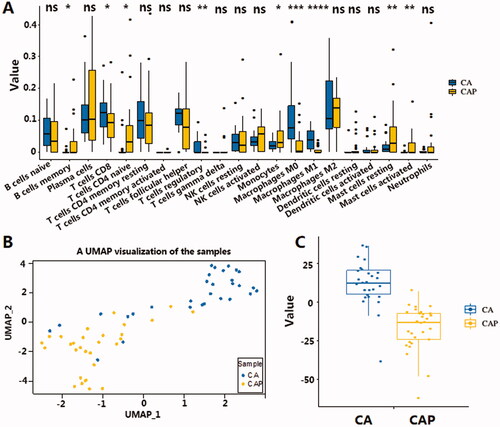
Table 2. Clinicopathological baseline data.
Table 3. Quantitating immune cell component in xCell and Cibersort.
While activation of both innate and adaptive immune cells was observed, the overall adaptive immune cell significantly increased in tumour tissue compared to the para-cancerous tissues. This increased immune infiltration in the TNBC tissue mostly comprised of elevated TH1 and B (). We postulate a slight decrease in the total stromal cell was also observed in TNBC samples, which may be due to this elevated immune cell component. However, we note that stromal cell levels stayed relatively stable between the two tissue types (). We also validated the observed activation in both innate and adaptive immune cells using the TCGA BRCA cohort. However, the TCGA BRCA cohort only showed activation in adaptive immune cells, represented by CD8+ Naive T-cells, Plasma cells and Th1 cells, no significance in the innate immune cells was observed (Figure S2A, S2B).
The immune infiltration score
There are marked differences between tumour tissue and para-cancerous tissue. Accordingly, the study of the differential infiltration of immune cells in tumour tissue will help researchers better understand the mechanism of tumour immune surveillance. To describe the immune infiltration levels based on the changes in TNBC, the cell type content of significantly differentiated cells was extracted and used to represent the immune profile of tumour and para-cancerous tissue. Since the number of cells from each cell type can vary greatly between samples, and may likely bias the variance analysis, Z-score standardisation was used to ensure comparability of cell content. After that, standardised cell content from the corresponding cells was summed up to obtain 2 indicators that represented the level of increased or decreased infiltration in each sample. UMAP is used to cluster the immune profile in each sample. shows the separation of cancer tissue samples compared to the para-cancerous tissue samples using UMAP. The clear separation of these two groups indicates how varying levels of immune cell infiltration can have a profound impact on shaping the TNBC immune microenvironment.
The two indicators that represented the level of increased or decreased infiltration provide an insight into varying TIME in TNBC, we next tried to determine which linear combination of the two indicators best separated TNBC from the para-cancerous samples (Detailed training processes are described in the method section). This combination of increased and decreased infiltration in the formula Y = aX1-bX2 + c showed a clear separation of TNBC samples and para-cancerous samples, indicating a distinct immune infiltration state in TNBC (). Thus, we termed this linear combination of the increased and decreased infiltration the Immune Infiltration Score (IIS). In addition, the IIS score also showed the ability to separate cancer and para-cancerous tissue in the TNBC-TCGA cohort with the same cut-off value of 0 (), indicating the IIS score can be generalised to other TNBC datasets. The correlation of IIS with TNBC survival and PD-L1 RNA expression in TNBC.
Figure 3. (A) Comparing IIS score in tumour and para-cancerous samples in BRCA dataset from TCGA. X-axis represents sample classification; Y-axis represents the calculated IIS score. CA: cancerous tissue, CAP: para-cancerous tissue. (B) The relationship between IIS status and PD-L1 expression in the TNBC cohort from BRCA-TCGA. X-axis represents IIS status in each sample; Y-axis represents the corresponding normalised PD-L1 RNA expression value. CA: cancerous tissue, CAP: para-cancerous tissue. (C) Kaplan Meier progression-free survival curve for 132 TNBC patients from TCGA, samples with higher IIS have a significantly shorter progression-free survival (p = .043).
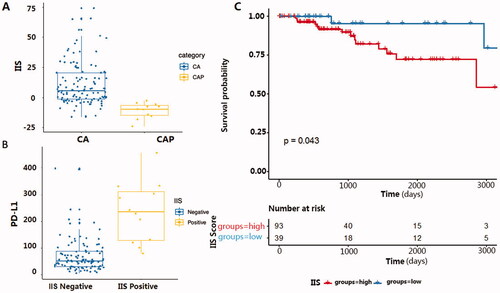
To test if IIS had predictive power for clinical benefit in TNBC patients, we analysed the relationship of IIS score with both PD-L1 expression and the progression-free survival time with the TNBC cohort consisting of 132 identified TNBC patients from TCGA [Citation13,Citation14]. Results showed that patients with a higher IIS had significantly higher PD-L1 RNA expression () and shorter progression-free survival time () than those with a lower IIS value.
Discussion
In recent years, multiple studies [Citation15–17] have published methodologies for the digital dissection of tumour gene expression profiles that provide novel insight into the efficacy of breast cancer therapeutics. However, very few of these methods have been fully validated for the tumour microenvironment. Especially in TNBC, the extensive molecular heterogeneity in the tumour immune microenvironment increased the difficulty of comprehensively analyse the tumour immune microenvironment and resulted in a big stumbling block in the treatment of TNBC. In order to evaluate the immune microenvironment in TNBC, this study was first proposed to use the immune infiltration score based on the difference in cell type content between tumour tissue and the para-cancerous tissue. Furthermore, this immune infiltration score was negatively correlated with prognosis and PDL1 expression. Thus, our findings enhance the understanding of the tumour immune microenvironment in TNBC and may provide more information for the treatment of TNBC patients. All these results indicate, that IIS as an effective tool to evaluate the immune microenvironment among TNBC patients can also be used to guide the treatment of TNBC patients.
In recent years, an increasing number of studies have demonstrated that properties of the immune microenvironment are associated with the development and progression of TNBC[Citation10]. Compared with other subtypes of BC, TNBC has a unique immune microenvironment consisting of diverse cell types and disordered gene expression. In this study, we found 4 types of immune cells were up-regulated and 4 types of immune cells were down-regulated compared to the para-cancerous tissue. This is in line with the results that tumour-associated immunological infiltrates, including dendritic cells, T cells, B cells, natural killer cells, and macrophages were important parameters of classical tumour pathology in TNBC [Citation18,Citation19].
We used the novel gene signature-based cell composition analysis method, xCell [Citation12], to quantitatively analyse cell type components of tumour and para-cancerous tissue samples because xCell can investigate more immune cell types compared with Cibersort, another widely used software in cancer microenvironment research. The results analysed with Cibersort showed high concordance with that in xCell. CD8 positive T cells (), Macrophages and Mast cells are significantly changed in both xCell and Cibersort. Although the difference between cDC and neutrophils components is not significant, it has the same trend as xCell results. The results difference may be caused by the different strategies used in xCell and Cibersort. The algorithm used in xCell is based on feature gene expression, while Cibersort is on deconvolution. Considering the better performance of xCell than Cibersort using signatures, we chose xCell to quantitatively analyse cell type components of tumour and para-cancerous tissue samples and successfully developed IIS to evaluate the immune microenvironment in TNBC patients. IIS, as a binary indicator, with different values showed the different tumour immune microenvironments among TNBC patients, which may decide varied prognosis and treatment of the TNBC patients.
It is interesting to note that, when we tried to validate the predictive power of IIS in the TCGA dataset of breast cancer patients, we found higher IIS indicates poor survival probability, indicating that our IIS is well correlated with the prognosis of TNBC patients. Intriguingly, further exploration found that IIS is correlated with the PDL1 expression, which is an immune checkpoint molecule and an important target in immunotherapy in TNBC patients[Citation20]. Therefore, IIS can guide the treatment through the variation tendency of the IIS for TNBC patients. The IIS can even throw light on the exploration of the mechanism of the immunotherapy effect differences among TNBC patients, which need further validation in the future.
Limits
Due to the relative rarity of TNBC, the sample size of our cohort is limited. Although we do have validations in the TCGA cohort, the candidates in our cohort are all alive, the important prognosis value cannot be validated with our own data. Thus, further clinical studies are needed.
Conclusion
In summary, we explored the immune infiltration landscape in 30 TNBC patients and compared the infiltration levels of various cell types between cancer and para-cancerous tissues. By comparing the infiltration levels of innate immune cells, adaptive immune cells, and stromal cells, we constructed an Immune Infiltration Score (IIS) from the linear combination of increased and decreased infiltrated cells in the TNBC microenvironment.
IIS is the first attempt to quantify immune activity in TNBC with our own data and further generalised to the TCGA cohort. The results those patients in the TCGA cohort with a higher IIS had significantly higher PD-L1 RNA expression and shorter progression-free survival time than those with a lower IIS value indicate IIS might be a more robust and effective tool to evaluate the immune microenvironment specifically in TNBC patients and can be used to predict the prognosis and guide the treatment. The IIS can even throw light on the exploration of the mechanism of the immunotherapy effect differences among different patients, which needs to expand the sample size and further clinical validation in the future.
Author contributions
ZY contributed to the conception and design of the study. WX, CH collected the samples and organised the database. YW, WC and WG performed the statistical analysis. WY, ZQ, LT and FW finished the transcriptome analysis of the samples. ZY, XY, LT, YW and HS wrote the first draft of the manuscript. WQ, TH wrote sections of the manuscript. All authors contributed to manuscript revision, read, and approved the submitted version.
Supplemental Material
Download PDF (284.3 KB)Disclosure statement
The authors declare that the research was conducted in the absence of any commercial or financial relationships that could be construed as a potential conflict of interest.
Data availability statement
The datasets used and/or analysed during the current study are available from the first author and corresponding author on reasonable request.
Correction Statement
This article has been republished with minor changes. These changes do not impact the academic content of the article.
Additional information
Funding
References
- Boyle P. The globalisation of cancer. Lancet. 2006;368(9536):1212–630.
- Sporikova Z, Koudelakova V, Trojanec R, et al. Genetic markers in triple-negative breast cancer. Clin Breast Cancer. 2018;18(5):e841–e850.
- Morris GJ, Naidu S, Topham AK, et al. Differences in breast carcinoma characteristics in newly diagnosed African-American and Caucasian patients: a single-institution compilation compared with the national cancer institute’s surveillance, epidemiology, and end results database. Cancer. 2007;110(4):876–884.
- Chaudhary LN, Wilkinson KH, Kong A. Triple-negative breast cancer: who should receive neoadjuvant chemotherapy? Surg Oncol Clin N Am. 2018;27(1):141–153.
- Binnewies M, Roberts EW, Kersten K, et al. Understanding the Tumor Immune Microenvironment (TIME) for effective therapy. Nat Med. 2018;24(5):541–550.
- Niu M, Valdes S, Naguib YW, et al. Tumor-associated macrophage-mediated targeted therapy of triple-negative breast cancer. Mol Pharm. 2016;13(6):1833–1842.
- Mirando AC, Patil A, Rafie CI, et al. Regulation of the tumor immune microenvironment and vascular normalization in TNBC murine models by a novel peptide. Oncoimmunology. 2020;9(1):1760685.
- Salgado R, Denkert C, Demaria S, et al. The evaluation of tumor-infiltrating lymphocytes (TILs) in breast cancer: recommendations by an international TILs working group 2014. Ann Oncol. 2015;26(2):259–271.
- Ali HR, Provenzano E, Dawson S-J, et al. Association between CD8+ T-cell infiltration and breast cancer survival in 12,439 patients. Ann Oncol. 2014;25(8):1536–1543.
- Gruosso T, Gigoux M, Manem VSK, et al. Spatially distinct tumor immune microenvironments stratify triple-negative breast cancers. J Clin Invest. 2019;129(4):1785–1800.
- Chamoto K, Al-Habsi M, Honjo T. Role of PD-1 in immunity and diseases. Curr Top Microbiol Immunol. 2017;410:75–97.
- Aran D, Hu Z, Butte AJ. xCell: digitally portraying the tissue cellular heterogeneity landscape. Genome Biol. 2017;18(1):220–233.
- Yau C, Esserman L, Moore DH, et al. A multigene predictor of metastatic outcome in early stage hormone receptor-negative and triple-negative breast cancer. Breast Cancer Res. 2010;12(5):R85.
- Liu J, Lichtenberg T, Hoadley KA, et al. An integrated TCGA Pan-Cancer clinical data resource to drive high-quality survival outcome analytics. Cell. 2018;173(2):400–416.
- Gentles AJ, Newman AM, Liu CL, et al. The prognostic landscape of genes and infiltrating immune cells across human cancers. Nat Med. 2015;21(8):938–945.
- Rooney MS, Shukla SA, Wu CJ, et al. Molecular and genetic properties of tumors associated with local immune cytolytic activity. Cell. 2015;160(1-2):48–61.
- Li B, Severson E, Pignon J-C, et al. Comprehensive analyses of tumor immunity: implications for cancer immunotherapy. Genome Biol. 2016;17(1):174.
- Gooden MJM, de Bock GH, Leffers N, et al. The prognostic influence of tumour-infiltrating lymphocytes in cancer: a systematic review with meta-analysis. Br J Cancer. 2011;105(1):93–103.
- Law AMK, Lim E, Ormandy CJ, et al. The innate and adaptive infiltrating immune systems as targets for breast cancer immunotherapy. Endocr Relat Cancer. 2017;24(4):R123–44.
- Qin G, Wang X, Ye S, et al. NPM1 upregulates the transcription of PD-L1 and suppresses T cell activity in triple-negative breast cancer. Nat Commun. 2020;11(1):1669.