
Abstract
Background
Obstructive sleep apnea (OSA) and inflammation are closely related. This study aimed to evaluate the associations and causal effect between C-reactive protein (CRP) and tumour necrosis factor-alpha (TNF-α) levels and OSA.
Methods
Pooled analysis was conducted to compare the expression differences of CRP and TNF-α between OSA patients with different severity and controls, and between continuous positive airway pressure (CPAP) and non-CPAP interventions for OSA patients. Using published GWAS summary statistics, we conducted a bidirectional two-sample Mendelian Randomization (MR) to estimate the causal relationships between CRP and TNF-α levels and OSA risk. Effect estimates were evaluated using inverse-variance weighted (IVW) as primary method, and several other MR methods as sensitivity analysis.
Results
Both TNF-α (WMD [95%CI] = 5.86 [4.80–6.93] pg/ml, p < .00001) and CRP (WMD [95%CI] = 2.66 [2.15–3.17] mg/L, p < .00001), showed a significant increase in OSA patients compared with controls and this increasing trend was associated with OSA severity. Besides, compared to blank control (non-CPAP), CPAP treatment can reduce high TNF-α (WMD [95%CI]= −4.44 [−4.81, −4.07]pg/ml, p < .00001) and CRP (WMD [95%CI]= −0.91 [−1.65, −0.17] mg/l, p = .02) in OSA. Moreover, the primary MR analysis by IVW showed that OSA was the genetically predicted cause of elevated CRP (estimate: 0.095; 95% CI, [0.010–0.179]; p = .029) using six SNPs as the instrument variable, which were repeated by weighted median (estimate: 0.053; 95% CI, [0.007, 0.100]; p =.024) and MR RAPS (estimate: 0.109; 95% CI, [0.079, 0.140]; p = 1.98x10⁻¹²). Besides, the causal effect from elevated CRP on increased OSA risk was almost significant by IVW (OR:1.053; 95% CI, [1.000, 1.111]; p = .053). However, there were no causal associations between TNF-α and OSA from both directions.
Conclusions
Increased CRP and TNF-α were associated with OSA severity and sensible to CPAP treatment. Also, OSA had a suggestive causal effect on elevated CRP.
Introduction
Obstructive sleep apnea (OSA) is a widespread sleep disorder that affects about 10–25% of the global population [Citation1,Citation2]. It is characterized by recurrent episodes of constriction or collapse of the upper airway during sleep, which can lead to intermittent hypoxia (IH), sympathetic overactivity, sleep fragmentation and disarrangement to physiological homoeostasis [Citation3]. During these processes, systematic inflammation has been reported to play a critical role. Activated inflammation pathways and changed inflammation protein levels can either be a cause or consequence of OSA [Citation4]. Understanding the association and causality between key inflammation proteins and OSA is helpful in studying the mechanism and developing new treatments for OSA.
Common biomarkers serving as indicators of systemic inflammation include CRP and TNF-αCitation5. CRP and TNF-α have been widely studied in OSA and have shown to be elevated in OSA patients in several epidemiological studies [Citation6–8], while the results in some studies were inconsistent [Citation9–11]. Besides, the associations between OSA-severity and the levels of CRP and TNF-α are still unclear [Citation12–14]. But these studies were limited to a relatively small sample and the data need to be updated. Thus, a pooled analysis depending on the larger sample size is required to assess the associations between CRP and TNF-α levels and OSA. Also, the impact of continuous positive airway pressure (CPAP), an effective therapy for OSA [Citation15], on CRP and TNF-α levels is important for exploring the link between OSA and inflammation. If the hypothesis that OSA causes inflammation is indeed correct, it is theoretically possible that the alleviation of OSA may be accompanied by a decrease in inflammation proteins.
The majority of previous studies on OSA have only shown an inflammatory profile in patients with OSA; it is unclear whether the altered inflammatory profile occurs before or after the onset of OSA, or both. Mendelian Randomization (MR) is a reliable genetic epidemiology method that uses genetic variants as instrumental variable (IV) to assure whether causality exists between OSA and inflammation [Citation16]. Because the genetic variants are naturally randomized to offspring during conception, MR can avoid the influence of confounding and reverse causation which was the common limitation in observational studies [Citation17,Citation18]. Currently, no MR analysis has examined the causality between inflammation and OSA risk. Multiple genetic loci were identified for OSA, CRP and TNF-α in recently published genomewide association studies (GWAS), and the GWAS summary statistics for OSA (217,955 participants), CRP (341,805 individuals) and TNF-α (3454 individuals) are available [Citation19–21], making it possible to conduct a powerful MR analysis.
In this study, we first explored the association between the levels of CRP, TNF-α and OSA severity, and whether this aberration can be reduced by CPAP treatment. Then, we applied a bidirectional MR analysis to estimate the causal relationships between these two cytokines and OSA risk.
Materials and methods
Meta-analysis of associations between CRP and TNF-α levels and OSA
To compare the expression differences of TNF-α and CRP between OSA patients with different severity and controls, and between CPAP treatment and non-CPAP intervention for OSA patients, studies were identified from published literature. Detailed descriptions of searching strategy, inclusive and exclusive criteria and data extraction were presented in Supplementary Methods.
All data were analysed in the Review manager 5.3 (The Nordic Cochrane Centre, The Cochrane Collaboration, London, UK). The measurement units of CRP and TNF-α were standardised. For CRP, mg/dl was converted to mg/l, TNF-α was pg/ml. As for continuous outcomes, the weighted mean differences (WMD) and 95% confidence interval (CI) were used as measures of the effect between the two groups in this study. We calculate an I2 statistic to estimate heterogeneity. If I2 > 50%, the data were pooled by random effect model, otherwise by fixed effect model. We also performed a sensitivity analysis by removing article one by one to see its effect on the p value. Moreover, a funnel diagram was conducted to evaluate publication biasCitation22.
Mendelian Randomization (MR) analysis investing causal relationship
GWAS summary statistics sources
A two-sample MR model was used to evaluate the causal effect between OSA and protein levels of CRP and TNF-α respectively. The GWAS summary statistics for OSA were from a recent publication using FinnGen Study which contained 217,955 individuals with 16,761 OSA patients from European [Citation20]. In this GWAS, OSA was diagnosed based on the International Statistical Classification of Diseases (ICD) codes (ICD-10: G47.3, ICD-9: 3472 A). Besides, the participants of CRP GWAS summary statistics were from the UK Biobank, including 341,805 individuals from European [Citation19]. The UK Biobank is a prospective cohort that recruited over half a million men and women aged 40–96 between 2006 and 2010 and tracked their health over time [Citation23]. TNF-α GWAS summary statistics were identified from a GWAS using YFS and FINRISK2002 including 3454 individuals from Finland [Citation21]. And the whole TNF-α was assessed by ELISA [Citation21].
Instrumental variable selection
There are three assumptions for instrumental variable (IV) selection in two-sample MR analysis: (1) the selected variants are associated with exposure; (2) the IV variants are not associated with the confounding factors of exposure and outcome; (3) the effect from IV variants to outcome was exclusively through exposure [Citation24]. In detail, when using CRP and OSA as exposure, we selected associated variants with p < 5 × 10⁻⁸ [Citation19]. Because of the limitation of sample size, the SNPs associated with TNF-α were selected with p < 5 × 10⁻⁶ [Citation21]. Then, clumping was performed with criteria of distance = 1000kb and r2=0.1 to include independently associated variants as IV. After harmonising with responsive outcome, each pair was obtained for subsequent analysis. Besides, F-statistic was used to assess the strength of the association between SNP and exposure, where score > 10 indicates that the instrument is sufficiently strong [Citation25].
Data analysis
We used several two-sample MR approaches to evaluate the causal effect between OSA and CRP, also OSA and TNF-α. First, we select SNPs of OSA as exposure to evaluate the causal effect of OSA on CRP and TNF-α. Then, the SNPs of OSA were performed as the outcome to assess the causal effect of CRP and TNF-α on OSA.
We used inverse-variance weighted (IVW) as the main outcome which assumes that all SNPs are valid instruments [Citation26]. In sensitivity analyses, we used MR Egger [Citation27], Weighted median [Citation28] and MR-Robust Adjusted Profile Score (RAPS) [Citation29] to correct for any potential violations of the assumptions. We used these three analyses as they operate in different ways and rely on different assumptions for valid inferences to assess the reliability of MR analyses. In addition, heterogeneity was analysed by Cochran’s Q test of IVW and MR Egger, pleiotropy was tested by the intercept of MR Egger analysis. When heterogeneity was detected for associated relationships, we used the RadialMR package to remove outliers and performed above analysis again [Citation30].
Results
Protein levels of TNF-α and CRP in OSA
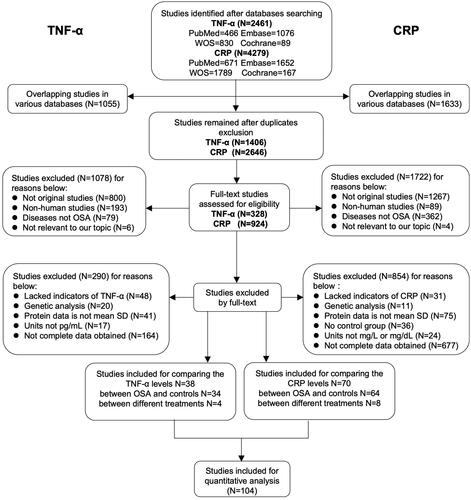
To compare the association between TNF-α and CRP levels and OSA patients, a total of 104 studies were included in the pooled qualitative analysis (), and the NOS score of every study ranged from 4 to 9. The extracted original details are presented in supplementary tables.
Figure 1. Flow diagram of literature selecting based on the inclusion and exclusion criteria. The left and right parts of the flow diagram represent the retrieval and screening process of TNF-α and CRP respectively. There are several articles that provided both comparison data between OSA and controls and between different treatments in OSA participants, or even one paper covered both TNF-α and CRP, thus the total count of included papers were less than the direct sum of each part.
Elevated CRP and TNF-α levels in OSA are related to its severity
Firstly, we compared the level of TNF-α between 1981 OSA patients and 1112 controls in 34 studies and the level of CRP between 4285 OSA patients and 3692 controls in 64 studies (Supplemental Tables 1–4). We found both TNF-α (WMD [95%CI] = 5.86 [4.80–6.93] pg/ml, p < .00001) and CRP (WMD [95%CI] = 2.66 [2.15–3.17] mg/L, p < .00001) showed a significant increase in OSA patients compared with controls (, Supplemental Figures 1–2). Besides, there were increasing trends with statistical significance from mild to moderate and then to severe for TNF-α and CRP (, Supplemental Figures 3–4). Sensitivity analysis suggested significantly higher trends of TNF-α and CRP in OSA. The funnel plot results indicated no apparent publication bias (Supplemental Figure 5).
Figure 2. Inflammation proteins of TNF-α and CRP were associated with severity of OSA. Weighted mean difference (WMD) and 95% confidence interval (95%CI) for inflammation proteins levels of TNF-α (A), CRP (B) were compared between mild, moderate, severe OSA patients and controls respectively. NO. of articles: number of articles included for analysis in each group. NO. of P/C: number of OSA patients (P) and controls (C) were included for each group. The statistically different results with p<.05 were shown in blue point.
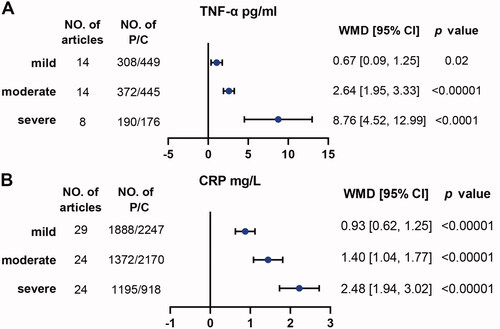
Table 1. Summary of studies included in analysis of TNF-α levels between OSA and controls.
Table 2. Summary of studies included in analysis of CRP levels between OSA and controls.
CPAP can significantly reduce TNF-α level, but slightly affect CRP in OSA
Next, we compared the changes in TNF-α of four studies and CRP of eight studies in OSA participants between the CPAP group and the non-CPAP group (, Supplemental Table 5). First, we analysed there were no statistical differences at baselines between the two groups for both TNF-α (WMD [95%CI] = 4.21[−2.29, 10.70] pg/ml, p = .20) and CRP (WMD [95%CI] = 0.07[−0.19, 0.32] mg/l, p = .61). After CPAP intervention, compared with non-CPAP group, TNF-α was decreased significantly (WMD [95%CI]= −4.44 [−4.81, −4.07] pg/ml, p < .00001), while CRP was decreased slightly (WMD [95%CI]= −0.91 [−1.65, −0.17] mg/l, p = .02) (, Supplemental Figures 6–7). Sensitivity analysis suggested that the trend of reduction in CRP and TNF-α remain unchanged. The funnel plot results indicated no apparent publication bias (Supplemental Figures 8–9).
Table 3. Characteristics of TNF-α and CRP levels in OSA participants with interventions of CPAP and non-CPAP.
Table 4. Comparison of TNF-α and CRP levels with different interventions in OSA subjects.
Causal associations between TNF-α and CRP levels and OSA
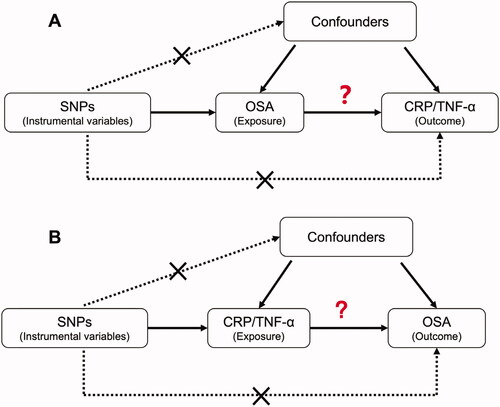
Before we evaluated the causal associations between protein levels of TNF-α and CRP and OSA in two directions (), we had confirmed the used instrumental variables were all strong with the F-statistic of 39.2 for OSA, 23.5 for TNF-α and 91.0 for CRP.
Figure 3. The design of Mendelian Randomization (MR) analysis to assess causality between OSA and inflammation proteins. (A) SNPs independently associated with OSA from GWAS summary statistic were used as instrumental variables to explore the causal effect of OSA on CRP or TNF-α. (B) SNPs independently associated with CRP or TNF-α from GWAS summary statistic were used as instrumental variables to explore the causal effect of CRP or TNF-α on OSA respectively. In addition to the association assumption, another two assumptions of MR include (1) SNPs are not associated with confounders between exposure and outcome, and (2) the effect from SNPs to outcome was exclusively through exposure.
Causal analysis from OSA on elevated CRP and TNF-α
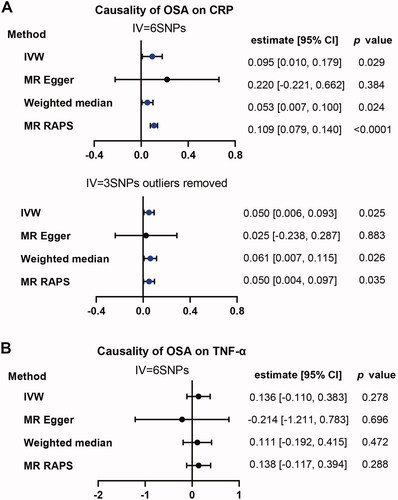
The primary method of IVW model showed that OSA was weakly associated with an increased risk of CRP (estimate: 0.095; 95% CI, [0.010, 0.179]; p = .029). Similar results were observed using Weighted median (estimate: 0.053; 95% CI, [0.007, 0.100]; p = .024) and MR RAPS (estimate: 0.109; 95% CI, [0.079, 0.140]; p = 1.98 × 10⁻¹²) except for MR-Egger (estimate: 0.220; 95% CI, [−0.221, 0.662]; p = .384). There was no evidence of pleiotropy (MR-Egger intercept −0.0112, standard error (SE) 0.0196, p = .599). However, there was high heterogeneity (Q = 46.16, p = 8.43 × 10−09). After removal the identified outliers of SNPs, there was no heterogeneity (Q = 0.548, p = .761) and the results were still significant with similar trends as before (). However, as for TNF-α, we did not observe any significant causal effect of OSA on TNF-α ().
Figure 4. Causality analysis for OSA on CRP or TNF-α by Mendelian Randomisation (MR). Several MR methods were used to analyse the causality for OSA as exposure, CRP (A) and TNF-α (B) as outcomes respectively. If heterogeneity existed, outliers were removed and following similar analysis again. IV: instrumental variable. SNP: single nucleotide polymorphism. IVW: inverse variance weighted. MR RAPS: MR-Robust Adjusted Profile Score (RAPS). The statistically different results with p<.05 were shown in blue point otherwise were shown in black point if p >.05.
Reverse analysis: Causal effect of CRP and TNF-α on OSA
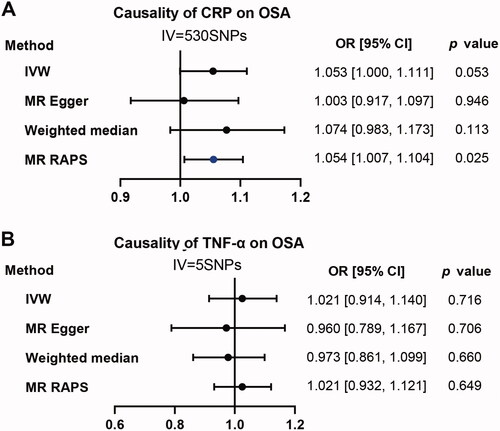
When using CRP as exposure and OSA as outcome, the p value of the primary method of IVW is almost significant (OR:1.053; 95% CI, [1.000, 1.111]; p = .053). MR RAPS instead of MR-Egger and Weighted median was positive (OR:1.054; 95% CI, [1.007, 1.104]; p = .025) (). As for TNF-α. We didn’t observe any positive results for all applied methods ().
Figure 5. Causality analysis for CRP and TNF-α on OSA by Mendelian Randomization (MR). Several MR methods were applied to test the causality for CRP (A) and TNF-α (B) as exposure individually, OSA as outcome. IV: instrumental variable. SNP: single nucleotide polymorphism. IVW: inverse variance weighted. MR RAPS: MR-Robust Adjusted Profile Score (RAPS). The statistically different results with p<.05 were shown in blue point otherwise were shown in black point if p >.05.
Discussion
Cumulative evidence supports that systematic inflammation may play a critical role in OSA. However, the relationship between the changes in inflammatory proteins and OSA is not completely clear. Through comparisons of protein differences and bidirectional causality analysis, the main findings of this study were that patients with OSA tended to have increased CRP and TNF-α levels, and elevated CRP and TNF-α were positively associated with OSA severity. Besides, effective CPAP intervention can reduce abnormal TNF-α in OSA, but this effect on CRP was mild. Moreover, OSA was found to be a suggestive causality for elevated CRP by MR analysis. And the reverse causal effect of CRP on OSA may not be excluded. But there was no causality between OSA and TNF-α.
As expected, the levels of CRP and TNF-α were higher in OSA and positively associated with OSA severity. Both cellular experiments and histological biopsy suggested that OSA led to vascular inflammation with increasing CRP and TNF-α [Citation31,Citation32]. Consistent with our findings, a meta-analysis including 15 studies concluded that the level of CRP was higher in patients with severe OSA than in control subjects [Citation14]. In addition to AHI, blood oxygen desaturation in OSA was also reported associated with CRP levels [Citation33,Citation34]. These findings support a strong link between inflammation and OSA. However, many confounding factors confuse our understanding of the association between inflammation and OSA. For instance, obesity is the most common risk factor for OSA [Citation35] and obesity has also been shown to have an impact on cytokines including CRP and TNF-α [Citation36]. It may confuse people whether high levels of inflammation proteins are the results of obesity or of OSA [Citation37–39].
In this study, we used MR to overcome the influence of unmeasured confounders from observational study, and we found the suggestive causality from OSA on CRP through several complementary MR methods. There are several pathophysiologic mechanisms implying such causal relationship. Recurrent closure and narrowing of the upper airway can result in inflammation of mucosa [Citation40,Citation41]. And IH in OSA can lead to reactive oxygen species which activates inflammation pathways such as NF-kB5. Recent research reported that OSA caused significant alteration in serum extracellular microvesicles protein composition including CRP which may participate in OSA-related injury [Citation42]. Interestingly, our result of mild reduction of CRP after CPAP intervention seemed to indirectly confirm the causality from OSA to CRP (). To be noticed, we can only say that CPAP can slightly reduce inflammation levels, but cannot prove whether it can be reduced to normal levels. A possible explanation for the mild reduction in CRP after CPAP therapy may be the existence of comorbidities such as obesity, arterial hypertension and diabetes in our included patients [Citation43–45], whereas an RCT which only collected OSA free of any comorbidities reported a significant reduction in CRP [Citation46]. These results suggested that the contributors to abnormal inflammation in OSA maybe not only OSA itself but also some comorbidities, and the latter may even mask the decrease in CRP after CPAP treatment [Citation44,Citation47].
In our reverse direction about causality from CRP to OSA, the almost significant association (OR:1.053; 95% CI, [1.000, 1.111]; p = .053) suggested we cannot exclude the possibility that CRP may lead to OSA. Consistently, a current longitudinal study reported that CRP was prospectively associated with increased OSA risk [Citation48]. Besides that Gaines et al. reported that CRP is the mediation between obesity and OSA, indicating that the release of CRP by visceral adipocytes plays a causative role in the development of OSA [Citation49]. According to the findings from bidirectional MR, there may exist a mild vicious cycle between OSA and CRP which needed further research to confirm.
The strengths of our study were that we explore the associations between OSA and CRP and TNF-α levels from multiple aspects including protein levels related to OSA-severity and CPAP treatment, and causal associations between them. Besides, using random distribution of genetic variation, the applied MR method can overcome potential confounding and reverse causation that may bias estimates from observational studies [Citation21]. In the absence of large-scale and long-term RCT data, our findings provide useful data to estimate the causality between OSA and inflammation.
Despite the enlightening findings, this comprehensive analysis does leave several limitations. First, some related publications were not included in the meta-analysis because their data formats, like median and quartile, were not compatible with other included papers (mean and SD). Second, the diagnosis of OSA GWAS was from medical electronic records, which may have selection bias and impaired MR power. Because only people with obvious clinical symptoms will go to the hospital, and those with subclinical symptoms may be mistakenly included in the control group. Third, the sample size of TNF-α GWAS was relatively small which may be a reason why we did not find a causal relationship between TNF-α and OSA.
Conclusions
In conclusion, our results confirmed that both CRP and TNF-α were increased in OSA and these increasing trends were severity-dependent. Though gently, elevated CRP and TNF-α can be reduced by effective CPAP treatment. In addition, MR analysis revealed suggestive causal direction from OSA to elevated CRP but not TNF-α. Further researches are needed to verify these findings.
Supplemental Material
Download Zip (3.6 MB)Disclosure statement
The authors declare no conflict of interest and consent for publication.
Data availability statement
Data is available on request to the corresponding author.
Correction Statement
This article has been republished with minor changes. These changes do not impact the academic content of the article.
Additional information
Funding
Related Research Data
References
- Peppard PE, Young T, Barnet JH, et al. Increased prevalence of sleep-disordered breathing in adults. Am J Epidemiol. 2013;177(9):1578–1014.
- Redline S, Sotres-Alvarez D, Loredo J, et al. Sleep-disordered breathing in hispanic/latino individuals of diverse backgrounds. The hispanic community health study/study of latinos. Am J Respir Crit Care Med. 2014;189(3):335–344.
- Gottlieb DJ, Punjabi NM. Diagnosis and management of obstructive sleep apnea: a review. JAMA. 2020;323(14):1389–1400.
- Unnikrishnan D, Jun J, Polotsky V. Inflammation in sleep apnea: an update. Rev Endocr Metab Disord. 2015;16(1):25–34.
- Dewan NA, Nieto FJ, Somers VK. Intermittent hypoxemia and OSA: implications for comorbidities. Chest. 2015;147(1):266–274.
- Shamsuzzaman AS, Winnicki M, Lanfranchi P, et al. Elevated C-reactive protein in patients with obstructive sleep apnea. Circulation. 2002;105(21):2462–2464.
- Minoguchi K, Yokoe T, Tazaki T, et al. Increased carotid intima-media thickness and serum inflammatory markers in obstructive sleep apnea. Am J Respir Crit Care Med. 2005;172(5):625–630.
- Minoguchi K, Tazaki T, Yokoe T, et al. Elevated production of tumor necrosis factor-alpha by monocytes in patients with obstructive sleep apnea syndrome. Chest. 2004;126(5):1473–1479.
- Kaditis AG, Alexopoulos EI, Kalampouka E, et al. Morning levels of C-reactive protein in children with obstructive sleep-disordered breathing. Am J Respir Crit Care Med. 2005;171(3):282–286.
- Tam CS, Wong M, McBain R, et al. Inflammatory measures in children with obstructive sleep apnoea. J Paediatr Child Health. 2006;42(5):277–282.
- Fornadi K, Lindner A, Czira ME, et al. Lack of association between objectively assessed sleep disorders and inflammatory markers among kidney transplant recipients. Int Urol Nephrol. 2012;44(2):607–617.
- Nadeem R, Molnar J, Madbouly EM, et al. Serum inflammatory markers in obstructive sleep apnea: a Meta-analysis. J Clin Sleep Med. 2013;9(10):1003–1012.
- Cao Y, Song Y, Ning P, et al. Association between tumor necrosis factor alpha and obstructive sleep apnea in adults: a meta-analysis update. BMC Pulm Med. 2020;20(1):215.
- Li K, Wei P, Qin Y, et al. Is C-reactive protein a marker of obstructive sleep apnea?: a meta-analysis. Medicine (Baltimore. 2017;96(19):e6850.
- Qaseem A, Holty JE, Owens DK, Clinical Guidelines Committee of the American College of Physicians, et al. Management of obstructive sleep apnea in adults: a clinical practice guideline from the American college of physicians. Ann Intern Med. 2013;159(7):471–483.
- Smith G, Ebrahim S. Mendelian randomization': can genetic epidemiology contribute to understanding environmental determinants of disease? Int J Epidemiol. 2003;32(1):1–22.
- Burgess S, Butterworth A, Thompson S. Mendelian randomization analysis with multiple genetic variants using summarized data. Genet Epidemiol. 2013;37(7):658–665.
- Lawlor D, Harbord R, Sterne J, et al. Mendelian randomization: using genes as instruments for making causal inferences in epidemiology. Stat Med. 2008;27(8):1133–1163.
- Sinnott-Armstrong N, Tanigawa Y, Amar D, FinnGen, et al. Genetics of 35 blood and urine biomarkers in the UK biobank. Nat Genet. 2021;53(2):185–194.
- Strausz S, Ruotsalainen S, Ollila HM, FinnGen, et al. Genetic analysis of obstructive sleep apnoea discovers a strong association with cardiometabolic health. Eur Respir J. 2021;57(5):2003091.
- Ahola-Olli AV, Würtz P, Havulinna AS, et al. Genome-wide association study identifies 27 loci influencing concentrations of circulating cytokines and growth factors. Am J Hum Genet. 2017;100(1):40–50.
- Yi M, Tan Y, Pi Y, et al. Variants of candidate genes associated with the risk of obstructive sleep apnea. Eur J Clin Invest. 2022;52(1):e13673.
- Collins R. What makes UK biobank special? Lancet. 2012;379(9822):1173–1174.
- VanderWeele TJ, Tchetgen Tchetgen EJ, Cornelis M, et al. Methodological challenges in mendelian randomization. Epidemiology. 2014;25(3):427–435.
- Burgess S, Thompson SG, CRP CHD Genetics Collaboration Avoiding bias from weak instruments in mendelian randomization studies. Int J Epidemiol. 2011;40(3):755–764.
- Burgess S, Davey Smith G, Davies NM, et al. Guidelines for performing mendelian randomization investigations. Wellcome Open Res. 2019;4:186.
- Bowden J, Davey Smith G, Burgess S. Mendelian randomization with invalid instruments: effect estimation and bias detection through egger regression. Int J Epidemiol. 2015;44(2):512–525.
- Bowden J, Davey Smith G, Haycock PC, et al. Consistent estimation in mendelian randomization with some invalid instruments using a weighted median estimator. Genet Epidemiol. 2016;40(4):304–314.
- Verbanck M, Chen CY, Neale B, et al. Detection of widespread horizontal pleiotropy in causal relationships inferred from mendelian randomization between complex traits and diseases. Nat Genet. 2018;50(5):693–698.
- Bowden J, Spiller W, Del Greco MF, et al. Improving the visualization, interpretation and analysis of two-sample summary data mendelian randomization via the radial plot and radial regression. Int J Epidemiol. 2018;47(4):1264–1278.
- Ryan S, Taylor C, McNicholas W. Selective activation of inflammatory pathways by intermittent hypoxia in obstructive sleep apnea syndrome. Circulation. 2005;112(17):2660–2667.
- Friberg D, Ansved T, Borg K, et al. Histological indications of a progressive snorers disease in an upper airway muscle. Am J Respir Crit Care Med. 1998;157(2):586–593.
- Wali SO, Abaalkhail B, AlQassas I, et al. The correlation between oxygen saturation indices and the standard obstructive sleep apnea severity. Ann Thorac Med. 2020;15(2):70–75.
- Chung S, Yoon IY, Shin YK, et al. Endothelial dysfunction and C-reactive protein in relation with the severity of obstructive sleep apnea syndrome. Sleep. 2007;30(8):997–1001.
- Malhotra A, White DP. Obstructive sleep apnoea. Lancet. 2002;360(9328):237–245.
- Fantuzzi G. Adipose tissue, adipokines, and inflammation. J Allergy Clin Immunol. 2005;115(5):911–919; quiz 920.
- Barceló A, Barbé F, Llompart E, et al. Effects of obesity on C-reactive protein level and metabolic disturbances in male patients with obstructive sleep apnea. Am J Med. 2004;117(2):118–121.
- Ryan S, Nolan GM, Hannigan E, et al. Cardiovascular risk markers in obstructive sleep apnoea syndrome and correlation with obesity. Thorax. 2007;62(6):509–514.
- Framnes SN, Arble DM. The bidirectional relationship between obstructive sleep apnea and metabolic disease. Front Endocrinol (Lausanne). 2018;9:440.
- Paulsen F, Steven P, Tsokos M, et al. Upper airway epithelial structural changes in obstructive sleep-disordered breathing. Am J Respir Crit Care Med. 2002;166(4):501–509.
- Boyd J, Petrof B, Hamid Q, et al. Upper airway muscle inflammation and denervation changes in obstructive sleep apnea. Am J Respir Crit Care Med. 2004;170(5):541–546.
- Zhang H, Yang F, Guo Y, et al. The contribution of chronic intermittent hypoxia to OSAHS: from the perspective of serum extracellular microvesicle proteins. Metabolism. 2018;85:97–108.
- Wang X, Yue Z, Liu Z, et al. Continuous positive airway pressure effectively ameliorates arrhythmias in patients with obstructive sleep apnea-hypopnea via counteracting the inflammation. Am J Otolaryngol. 2020;41(6):102655.
- Campos-Rodriguez F, Asensio-Cruz MI, Cordero-Guevara J, Spanish Sleep Network, et al. Effect of continuous positive airway pressure on inflammatory, antioxidant, and depression biomarkers in women with obstructive sleep apnea: a randomized controlled trial. Sleep. 2019;42(10):42.
- Ishida K, Kato M, Kato Y, et al. Appropriate use of nasal continuous positive airway pressure decreases elevated C-reactive protein in patients with obstructive sleep apnea. Chest. 2009;136(1):125–129.
- Drager LF, Bortolotto LA, Figueiredo AC, et al. Effects of continuous positive airway pressure on early signs of atherosclerosis in obstructive sleep apnea. Am J Respir Crit Care Med. 2007;176(7):706–712.
- Kohler M, Ayers L, Pepperell JC, et al. Effects of continuous positive airway pressure on systemic inflammation in patients with moderate to severe obstructive sleep apnoea: a randomised controlled trial. Thorax. 2009;64(1):67–73.
- Huang T, Goodman M, Li X, et al. C-reactive protein and risk of OSA in four US cohorts. Chest. 2021;159(6):2439–2448.
- Gaines J, Vgontzas AN, Fernandez-Mendoza J, et al. Inflammation mediates the association between visceral adiposity and obstructive sleep apnea in adolescents. Am J Physiol Endocrinol Metab. 2016;311(5):E851–e858.