
Abstract
Introduction
Idiopathic aplastic anaemia (IAA) is a heterogeneous autoimmune disease characterised by pancytopenia and bone marrow failure. The objective of the study was to investigate the clusters of lymphocyte subset in newly diagnosed IAA patients and explore their correlation with clinical characteristics.
Methods
A total of 124 newly diagnosed IAA patients were enrolled. Lymphocyte subset was detected by flow cytometry. Cluster analysis was conducted to identify subgroups of patients based on lymphocyte subset.
Results
Cluster analysis classified patients into four distinctive subgroups: Cluster 1 (CD4+ T cells dominant), Cluster 2 (CD8+ T cells dominant), Cluster 3 (NK cells dominant) and Cluster 4 (B cells dominant). Patients in Clusters 1 and 4 suffered more severe disease status than ones in Clusters 2 and 3 (p = .013). And with it, patients in Cluster 2 had the highest white blood cell count, haemoglobin level, reticulocyte count and reticulocyte percentage, while patients in Cluster 3 had the lowest lymphocyte percentage and the highest neutrophil count (all p < .05). Unexpectedly, patients in Cluster 3 tended to have superior curative effect than ones in other clusters, an ordinal logistic regression analysis further confirmed the independent correlation between Cluster 3 and good response to treatment. Lymphocyte subset clustering may serve as a biomarker for assessing disease severity and treatment efficacy in newly diagnosed IAA patients.
Newly diagnosed IAA patients could be classified into 4 distinctive subgroups with similar immune patterns by using cluster analysis of lymphocyte subset.
Clusters of lymphocyte subset were closely correlated with disease severity and treatment response of IAA.
Lymphocyte subset clustering may serve as a promising tool for assessing disease severity and treatment efficacy in newly diagnosed IAA patients.
Key Messages
1. Introduction
Idiopathic aplastic anaemia (IAA), characterised by pancytopenia and bone marrow hypoplasia, is the most common bone marrow failure syndrome [Citation1]. The incidence of IAA in Asia is two to three times higher than the United States and Europe [Citation2]. Up to now, the effectiveness of standard immunosuppressive therapy (IST) composed of anti-human thymocyte globulin (ATG) and cyclosporine A (CsA) is about 60%–70% for severe aplastic anaemia (SAA), and approximately 10%–20% of the effective patients will relapse [Citation3]. Besides, clonal evolution to acute leukaemia or myelodysplasia syndrome is one of the most serious complications during long-term follow up of IAA [Citation4]. The high incidence and poor prognosis of IAA takes up abundant resource of public health in China. Thus, it will be of great importance to explore a useful biomarker to predict disease severity and treatment efficacy of IAA, which may help physicians select the appropriate treatment for patients.
Accumulating evidence has indicated that aberrant cellular immunity plays a pivotal role in the pathogenesis of IAA. Therefore, IAA is considered to be an autoimmune disease and bone marrow is the target organ. The presently known immune abnormity of IAA includes immoderate polarisation of CD4+ T cells to Th1 cells, hyper-activated CD8+ cytotoxic T cells, functional deficiency of regulatory T cells (Tregs), and excessive secretion of negative haematopoietic cytokines, such as interferon (IFN)-γ and tumour necrosis factor-α [Citation5–8]. Additionally, natural killer (NK) cells are found to be involved in the onset of IAA [Citation9]. Compared with healthy controls, the percentage of NK cells is sharply decreased in newly diagnosed SAA patients, and recovered after IST [Citation9].
Many studies have focussed on the biological markers for predicting curative effect of IAA. Several indicators related with immunologic function and residual bone marrow haematopoiesis have been raised as favourable prognostic factors, such as higher absolute number of reticulocyte, higher count of lymphocyte, lower thrombopoietin levels, karyotype of +8, with PNH clone and longer telomere length [Citation10,Citation11]. Even so, there is no definite indicator with excellent prognostic value for helping make patient-oriented therapeutic regimen.
Since IAA is a heterogeneous autoimmune disease, and immune dysfunction mediated by lymphocyte subset is the critical process of the onset and progression of IAA, we speculated that lymphocyte subset clustering may help recognise different clinical patterns of patients with similar disease severity or treatment response. To our knowledge, no previous studies have been presented to identify subgroups of IAA based on lymphocyte subset. We herein conducted this study to draw immune profiles of IAA using lymphocyte subset clustering analysis and investigate their correlation with clinical manifestations.
2. Materials and methods
2.1. Study population
A total of 124 newly diagnosed IAA patients (median age 23.5 years, range: 14–74 years, IQR: 18–36 years, 78 male and 46 female) admitted to the Institute of Haematology & Blood Diseases Hospital were retrospectively studied. Lymphocyte subset of peripheral blood (PB) was routinely detected for IAA patients in our institute. 32 age- (median age 29 years, range: 16–63 years, IQR: 23–40 years) and sex-matched healthy controls were also included. Subjects with history of autoimmune diseases were excluded. The diagnosis and severity classification of IAA was in compliance with the criteria proposed by Camitta et al. [Citation12]. This cohort contained 29 cases with very severe AA (VSAA), 36 cases with SAA and 59 cases with non-severe AA (NSAA). The study was approved by the Ethics Committee of the Institute of Haematology, and written informed consents were obtained from all the participants.
2.2. Measurement of lymphocyte subset by flow cytometry (FCM)
PB samples were collected from the subjects. Detection of lymphocyte subset was conducted by FCM. Briefly, 100 μl EDTA anticoagulated whole blood was drawn into tubes for FCM, then incubated with FITC-conjugated anti-CD3, PE-conjugated anti-CD4, APC-conjugated anti-CD8, PerCP-conjugated anti-CD19, PE-conjugated anti-CD16 + 56 and isotype controls (BD Biosciences) for 30 min. Then, added FACS Lysing Solution (BD Biosciences) according to the manufacturer’s protocol. The samples were performed on Canto II flow cytometer (BD Biosciences). The lymphocyte subset we studied mainly included CD4+ T cells (CD3+CD4+), CD8+ T cells (CD3+CD8+), B cells (CD19+) and NK cells (CD3−CD16+CD56+), and the FCM gating of these subset was displayed in Supplementary Figure S1.
2.3. Statistical analysis
Data was analysed using SPSS 26.0 software (SPSS, Chicago, IL, USA). Descriptive statistic was shown as mean ± standard error of mean (SEM) for quantitative data, frequency and percentage for qualitative data. Cluster analysis was carried out using hierarchical clustering algorithm with Ward’s method of squared Euclidean distance. K-means was used to verify the reliability and repeatability of the lymphocyte subset clustering. Principal component analysis (PCA) was undertaken to visualise the clustering results. The t or one way ANOVA test was used to compare continuous data, and χ2 test was used to compare categorical data. Ordinal logistic regression analysis was performed to evaluate the influence of clusters on treatment efficacy. The p < .05 was considered statistically significant.
3. Results
3.1. The percentage and absolute number of lymphocyte subset in PB of IAA patients and normal controls
We firstly compared the percentage and absolute number of total lymphocyte, lymphocyte subset (including CD3+ T cells, CD3+CD4+ T cells, CD3+CD8+ T cells, CD3−CD16+CD56+NK cells and CD19+B cells) and the ratio of CD4+/CD8+ between IAA patients and normal controls. As shown in and , the percentage of total lymphocyte was significantly elevated in IAA patients than in controls (p < .001), while the absolute number of total lymphocyte was statistically decreased in IAA patients than in controls (p = .029). For lymphocyte subset, the percentage and absolute number of CD4+ T cells in IAA patients was statistically lower than in controls (p = .007 and .007, respectively), while the percentage of CD8+ T cells was inversely higher in IAA patients than in controls (p < .001). Consequently, the ratio of CD4+/CD8+ in IAA patients was obviously lower than in controls (p = .003), indicating the aberrant immune status of IAA. Unexpectedly, we interestingly found that the absolute number of NK cells in IAA patients was markedly decreased than in controls (p = .001).
Figure 1. The distribution of lymphocyte subset between IAA patients and normal controls. The proportion of total lymphocyte (A), CD3+T cells (B), CD4+T cells (C), CD8+T cells (D), B cells (E) and NK cells (F) between IAA patients and normal controls. IAA: idiopathic aplastic anaemia.
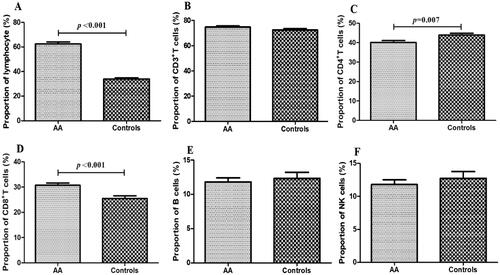
Table 1. The distribution of lymphocyte subset between IAA patients and normal controls.
3.2. Lymphocyte subset clustering in IAA patients and normal controls
Based on lymphocyte subset profile, we identified 4 distinctive subgroups in 124 newly diagnosed IAA patients by using hierarchical cluster analysis (). A scatterplot of the four clusters conducted by PCA was displayed in . Depending on the sample size of each cluster, the four subgroups were named as Clusters 1, 2, 3 and 4, respectively. The percentage distribution of lymphocyte subset in each cluster was displayed in and . As shown in and , Cluster 1 was CD4+ T cells-dominant group, Cluster 2 was CD8+ T cells-dominant group, Cluster 3 was NK cells-dominant group and Cluster 4 was B cells-dominant group. The largest cluster was CD4-dominant Cluster 1 (n = 50, 40.3%), and then were CD8-dominant Cluster 2 (n = 33, 26.6%), NK-dominant Cluster 3 (n = 22, 17.8%) and B-dominant Cluster 4 (n = 19, 15.3%). The clustering results obtained by K-means were highly consistent with above findings (displayed in Supplementary Table S1), further confirmed the dependability of the lymphocyte clustering in IAA patients. Besides, the reliability of lymphocyte clustering was proven by a training/testing data scheme.
Figure 2. The results of lymphocyte clustering and the differences among clusters in newly diagnosed IAA patients. (A) Four distinctive clusters of patients (n = 124) were identified by using hierarchical clustering algorithm with Ward’s method of squared euclidean distance based on lymphocyte subset. (B) The scatterplot performed by PCA to show the four distinct clusters. (C–F) The proportions of CD4+T cells, CD8+T cells, B cells and NK cells among the four clusters. IAA: idiopathic aplastic anaemia. *** p value <.001; ** p value <.01; * p value <.05.
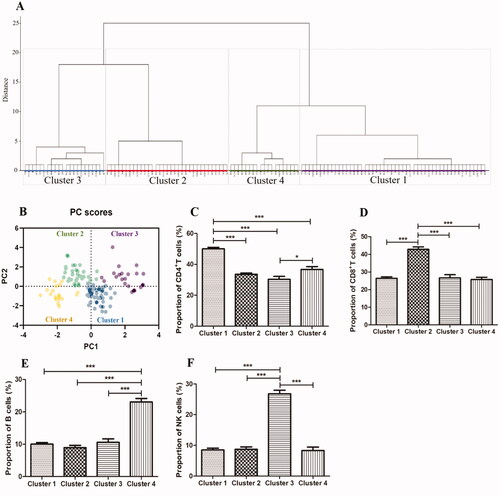
Table 2. Distribution of lymphocyte subset in four clusters of IAA patients.
We also performed cluster analysis of lymphocyte subset in normal controls by using hierarchical clustering method. The lymphocyte subset of normal controls could also be clustered into four distinct categories (displayed in Supplementary Figure S2): B cells-dominant Cluster 1 (n = 15), CD4+ T cells-dominant Cluster 2 (n = 6), NK cells-dominant Cluster 3 (n = 6) and CD8+ T cells-dominant Cluster 4 (n = 5). The percentage of lymphocyte subset in each cluster was shown in Supplementary Table S2. From the findings presented in Supplementary Figure S2 and Table S2, the clustering of lymphocyte subset in normal controls was significantly different from that in IAA patients in terms of distribution, sample size and lymphocyte proportions, further confirming the aberrant immunity-oriented pathogenesis of IAA.
3.3. Clinical and laboratory characteristics of patient-clusters
All available data was collected from medical records, including age, gender, classification of disease severity, treatment strategy, white blood cell (WBC), haemoglobin (Hb), platelet (PLT), lymphocyte count, lymphocyte percentage, neutrophil count, reticulocyte count, reticulocyte percentage and PNH clone.
The baseline clinical and laboratory characteristics of the four clusters were displayed in . The age distribution among four clusters was statistically different, and patients in Cluster 2 were younger than others (30.46, 21.45, 29.09 and 25.00 in Clusters 1, 2, 3 and 4, respectively; p = .018). Significantly, patients in Clusters 1 and 4 tended to have more severe disease status than cases in Clusters 2 and 3 (p = .013). Consequently, patients in Cluster 2 had the highest WBC count, Hb level, reticulocyte count and reticulocyte percentage (p = .025, .006, < .001 and <.001, respectively), while patients in Cluster 3 had the lowest lymphocyte percentage and the highest neutrophil count (p = .016 and .017, respectively). In terms of gender distribution, treatment strategy, count of PLT and lymphocyte, and PNH clone, there was no statistical difference among four clusters.
Table 3. Characteristics of IAA subgroups classified by cluster analysis.
3.4. Treatment response of patient-clusters
We further explored the association of patient-clusters and treatment efficacy at 12 months. In all the patients, 7 cases (5.6%) were lost to follow-up. Therefore, 117 patients were calculated for evaluating treatment response at 12 months. The treatment response included complete response (CR), partial response (PR) and no response (NR). Of these 117 patients, 29 received ATG combined with CsA-based IST, while the others received CsA alone. The rate of CR, PR and NR at 12 months were 51.7% (15/29), 24.1% (7/29) and 24.1% (7/29), respectively, for patients treated with ATG + CsA, while 27.3% (24/88), 34.1% (30/88) and 38.6% (34/88) for patients treated with CsA alone (p = .052). We then assessed the difference of curative effects among different clusters. As displayed in , patients in NK-dominant Cluster 3 tended to have superior curative effect than ones in Clusters 1 and 4 (p = .026 and .01, respectively). To further validate the influence of clusters on treatment response, an ordinal logistic regression analysis was conducted. After adjusting for gender, age, severity of disease, therapeutic regimen and PNH clone, cluster grouping was confirmed to be related with treatment response independently. As presented in , patients suffered inferior response were 4.135 times higher in Cluster 1, 3.891 times higher in Cluster 2 and 5.920 times higher in Cluster 4 compared with subjects in Cluster 3 (p = .042, .049 and .015, respectively), indicating Cluster 3 was closely correlated with good response.
Figure 3. Comparison of treatment response among clusters. The treatment response at 12 months was compared among the four clusters. CR: complete response; PR: partial response; NR: no response.
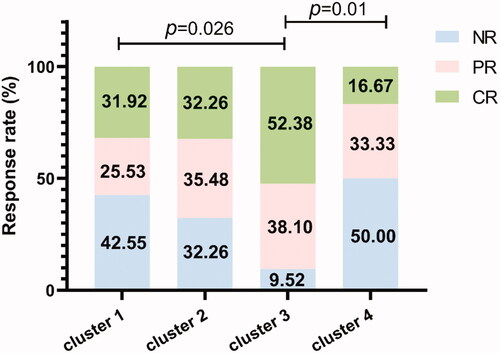
Table 4. Ordinal logistic regression analysis of treatment response based on patient-clusters.
4. Discussion
IAA is a special autoimmune disease attacked by autoreactive lymphocytes on haematopoietic precursors, leading to progressive aggravation of pancytopenia. Patients often manifest with anaemia, haemorrhage and severe infection. IAA is also a heterogeneous disease, characterised by a great difference in terms of disease severity and treatment outcome. Therefore, seeking a biological indicator that can distinguish patients with similar clinical patterns is of great importance to instruct treatment options and improve long-term survival of IAA patients. In this study, we identified four distinct subgroups of newly diagnosed IAA patients based on lymphocyte subset clustering analysis, and each subgroup shared immunological similarity of lymphocyte subset. We also investigated the clinical differences among the four subgroups.
We first compared the distribution of lymphocyte subset between IAA patients and healthy controls. Consistent with previous study [Citation13], despite the proportion of lymphocyte was significantly increased in IAA patients (possibly due to the decreased absolute number of neutrophils), the count of total lymphocyte was statistically reduced in IAA patients than in controls. We also found that IAA patients were with elevated percentage of CD8+ T cells, decreased percentage and absolute number of CD4+ T cells and inverted CD4+/CD8+ ratio, further confirming the critical role of abnormal T cell immunity in the pathogenesis of IAA. Interestingly, we discovered that the absolute number of NK cells was significantly decreased in IAA patients, in accordance with previous study [Citation9]. Numerous studies have provided evidence that NK cells have immunomodulatory activity besides their widely known cytotoxic effect, and are involved in the pathogenesis of several autoimmune diseases, such as systemic lupus erythematous and rheumatoid arthritis [Citation14,Citation15]. Given the complexity and versatility of NK subset, the exact function of NK cells played in IAA deserves further research.
We then identified lymphocyte subset clusters in IAA patients using cluster analysis. Our study confirmed the existence of specific lymphocyte clusters, which were listed as follows: CD4+ T cells-dominant Cluster 1, CD8+ T cells-dominant Cluster 2, NK cells-dominant Cluster 3 and B cells-dominant Cluster 4. There was some correlation between different clusters and clinical characteristics. The percentage of VSAA/SAA cases in Clusters 1 and 4 was significantly higher than in Clusters 2 and 3. As a result, patients in Cluster 2 had the highest WBC count, Hb level, reticulocyte count and reticulocyte percentage, while patients in Cluster 3 had the lowest lymphocyte percentage and the highest neutrophil count. Thus, patients in Clusters 1 and 4 were prone to progress to more severe disease status while patients in Clusters 2 and 3 generally suffered from mild status. Above findings suggested that the severity of IAA was related with the particular patterns of lymphocyte subset imbalance, and the potential pathogenesis of NSAA might differ from that of VSAA/SAA. Further functional researches are warranted to establish the definite mechanism by which specific lymphocyte subset influence the severity of IAA.
NK cells, with great phenotypic and functional heterogeneity, are important component of innate immune cells. Along with research going deep, NK cells were proved to be far more complicated than we initially thought, and only a small portion of NK cells were with killing function while most of them had no cytotoxic activity [Citation16]. In addition to their roles as innate killers, NK cells were confirmed to crucially regulate adaptive immune response in a direct or an indirect manner, to inhibit or promote T cell response in different conditions [Citation17]. Recently, the role of NK cells exerted in IAA was widely studied, but the findings were somewhat conflicting, possibly due to the differences in the disease stage, patients age, experimental methods and other factors. Liu et al. reported that the proportion of NK cells in PB from treatment-naïve SAA patients was significantly decreased and obviously increased after IST [Citation9]. And yet few studies were focussed on the number of NK cells in BM from IAA patients, so the exact amounts of NK cells in BM remained unclear. For the function of NK cells, several proteins related with cytotoxic property of NK cells, such as NKp46 and perforin, have been reported to be elevated in NK cells from IAA patients [Citation9]. However, there were a number of studies have confirmed that the cytotoxic activity of NK cells in PB and BM from IAA patients was significantly decreased, which might due to intrinsic perforin gene mutation [Citation18–20]. After treated with ATG based IST, the cytotoxic activity of NK cells returned to normal range in most patients, and the recovery of NK cells cytotoxicity was correlated with haematopoiesis recovery [Citation20]. Besides, Chen et al. reported that NK cells from SAA patients suppressed autologous CD8+ T cells immunity in an NKG2D-dependent manner, and verified in AA mouse models, which indicated that NK cells exerted immunoregulatory and protective roles in the pathogenesis of IAA [Citation21]. Based on the above discovery, we speculated that NK cells played a protective rather than a harmful role in IAA, but the protective effect was impaired due to the deficiency of quantities and function of NK cells. In our study, we also found that the quantities of NK cells in PB of VSAA/SAA were dramatically reduced while the quantities of NK cells in NSAA were comparable with healthy controls (data not shown). Otherwise, patients in NK-dominant Cluster 3 suffered a relatively mild illness. More importantly, we observed that patients in Cluster 3 had a good response to treatment than cases in other clusters, and the positive prognostic influence of Cluster 3 was further verified by an ordinal logistic regression analysis. Similar to our results, Narita et al. reported that SAA patients with higher NK cells before treatment were more effective to IST than cases with lower NK cells, and logistic regression analysis confirmed that the baseline NK cells count was an independent predictive factor of treatment response [Citation22]. Additionally, they discovered that the recovery of NK cells was positively related with the haematopoietic recovery after IST, indicating dynamic monitoring the alteration of NK cells count might serve as a tool to predict disease activity, treatment response and relapse of IAA [Citation22]. The definite mechanism accounting for the close association of NK cells with disease severity and treatment response remained unclear. Given the immunoregulatory effect of NK cells, we speculated that decreased number of NK cells was less efficient in inhibiting activation of T cells, hyper-activated T cells thus in turn attacked haematopoietic progenitors, consequently leading to more serious bone marrow failure and decreased residual haematopoiesis, therefore, patients with lower NK cells were subject to more severe disease status and a worse prognosis. The underlying role of NK cells involved in the pathogenesis of IAA still need an in-depth study in the future.
B cells play crucial roles in humoral immunity and in activating T cells. Accumulating evidence has confirmed that B cells also contribute to the pathogenesis of IAA. Several autoantibodies (Ab) targeted to specific autoantigens have been identified in the serum of IAA patients that prompting B cells mediated humoral immunity, for example, anti-moesin Ab, anti-diazepam-binding inhibitor-related protein 1 Ab, anti-kinectin Ab, anti-postmeiotic segregation increased 1 Ab and anti-HNRNPK Ab [Citation23]. Sevilla et al. found that the precursors of B cells were significantly decreased in the BM of paediatric IAA [Citation24]. Inversely, Fang et al. reported that the percentage of CD20+B cells in PB was significantly increased in VSAA patients and exhibited a negative correlation with the amount of Tregs [Citation25], in line with our results that patients in B cells-dominant Cluster 4 were accompanied with more severe disease status. Several studies have reported that some IAA patients responded well to rituximab treatment [Citation26,Citation27], given the close interaction between B and T cells, one possible explanation might be that with the depletion of B cells, the function of T cells was subsequently impaired and the secretion of negative haematopoietic cytokines was inhibited; another might be that abnormal B cells did mediate suppression of haematopoiesis in IAA patients. In our study, we unexpectedly discovered that patients in Cluster 4 suffered inferior response to IST than others, whether these patients could benefit from such anti-CD20 Ab therapy was worthy of further study. As well, the exact roles of B cells implicated in the pathogenesis of IAA needed to be investigated in depth in the future.
There are several limitations in our study. First, the sample size was relatively small, and all the patients were collected from one single centre. Our findings should be further prospectively verified by a larger sample size in different medical centres. Second, owing to the limited number of newly diagnosed IAA patients, lymphocyte subset clustering was generally done in patients with all degrees of disease severity. Further cluster analysis respectively done in SAA groups and NSAA groups may be more precise in assessing the efficiency of lymphocyte subset clustering as a tool. Last, our work was lack of functional experiment about particular lymphocyte subset, and more functional studies are warranted to elucidate the detailed mechanism of lymphocyte subset in IAA.
In conclusion, based on lymphocyte subset, newly diagnosed IAA patients could be classified into four distinctive subgroups with similar immune patterns: CD4+ T cells-dominant Cluster 1, CD8+ T cells-dominant Cluster 2, NK cells-dominant Cluster 3 and B cells-dominant Cluster 4. Patients in Clusters 2 and 3 presented with a milder disease status than ones in Clusters 1 and 4. More importantly, patients in Cluster 3 were with better response to treatment than others. Thus, clustering of lymphocyte subset may serve as a promising tool to assess disease severity and treatment response of IAA, which will instruct physicians make individualised therapeutic decision for IAA patients.
Author contributions
W.Y. designed the project and analysed the data. Q.W. helped to acquire and analyse some clinical data. W.Y. and M.G. interpreted the data and drafted the manuscript. X.S. revised the paper critically for intellectual content. X.S. and M.G. approved the final version to be published. All authors agreed to be accountable for all aspects of the work.
Supplemental Material
Download MS Word (393.2 KB)Acknowledgements
The authors thank all of the doctors in Therapeutic Centre of Anemic Diseases, Institute of Hematology & Blood Diseases Hospital for their professional assistance.
Disclosure statement
No potential conflict of interest was reported by the author(s).
Data availability statement
The data that support the findings of this study are available from the corresponding author upon reasonable request.
References
- Brodsky RA, Jones RJ. Aplastic anaemia. Lancet 2005;365(9471):1647–1656.
- Wang L, Liu H. Pathogenesis of aplastic anemia. Hematology 2019;24(1):559–566.
- Jeong DC, Chung NG, Cho B, et al. Longterm outcome after immunosuppressive therapy with horse or rabbit antithymocyte globulin and cyclosporine for severe aplastic anemia in children. Haematologica 2014;99(4):664–671.
- Li Y, Li X, Ge M, et al. Long-term follow-up of clonal evolutions in 802 aplastic anemia patients: a single-center experience. Ann Hematol. 2011;90(5):529–537.
- Young NS, Maciejewski J. The pathophysiology of acquired aplastic anemia. N Engl J Med. 1997;336(19):1365–1372.
- Giannakoulas NC, Karakantza M, Theodorou GL, et al. Clinical relevance of balance between type 1 and type 2 immune responses of lymphocyte subpopulations in aplastic anaemia patients. Br J Haematol. 2004;124(1):97–105.
- Shi J, Ge M, Lu S, et al. Intrinsic impairment of CD4(+)CD25(+) regulatory T cells in acquired aplastic anemia. Blood 2012;120(8):1624–1632.
- Sloand E, Kim S, Maciejewski JP, et al. Intracellular interferon-gamma in circulating and marrow T cells detected by flow cytometry and the response to immunosuppressive therapy in patients with aplastic anemia. Blood 2002;100(4):1185–1191.
- Liu C, Li Z, Sheng W, et al. Abnormalities of quantities and functions of natural killer cells in severe aplastic anemia. Immunol Invest. 2014;43(5):491–503.
- Killick SB, Bown N, Cavenagh J, British Society for Standards in Haematology, et al. Guidelines for the diagnosis and management of adult aplastic anaemia. Br J Haematol. 2016;172(2):187–207.
- Elmahdi S, Muramatsu H, Narita A, et al. Markedly high plasma thrombopoietin (TPO) level is a predictor of poor response to immunosuppressive therapy in children with acquired severe aplastic anemia. Pediatr Blood Cancer. 2016;63(4):659–664.
- Camitta BM, Thomas ED, Nathan DG, et al. A prospective study of androgens and bone marrow transplantation for treatment of severe aplastic anemia. Blood 1979;53(3):504–514.
- Javan MR, Saki N, Moghimian-Boroujeni B. Aplastic anemia, cellular and molecular aspects. Cell Biol Int. 2021;45(12):2395–2402.
- Vivier E, Tomasello E, Baratin M, et al. Functions of natural killer cells. Nat Immunol. 2008;9(5):503–510.
- Kucuksezer UC, Aktas Cetin E, Esen F, et al. The role of natural killer cells in autoimmune diseases. Front Immunol. 2021;12:622306.
- Subedi N, Verhagen LP, Bosman EM, et al. Understanding natural killer cell biology from a single cell perspective. Cell Immunol. 2022;373:104497.
- Crouse J, Xu HC, Lang PA, et al. NK cells regulating T cell responses: mechanisms and outcome. Trends Immunol. 2015;36(1):49–58.
- Porwit A, Hast R, Stenke L, et al. Decreased blood natural killer cell activity and immunoglobulin synthesis in vitro in aplastic anemia. Acta Med Scand. 1988;224(4):391–397.
- Solomou EE, Gibellini F, Stewart B, et al. Perforin gene mutations in patients with acquired aplastic anemia. Blood 2007;109(12):5234–5237.
- Gascón P, Zoumbos N, Young N. Analysis of natural killer cells in patients with aplastic anemia. Blood 1986;67(5):1349–1355.
- Chen T, Zhang T, Liu C, et al. NK cells suppress CD8+ T cell immunity via NKG2D in severe aplastic anemia. Cell Immunol. 2019;335:6–14.
- Narita A, Muramatsu H, Xu Y, et al. High natural killer cell count at diagnosis predicts a good response to immunosuppressive therapy in aplastic anemia. Blood 2019;134(Supplement_1):2505–2505.
- Goto M, Kuribayashi K, Takahashi Y, et al. Identification of autoantibodies expressed in acquired aplastic anaemia. Br J Haematol. 2013;160(3):359–362.
- Sevilla DW, Emmons FN, Colovai AI, et al. Hematogones are markedly reduced in pediatric acquired aplastic anemia: multiparametric flow cytometric analysis. Leuk Lymphoma. 2009;50(12):1951–1957.
- Fang J, Lin L, Wang Y, et al. Regulatory T cells and CD20+ B cells in pediatric very severe aplastic anemia: possible clinical markers for evaluating the therapeutic efficacy and prognosis. Hematology. 2018;23(10):823–827.
- Hansen PB, Lauritzen AMF. Aplastic anemia successfully treated with rituximab. Am J Hematol. 2005;80(4):292–294.
- Gómez-Almaguer D, Jaime-Pérez JC, Ruiz-Arguelles GJ. Antibodies in the treatment of aplastic anemia. Arch Immunol Ther Exp (Warsz). 2012;60(2):99–106.