
Abstract
Introduction
Patient-Reported Outcomes Measurement Information System (PROMIS®) is commonly used across medical conditions. To facilitate interpretation of scores across countries, we calculated Dutch reference values for PROMIS Physical Function (PROMIS-PF), Pain Interference (PROMIS-PI), Pain Behavior (PROMIS-PB), Ability to Participate in Social Roles and Activities (PROMIS-APSRA), and Satisfaction with Social Roles and Activities (PROMIS-SSRA), as compared to US reference values.
Patients and methods
A panel completed full PROMIS-PF (n=1310), PROMIS-PI and PROMIS-PB (n=1052), and PROMIS-APSRA and PROMIS-SSRA (n=1002) item banks and reported their level of health per domain (no, mild, moderate, severe limitations). T-scores were calculated by sample and subgroups (age, gender, self-reported level of domain). Distribution-based and anchor-based thresholds for mild, moderate, and severe scores were determined.
Results
Mean T-scores were close to the US mean of 50 for PROMIS-PF (49.8) and PROMIS-APSRA (50.6), lower for PROMIS-SSRA (47.5) and higher for PROMIS-PI (54.9) and PROMIS-PB (52.0). Distribution-based thresholds for mild, moderate, and severe scores were comparable to US recommended cut-off values (except for PROMIS-PI) but participants reported limitations ‘earlier’ than suggested thresholds.
Conclusion
Dutch reference values were close to US reference values for some PROMIS domains but not all. We recommend country-specific reference values to facilitate worldwide PROMIS use.
PROMIS offers universally applicable IRT-based efficient and patient-friendly measures to assess commonly relevant patient-reported outcomes across medical conditions.
To support the use of PROMIS in daily clinical practice and research across the world, country-specific general population reference values should be obtained.
More research is necessary to obtain reliable and valid cut-off values for what constitutes mild, moderate and severe scores from the patients’ perspective.
KEY MESSAGES
Introduction
Patient-Reported Outcome Measures (PROMs) are increasingly used for outcome measurement in clinical practice to facilitate value-based health care. There is evidence that the routine use of PROMs can lead to better patient-clinician communication, increased discussion of psychosocial issues and improved shared-decision making [Citation1–3]. In addition, beneficial effects of routine PROM use have been found on symptom control, quality of life outcomes, patient satisfaction and even survival [Citation2,Citation4–10] as well as on health care expenditure [Citation11–13].
The beneficial effects of the routine use of PROMs can only be obtained if PROMs are successfully implemented in daily clinical care [Citation14–16]. However, there are many implementation barriers. Important ones are the selection of patient-reported outcomes (PROs) that are most relevant for patients and the selection of the most suitable PROMs to measure these PROs. A quite common approach is to use disease-specific PROMs because it is assumed that these PROMs are most relevant for the patient group at issue and most responsive to their treatment. However, implementing disease-specific PROMs in daily clinical practice is doomed to fail. It is too time-consuming and too costly to implement disease-specific PROMS in electronic health records for every patient group. It is too complex for clinicians and patients to interpret and discuss PROMs with different scales and different cut-off values. And finally, it is too burdensome to ask an increasing number of patients with multiple conditions to complete multiple disease-specific PROMs, often with overlapping content.
Successful implementation of PROMs in routine clinical practice requires a shift towards measuring generic PROs with generic PROMs as much as possible, only supplemented with disease-specific PROMs for outcomes that are really disease-specific such as disease-specific symptoms. Two research findings show that such a shift is possible. First, it has been shown that PROs that matter most to patients are common across conditions [Citation17–19]. Examples of commonly relevant outcomes are physical function, pain and participation. Second, it has been shown that generic PROMs developed within the modern framework of item response theory (IRT) [Citation20,Citation21], can have equal or even better responsiveness than traditional generic PROMs developed within the framework of classical test theory [Citation22–28], especially when they are used as a computerized adaptive test (CAT), where the computer selects relevant questions based on answers to previous questions [Citation29,Citation30].
The Patient-Reported Outcomes Measurement Information System (PROMIS®) initiative has developed IRT-based PROMs to measure commonly relevant outcomes such as physical function, pain, fatigue, sleep disturbances, anxiety, depression and the ability to participate in social roles and activities. These PROMs are applicable to adults and children with or without (chronic) diseases [Citation31–33]. PROMIS measures can be administered as fixed short forms or CAT. Evidence for sufficient psychometric properties across patient populations is growing [Citation34–40]. PROMIS measures have been translated into more than 60 languages and are increasingly used across countries [Citation41]. For example, Dutch-Flemish translations of PROMIS measures are available for more than 30 domains and have been validated in different populations [Citation42–52]. PROMIS has recently been recommended as the preferred measurement system for assessing commonly relevant PROs in Dutch daily medical specialty care across patient conditions [Citation53].
To support the use of PROMIS in daily clinical practice and research, reference values from the general population are useful. Most PROMIS measures were centered to have a mean of 50 and an SD of 10 in the US general population. However, the health of populations may be different in other countries so it is useful to assess to what extent references values are similar across countries. Therefore, we aimed to obtain general population-based Dutch reference values for five PROMIS domains: Physical Function, Pain Interference, Pain Behavior, Ability to Participate in Social Roles and Activities and Satisfaction with Social Roles and Activities and compare them with US reference values.
Patients and methods
Study participants
A data collection company (Desan Research Solutions) recruited three waves of at least 1000 people from the Dutch general population from an existing internet panel in 2016. The panel was provided by Global Market Insite (GMI). Informed consent to become a panelist was obtained by GMI. Panelists were recruited by an invitation from the panel host to participate. By voluntarily responding to the invitation for this survey, panelists provided informed consent to participate in the study. More details about the panel are provided by Elsman et al. [Citation54]. The study samples were selected to be representative of the Dutch general population with respect to age distribution (18–40; 40–65; >65), gender, educational level (low, middle, high), region of residence (north, east, south, west) and ethnicity (native Dutch, first- and second-generation western immigrant, first- and second-generation non-western immigrant).
Procedures
A web-based survey was used, in which skipping items was not allowed. Participants were asked to complete an online questionnaire once. In Wave 1 participants completed the full v1.2 PROMIS Physical Function item bank, in Wave 2 participants completed the full v1.1 PROMIS Pain Interference and v1.1 Pain Behavior item banks, and in Wave 3 participants completed the full v2.0 PROMIS Ability to Participate in Social Roles and Activities and Satisfaction with Social Roles and Activities item banks. Additionally, participants were asked to describe their level of health for each domain on a single item, described below. Afterwards, participants completed questions regarding sociodemographic characteristics (age, gender, education, region of residence and ethnicity). The Medical Ethical Committee of Amsterdam UMC, location VUmc, the Netherlands, confirmed that the study protocol was exempted from ethical approval according to the Dutch Medical Research in Human Subjects Act (WMO), as no experiments were conducted.
Measures
The PROMIS v1.2 Physical Function item bank contains 121 items, measuring the ability to perform activities including upper extremities (dexterity), lower extremities (walking or mobility) and central regions (neck, back), as well as the ability to perform instrumental activities of daily living, such as running errands. The PROMIS v1.1 Pain Interference item bank contains 40 items referring to the self-reported consequences of pain on relevant aspects of one’s life, including the extent to which pain hinders engagement with social, cognitive, emotional, physical and recreational activities. The PROMIS v1.1 Pain Behavior item bank contains 39 items referring to verbal or non-verbal and involuntary or deliberate self-reported external manifestations of pain: behaviors that typically indicate to others that an individual is experiencing pain. The PROMIS v2.0 Ability to Participate in Social Roles and Activities item bank contains 35 items measuring the perceived ability to perform one’s usual social roles and activities. The PROMIS v2.0 Satisfaction with Social Roles and Activities item bank contains 44 items measuring satisfaction with performing one’s usual social roles and activities. In the Physical Function, Pain Interference and both Participation item banks five response options are used. In the Pain Behavior item bank six response options are used (including the option ‘had no pain’). The Physical Function item bank and both Participation items banks have no time frame. The Pain item banks use the past 7 days as a time frame. All item banks are scored on a T-score metric, which has an average of 50 and standard deviation (SD) of 10 in the US general population. Higher scores indicate more of the construct being assessed. For example, higher Physical Function scores indicate better physical function, demonstrating good health, whereas higher Pain Interference scores indicate more pain interference, representing poor health.
Five single items were used to measure the overall level of the health domains, one item for each domain (physical function, pain interference, pain behavior, ability to participate in social roles and activities and satisfaction with social roles and activities). For example: ‘How would you describe your physical function?’. Response options for all five items were: no limitations, mild limitations, moderate limitations and severe limitations.
Statistical analyses
First, we compared the characteristics of the study participants to data from Statistics Netherlands in 2016 [Citation55] to check for a maximum allowable deviation of 2.5% per sociodemographic variable. Second, we compared our data to a US general population sample to ensure that T-scores of comparable Dutch and US populations can be compared unbiasedly. We used PROMIS wave 1 data, obtained from the HealthMeasures Dataverse repository [Citation56]. We only selected people from the general population (Physical Function n = 1700, Pain Interference n = 946, Pain Behavior n = 881, Ability to Participate in Social Roles and Activities n = 429, Satisfaction with Social Roles and Activities n = 424). In this DIF analysis, we examined whether Dutch and US people with the same level of domain have different probabilities of giving a certain response to an item [Citation57]. We performed Differential Item Functioning (DIF) analyses by comparing a series of ordinal logistic regression models, using the R package Lordif (version 0.3-3) [Citation58]. We used McFadden’s pseudo R2 change of 2% between the models as a criterion for DIF. Uniform DIF exists when the magnitude of the DIF is consistent across the entire range of the trait. Non-uniform DIF exists when the magnitude or direction of DIF differs across the trait. We checked the impact of DIF on total scores by examining test characteristic curves, displaying the difference between the groups when calculating a total raw score based on all items or on items flagged for DIF only.
Third, we calculated PROMIS T-scores per item bank from the raw item scores using the online HealthMeasures Scoring Service program, provided by the US Assessment Center [Citation59]. All participants, including people who reported ‘had no pain’ on the Pain Behavior item bank were included in the analyses. T-scores were calculated for the entire sample, as well as for subgroups based on age (18–34 years, 35–44 years, 45–54 years, 55–64 years, 65–74 years and ≥75 years), gender and self-reported level of the domain (anchor-based thresholds). We also calculated distribution-based thresholds for mild, moderate and severe T-scores based on 0.5 × SD, 1 × SD and 2 × SD below (for constructs indicating good health) or above (for constructs indicating poor health) the average of the general population, respectively. We compared the mean T-scores of the Dutch and US populations and the subgroups. For the Physical Function and Pain item banks, we used gender and age range sub-norms for adult PROMIS measures centered on the US General Census 2000, presented on the HealthMeasures website [Citation60]. For the Participation item banks, we calculated T-scores using the US PROMIS 1 Social Supplement, obtained from the HealthMeasures Dataverse repository [Citation56]. We selected only the participants from this Supplement who were recruited from the US general population (Polimetrix sample, n = 1008).
Results
Study participants
The three waves included 1310 (Physical Function), 1052 (Pain) and 1002 (Participation) participants, respectively. Characteristics of the participants are summarized and compared to the Dutch population in 2016 in . All differences were less than the 2.5% agreed upon.
Table 1. Sociodemographic characteristics of study participants and the Dutch general population.
Comparability of Dutch and US scores
Two items of the Physical Function item bank and two items of the Pain Behavior item bank were flagged for uniform DIF (). In both cases, for one item the Dutch population endorses higher item response categories at the same level of the domain than the US population, and for the other item, it was the other way round. The impact of DIF on the total scores was considered negligible. No DIF was found for the other item banks.
Table 2. Items with DIF and their McFadden’s pseudo R2 and IRT parameters.
Dutch PROMIS reference scores
Mean T-scores for the entire samples, and age and gender groups, for the five-item banks are presented in through . Mean T-scores in the Dutch general population were close to the mean T-scores in the US population of 50 for Physical Function (49.8) and Ability to Participate in Social Roles and Activities (50.6). However, the Dutch population showed lower levels of Satisfaction with Social Roles and Activities (47.5) and higher levels of Pain Interference (54.9) and Pain Behavior (52.0) than the US population.
Table 3. PROMIS Physical Function Dutch reference values by age and gender and compared with the US reference population [Citation61].
Table 4. PROMIS Pain Interference and Pain Behavior Dutch reference values by age and gender and compared with the US reference population [Citation61].
Table 5. PROMIS Ability to Participate in Social Roles and Activities and Satisfaction with Social Roles and Activities Dutch reference values by age and gender and compared with the US reference population [Citation61].
Men had slightly better Physical Function and Participation scores than women (about 2 T-score points and 1 T-score point, respectively), while differences in Pain between men and women were less than 1 point. Physical Function levels were worst in the highest age groups, while Pain and Participation levels were worst in the middle age groups (45–64 years).
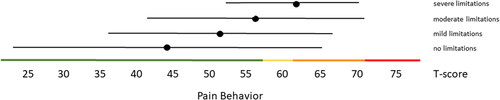
Distribution-based thresholds for mild, moderate and severe scores based on 0.5 × SD, 1.0 × SD and 2.0 × SD below (for constructs indicating good health) or above (for constructs indicating poor health) the average of the general population were found to be quite similar in the Dutch population as the suggested thresholds for the US population on the HealthMeasures website for Physical Function, Pain Behavior and both Participation item banks (). For Pain Interference the thresholds were a bit higher in the Dutch population compared to the recommended US values because of the higher mean Pain Interference T-score in the Dutch population. However, anchor-based thresholds, based on mean T-scores for people who self-reported mild, moderate and severe limitations did not coincide with the distribution-based thresholds (). Overall, people reported limitations ‘earlier’ (at lower severity levels) than the distribution-based cut-off values. For example, the mean T-scores for people who reported having mild symptoms/functional problems would be classified as within normal limits based on SD cut-off values for all domains, mean T-scores for people who reported having moderate symptoms/functional problems would be classified as mild problems based on SD cut-off values, and mean T-scores for people who reported to have severe symptoms/functional problems would be classified as moderate problems based on SD cut-off values. However, there was wide variation in T-scores within each self-reported limitations subgroup and there was wide overlap in T-score ranges between the subgroups.
Figure 1. Mean Physical Function T-scores (±1.96 × SD) for people with self-reported no, mild, moderate and severe limitations. Colored lines indicate the current recommended Dutch PROMIS distribution-based thresholds (green = within normal limits, yellow = mild, orange = moderate, red = severe functional limitations).
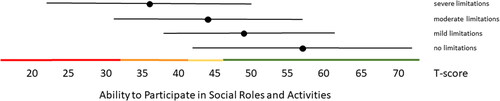
Figure 2. Mean Ability to Participate in Social Roles and Activities T-scores (±1.96 × SD) for people with self-reported no, mild, moderate and severe limitations. Colored lines indicate the current recommended Dutch PROMIS distribution-based thresholds (green = within normal limits, yellow = mild, orange = moderate, red = severe limitations in participation).
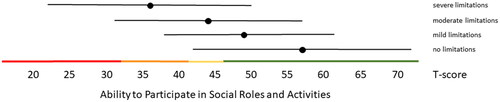
Figure 3. Mean Satisfaction with Participation in Social Roles and Activities T-scores (±1.96 × SD) for people with self-reported no, mild, moderate and severe limitations. Colored lines indicate the current recommended Dutch PROMIS distribution-based thresholds (green = within normal limits, yellow = mild, orange = moderate, red = severe limitations in participation).
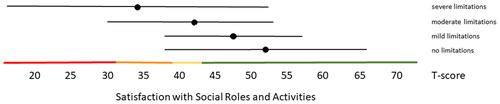
Figure 4. Mean Pain Interference T-scores (±1.96 × SD) for people with self-reported no, mild, moderate and severe limitations. Colored lines indicate the current recommended Dutch PROMIS distribution-based thresholds (green = within normal limits, yellow = mild, orange = moderate, red = severe symptoms).
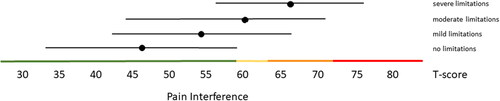
Figure 5. Mean Pain Behavior T-scores (±1.96 × SD) for people with self-reported no, mild, moderate and severe limitations. Colored lines indicate the current recommended Dutch PROMIS distribution-based thresholds (green = within normal limits, yellow = mild, orange = moderate, red = severe symptoms).
Discussion
This study assessed to what extent general population reference values for interpreting PROMIS T-scores were similar in the Netherlands as in the US. Mean T-scores in the Dutch general population were found to be close to the mean T-scores in the US population of 50 for Physical Function (49.8) and Ability to Participate in Social Roles and Activities (50.6). However, the average T-scores in the Dutch population were lower for Satisfaction with Social Roles and Activities (47.5) and higher for Pain Interference (54.9) and Pain Behavior (52.0). Distribution-based thresholds for mild, moderate and severe scores were comparable to the US recommended cut-off values for most item banks (except Pain Interference) but study participants reported limitations ‘earlier’ than these suggested distribution-based thresholds.
Only two items of the Physical Function item bank and two items of the Pain Behavior item bank were flagged for DIF, and the impact of DIF on T-scores was considered negligible, indicating that T-scores of comparable Dutch and US populations can be compared unbiasedly. These results are consistent with previous studies in clinical populations [Citation40,Citation44,Citation45,Citation62,Citation63].
Two other studies reported mean T-scores in general population samples from the UK, France, Germany and Norway [Citation64,Citation65]. In the UK, France and Germany slightly higher mean T-scores (about 51–53) were found for Physical Function as compared to the Netherlands (mean T-score 49.8) and lower mean T-scores were found for Pain Interference (about 49–51) as compared to the Netherlands (mean T-score 54.9). The study from Norway also reported a mean T-score of 55.0 for Pain Interference, but a lower score for the Ability to Participate (48.3) as compared to the Netherlands (50.6). However, the Norwegian sample was not representative of the Norwegian general population. These studies and our study suggest that it is useful to obtain country-specific reference values for using PROMIS across countries. However, variables, other than country, could also be responsible for the differences in T-scores found between countries. For example, the US values are based on data collected in 2000, and the (perception of) population health may have changed over time. An alternative to country-specific reference values could be to base reference values on a multi-national data set. However, it is questionable whether this is achievable and, more importantly, whether a ‘world average’ would be meaningful.
The self-reported limitations by the study participants suggest that thresholds based on SDs may not be a valid indicator of what patients consider mild, moderate, or severe problems. Anchor-based thresholds based on patients’ opinions are generally considered more valid that distribution-based thresholds [Citation66]. However, the self-reported limitations in this study were based on a single item only and given the wide variation in T-scores within each self-reported limitations subgroup and the wide overlap in T-score ranges between the subgroups, the validity of the self-reported limitations could be questioned. Previous studies have used a qualitative bookmarking methodology, which includes a ranking of clinical vignettes (i.e. descriptions of health states based on a selection of item responses) by patients or clinicians [Citation67]. Using this method, Bingham et al. found thresholds for Pain Interference of 52, 63 and 72 for mild, moderate and severe Pain Interference, respectively, in RA patients [Citation68]. Cella et al. found comparable thresholds of 50 for mild, 60 for moderate and 70 for severe Pain Interference in oncology patients [Citation69]. We found no studies using this method on the other item banks included in this study. More research is necessary to obtain reliable and valid cut-off values for what constitutes mild, moderate and severe scores from the patients’ perspective. For the time being, we recommend using the distribution-based thresholds, consistent with the HealthMeasures recommendations. However, since our data are representative of the Dutch general population, we recommend using the Dutch distribution-based thresholds, obtained in this study, in the Netherlands, unless or until there is sound evidence that this is inappropriate. However, clinicians and researchers should keep in mind that less severe scores may also be considered problematic by patients.
The PROMIS domains addressed in this study are part of the eight PROMIS profile domains, which are considered the most important outcomes across (clinical) populations [Citation70]. Dutch reference scores for the additional PROMIS profile domains Fatigue, Anxiety and Depression, as well as for the PROMIS Global Health Scale are published elsewhere or submitted for publication [Citation54,Citation71,Citation72] and analyses of Dutch reference scores for the Sleep item banks are ongoing.
A strength of this study was the use of large and representative study samples. As indicated above, a limitation of this study was the use of only single items to measure self-reported limitations. Another limitation was that the maximum allowable deviation of 2.5% per sociodemographic variable for comparing the characteristics of the study participants to data from Statistics Netherlands was chosen arbitrarily. We could not find any recommendations for an acceptable deviation from a reference population in the literature. Furthermore, the study was only performed in the Netherlands, while the PROMIS measures are also used in Flanders, the Dutch-speaking part of Belgium. One study investigated DIF for the two pain item banks between Dutch and Flemish RA patients, and found only one item with DIF, with negligible impact [Citation73]. Therefore the reference values obtained in our study may also be relevant for the Flemish population. However, future studies may be needed to investigate whether population levels of pain, function and participation are similar in the Netherlands and Flanders. A final potential limitation of the study was that the data was collected in 2016 and before the COVID-19 pandemic. Current population levels of pain, function and participation may be different. Ideally, reference values should be updated periodically (for example, the Public Health Monitor 2020 of the Dutch Community Health Services, Statistics Netherlands and the National Institute for Public Health and the Environment is updated every four years), but this is dependent upon funding.
Conclusion
This study showed that general population reference values for interpreting PROMIS T-scores were close to US reference values for some PROMIS domains but not all. We recommend obtaining country-specific reference values for using PROMIS across the world. We also recommend using Dutch distribution-based thresholds for mild, moderate and severe scores, but keep in mind that less severe scores may also be considered problematic by patients. More studies are needed to define thresholds based on patients’ opinions.
Author contributions
CB Terwee and LR Roorda designed the study and were responsible for the data collection. CB Terwee conducted the analyses. CB Terwee drafted the manuscript and LR Roorda contributed to the writing and finally approved the manuscript.
Acknowledgement
The authors thank Martine Crins for her help with collecting the data.
Disclosure statement
CB Terwee is past board member of the Dutch-Flemish PROMIS Organization. CB Terwee and LD Roorda are representatives of the Dutch-Flemish PROMIS National Center.
Data availability statement
The dataset is available upon request from the corresponding author.
Additional information
Funding
References
- Detmar SB, Muller MJ, Schornagel JH, et al. Health-related quality-of-life assessments and patient-physician communication: a randomized controlled trial. JAMA. 2002;288(23):3027–3034.
- Velikova G, Booth L, Smith AB, et al. Measuring quality of life in routine oncology practice improves communication and patient well-being: a randomized controlled trial. J Clin Oncol. 2004;22(4):714–724.
- MacDonald A, Houck J, Baumhauer JF. Role of patient-reported outcome measures on predicting outcome of bunion surgery. Foot Ankle Int. 2020;41(2):133–139.
- Cleeland CS, Wang XS, Shi Q, et al. Automated symptom alerts reduce postoperative symptom severity after cancer surgery: a randomized controlled clinical trial. J Clin Oncol. 2011;29(8):994–1000.
- Basch E, Deal AM, Dueck AC, et al. Overall survival results of a trial assessing patient-reported outcomes for symptom monitoring during routine cancer treatment. JAMA. 2017;318(2):197–198.
- Denis F, Basch E, Septans AL, et al. Two-year survival comparing web-based symptom monitoring vs routine surveillance following treatment for lung cancer. JAMA. 2019;321(3):306–307.
- Mody GN, Stover AM, Wang M, et al. Electronic patient-reported outcomes monitoring during lung cancer chemotherapy: a nested cohort within the PRO-TECT pragmatic trial (AFT-39). Lung Cancer. 2021;162:1–8.
- Graupner C, Kimman ML, Mul S, et al. Patient outcomes, patient experiences and process indicators associated with the routine use of patient-reported outcome measures (PROMs) in cancer care: a systematic review. Support Care Cancer. 2021;29(2):573–593.
- van Muilekom MM, Teela L, van Oers HA, et al. Patients’ and parents’ perspective on the implementation of patient reported outcome measures in pediatric clinical practice using the KLIK PROM portal. Qual Life Res. 2022;31(1):241–254.
- Pompili C, Boele F, Absolom K, et al. Patients’ views of routine quality of life assessment following a diagnosis of early-stage non-small cell lung cancer. Interact Cardiovasc Thorac Surg. 2020;31(3):324–330.
- Barbera L, Sutradhar R, Seow H, et al. Impact of standardized edmonton symptom assessment system use on emergency department visits and hospitalization: results of a population-based retrospective matched cohort analysis. J Clin Oncol Oncol Pract. 2020;16(9):e958–e965.
- Basch E, Wilfong L, Schrag D. Adding patient-reported outcomes to medicare’s oncology value-based payment model. JAMA. 2020;323(3):213–214.
- Engelen V, Detmar S, Koopman H, et al. Reporting health-related quality of life scores to physicians during routine follow-up visits of pediatric oncology patients: is it effective? Pediatr Blood Cancer. 2012;58(5):766–774.
- Greenhalgh J. The applications of PROs in clinical practice: what are they, do they work, and why? Qual Life Res. 2009;18(1):115–123.
- Stover AM, Haverman L, van Oers HA, et al. Using an implementation science approach to implement and evaluate patient-reported outcome measures (PROM) initiatives in routine care settings. Qual Life Res. 2021;30(11):3015–3033.
- Gensheimer SG, Wu AW, Snyder CF. Oh, the places we’ll go: patient-reported outcomes and electronic health records. Patient. 2018;11(6):591–598.
- Terwee CB, Zuidgeest M, Vonkeman HE, et al. Common patient-reported outcomes across ICHOM standard sets: the potential contribution of PROMIS®. BMC Med Inform Decis Mak. 2021;21(1):259.
- Ciani O, Salcher-Konrad M, Meregaglia M, et al. Patient-reported outcome measures in core outcome sets targeted overlapping domains but through different instruments. J Clin Epidemiol. 2021;136:26–36.
- Gangannagaripalli J, Albagli A, Myers SN, et al. A standard set of value-based patient-centered outcomes and measures of overall health in adults. Patient. 2022;15(3):341–351.
- Thomas ML. Advances in applications of item response theory to clinical assessment. Psychol Assess. 2019;31(12):1442–1455.
- Chang CH. Patient-reported outcomes measurement and management with innovative methodologies and technologies. Qual Life Res. 2007;16(1):157–166.
- Kosinski M, Bjorner JB, Ware JE, Jr., et al. The responsiveness of headache impact scales scored using ‘classical’ and ‘modern’ psychometric methods: a re-analysis of three clinical trials. Qual Life Res. 2003;12(8):903–912.
- Fitzpatrick R, Norquist JM, Jenkinson C, et al. A comparison of rasch with Likert scoring to discriminate between patients’ evaluations of total hip replacement surgery. Qual Life Res. 2004;13(2):331–338.
- Fries JF, Krishnan E, Rose M, et al. Improved responsiveness and reduced sample size requirements of PROMIS physical function scales with item response theory. Arthritis Res Ther. 2011;13(5):R147.
- Flens G, Terwee CB, Smits N, et al. Construct validity, responsiveness, and utility of change indicators of the Dutch-Flemish PROMIS item banks for depression and anxiety administered as computerized adaptive test (CAT): a comparison with the brief symptom inventory (BSI). Psychol Assess. 2022;34(1):58–69.
- Kroenke K, Stump TE, Chen CX, et al. Responsiveness of PROMIS and patient health questionnaire (PHQ) depression scales in three clinical trials. Health Qual Life Outcomes. 2021;19(1):41.
- Kenney RJ, Houck J, Giordano BD, et al. Do patient reported outcome measurement information system (PROMIS) scales demonstrate responsiveness as well as disease-specific scales in patients undergoing knee arthroscopy? Am J Sports Med. 2019;47(6):1396–1403.
- Chen CX, Kroenke K, Stump T, et al. Comparative responsiveness of the PROMIS pain interference short forms with legacy pain measures: results from three randomized clinical trials. J Pain. 2019;20(6):664–675.
- Smits N, Zitman FG, Cuijpers P, et al. A proof of principle for using adaptive testing in routine outcome monitoring: the efficiency of the mood and anxiety symptoms questionnaire - anhedonic depression CAT. BMC Med Res Methodol. 2012;12:4.
- Cella D, Gershon R, Lai JS, et al. The future of outcomes measurement: item banking, tailored short-forms, and computerized adaptive assessment. Qual Life Res. 2007;16(1):133–141.
- Cella D, Riley W, Stone A, et al. The patient-reported outcomes measurement information system (PROMIS) developed and tested its first wave of adult self-reported health outcome item banks: 2005-2008. J Clin Epidemiol. 2010;63(11):1179–1194.
- Cella D, Yount S, Rothrock N, et al. The patient-reported outcomes measurement information system (PROMIS): progress of an NIH roadmap cooperative group during its first two years. Med Care. 2007;45(5):S3–S11.
- http://www.healthmeasures.net/promis.
- Holden SK, Koljack CE, Prizer LP, et al. Measuring quality of life in palliative care for parkinson’s disease: a clinimetric comparison. Parkinsonism Relat Disord. 2019;65:172–177.
- Katz P, Pedro S, Michaud K. Performance of the patient-reported outcomes measurement information system 29-item profile in rheumatoid arthritis, osteoarthritis, fibromyalgia, and systemic lupus erythematosus. Arthritis Care Res. 2017;69(9):1312–1321.
- LaVela SL, Etingen B, Miskevics S, et al. Use of PROMIS-29® in US veterans: diagnostic concordance and domain comparisons with the general population. J Gen Intern Med. 2019;34(8):1452–1458.
- Rawang P, Janwantanakul P, Correia H, et al. Cross-cultural adaptation, reliability, and construct validity of the Thai version of the patient-reported outcomes measurement information system-29 in individuals with chronic low back pain. Qual Life Res. 2020;29(3):793–803.
- Rose AJ, Bayliss E, Huang W, et al. Evaluating the PROMIS-29 v2.0 for use among older adults with multiple chronic conditions. Qual Life Res. 2018;27(11):2935–2944.
- Tang E, Ekundayo O, Peipert JD, et al. Validation of the patient-reported outcomes measurement information system (PROMIS)-57 and -29 item short forms among kidney transplant recipients. Qual Life Res. 2019;28(3):815–827.
- Crins MHP, Terwee CB, Ogreden O, et al. Differential item functioning of the PROMIS physical function, pain interference, and pain behavior item banks across patients with different musculoskeletal disorders and persons from the general population. Qual Life Res. 2019;28(5):1231–1243.
- https://www.healthmeasures.net/explore-measurement-systems/promis/intro-to-promis/available-translations.
- Haverman L, Grootenhuis MA, Raat H, et al. Dutch-Flemish translation of nine pediatric item banks from the patient-reported outcomes measurement information system (PROMIS)(R). Qual Life Res. 2016;25(3):761–765.
- Terwee CB, Roorda LD, de Vet HC, et al. Dutch-Flemish translation of 17 item banks from the patient-reported outcomes measurement information system (PROMIS). Qual Life Res. 2014;23(6):1733–1741.
- Crins MH, Roorda LD, Smits N, et al. Calibration and validation of the Dutch-Flemish PROMIS pain interference item bank in patients with chronic pain. PLoS One. 2015;10(7):e0134094.
- Crins MHP, Terwee CB, Klausch T, et al. The Dutch-Flemish PROMIS physical function item bank exhibited strong psychometric properties in patients with chronic pain. J Clin Epidemiol. 2017;87:47–58.
- Flens G, Smits N, Terwee CB, et al. Development of a computer adaptive test for depression based on the Dutch-Flemish version of the PROMIS item bank. Eval Health Prof. 2017;40(1):79–105.
- Luijten MAJ, van Litsenburg RRL, Terwee CB, et al. Psychometric properties of the patient-reported outcomes measurement information system (PROMIS®) pediatric item bank peer relationships in the dutch general population. Qual Life Res. 2021;30(7):2061–2070.
- Oude Voshaar MA, ten Klooster PM, Glas CA, et al. Calibration of the PROMIS physical function item bank in dutch patients with rheumatoid arthritis. PLoS One. 2014;9(3):e92367.
- Pellicciari L, Chiarotto A, Giusti E, et al. Psychometric properties of the patient-reported outcomes measurement information system scale v1.2: global health (PROMIS-GH) in a Dutch general population. Health Qual Life Outcomes. 2021;19(1):226.
- van Balen EC, Haverman L, Hassan S, et al. Validation of PROMIS profile-29 in adults with hemophilia in the Netherlands. J Thromb Haemost. 2021;19(11):2687–2701.
- van der Meij E, Anema JR, Huirne JAF, et al. Using PROMIS for measuring recovery after abdominal surgery: a pilot study. BMC Health Serv Res. 2018;18(1):128.
- van Kooten J, Terwee CB, Luijten MAJ, et al. Psychometric properties of the patient-reported outcomes measurement information system (PROMIS) sleep disturbance and sleep-related impairment item banks in adolescents. J Sleep Res. 2021;30(2):e13029.
- Zorg PU. https://platformuitkomstgerichtezorg.nl.
- Elsman EBM, Roorda LD, Crins MHP, et al. Dutch reference values for the patient-reported outcomes measurement information system scale v1.2 - global health (PROMIS-GH). J Patient Rep Outcomes. 2021;5(1):38.
- www.cbs.nl.
- Devellis R. PROMIS 1 social supplement. 2016. Available from: https://dataverse.harvard.edu/dataverse.xhtml?alias=HealthMeasures.
- Hortensius L. Advanced measurement - logistic regression for DIF analysis. Minneapolis (MN): University of Minnesota; 2012.
- Choi SW, Gibbons LE, Crane PK. Lordif: an R package for detecting differential item functioning using iterative hybrid ordinal logistic regression/item response theory and Monte Carlo simulations. J Stat Softw. 2011;39(8):1–30.
- http://www.healthmeasures.net/score-and-interpret/interpret-scores/promis.
- https://www.healthmeasures.net/score-and-interpret/interpret-scores/promis/reference-populations.
- HealthMeasures. Gender and age range sub-norms for adult PROMIS measures centered on the US general census 2000 [cited 2020]. Available from: http://www.healthmeasures.net/score-and-interpret/interpret-scores/promis/reference-populations.
- Crins MH, Roorda LD, Smits N, et al. Calibration of the Dutch-Flemish PROMIS pain behavior item bank in patients with chronic pain. Eur J Pain. 2016;20(2):284–296.
- Terwee CB, Crins MHP, Boers M, et al. Validation of two PROMIS item banks for measuring social participation in the dutch general population. Qual Life Res. 2019;28(1):211–220.
- Fischer F, Gibbons C, Coste J, et al. Measurement invariance and general population reference values of the PROMIS profile 29 in the UK, France, and Germany. Qual Life Res. 2018;27(4):999–1014.
- Rimehaug SA, Kaat AJ, Nordvik JE, et al. Psychometric properties of the PROMIS-57 questionnaire, Norwegian version. Qual Life Res. 2022;31(1):269–280.
- Devji T, Carrasco-Labra A, Qasim A, et al. Evaluating the credibility of anchor based estimates of minimal important differences for patient reported outcomes: instrument development and reliability study. BMJ. 2020;369:m1714.
- Cook KF, Cella D, Reeve BB. PRO-Bookmarking to estimate clinical thresholds for patient-reported symptoms and function. Med Care. 2019;57(1):S13–S17.
- Bingham CO, Butanis AL, Orbai AM, et al. Patients and clinicians define symptom levels and meaningful change for PROMIS pain interference and fatigue in RA using bookmarking. Rheumatology. 2021;60(9):4306–4314.
- Cella D, Choi S, Garcia S, et al. Setting standards for severity of common symptoms in oncology using the PROMIS item banks and expert judgment. Qual Life Res. 2014;23(10):2651–2661.
- PROMIS domain framework.
- Elsman EBM, Flens G, de Beurs E, et al. Towards standardization of measuring anxiety and depression: differential item functioning for language and Dutch reference values of the PROMIS item. PLoS One. 2022;17(8):e0273287. doi: 10.1371/journal.pone.0273287
- Terwee CB, Elsman EBM, Roorda LD. Towards standardization of fatigue measurement: psychometric properties and reference values of the PROMIS Fatigue item bank in the Dutch general population. Res Methods Med Health Sciences 2022;3:86–98.
- Crins MHP, Terwee CB, Westhovens R, et al. First validation of the full PROMIS pain interference and pain behavior item banks in patients with rheumatoid arthritis. Arthritis Care Res. 2020;72(11):1550–1559.