
Abstract
Background
Myalgic Encephalomyelitis/Chronic Fatigue Syndrome (ME/CFS) and fibromyalgia have overlapping neurologic symptoms particularly disabling fatigue. This has given rise to the question whether they are distinct central nervous system (CNS) entities or is one an extension of the other.
Material and methods
To investigate this, we used unbiased quantitative mass spectrometry-based proteomics to examine the most proximal fluid to the brain, cerebrospinal fluid (CSF). This was to ascertain if the proteome profile of one was the same or different from the other. We examined two separate groups of ME/CFS, one with (n = 15) and one without (n = 15) fibromyalgia.
Results
We quantified a total of 2083 proteins using immunoaffinity depletion, tandem mass tag isobaric labelling and offline two-dimensional liquid chromatography coupled to tandem mass spectrometry, including 1789 that were quantified in all the CSF samples. ANOVA analysis did not yield any proteins with an adjusted p value <.05.
Conclusion
This supports the notion that ME/CFS and fibromyalgia as currently defined are not distinct entities.
ME/CFS and fibromyalgia as currently defined are not distinct entities.
Unbiased quantitative mass spectrometry-based proteomics can be used to discover cerebrospinal fluid proteins that are biomarkers for a condition such as we are studying.
Key message
Introduction
Myalgic encephalomyelitis/chronic fatigue syndrome (ME/CFS) is an illness characterized by disabling fatigue, and fibromyalgia (FM) an illness characterized by body-wide pain. These two medically unexplained illnesses often exist together. This overlap has led some to consider the two illnesses to be part of the same illness spectrum [Citation1].
In contrast to this position, our own past data and studies from others found differences between the two illnesses [Citation2,Citation3]. That raised the possibility of different pathophysiological processes. These contrasting views compelled us to consider a study with newer unbiased technology.
Because our studies were subsumed under the auspices of an NIH-funded CFS Cooperative Research Center, we studied patients with ME/CFS only or with ME/CFS + FM.
We have viewed determining which of these hypotheses (same or distinct) is most likely as a testable research question with clinical impact. The question itself is clinically important. The existence of different pathophysiological processes will mean different paths to treatment. To investigate whether the two illnesses are the same or different, we used an approach that had helped us in an earlier study deconvolute the conundrum of whether ME/CFS was distinct from persistent neurologic Lyme disease syndrome (nPTLS) – i.e. mass spectrometry (MS)-based proteomics. Use of this technology has become the method of choice and discovery tool, to rapidly uncover protein biomarkers that can distinguish one disease from another [Citation4–6]. The major features of both ME/CFS and nPTLS, just like ME/CFS and FM, are neurologic. We used MS-based proteomics to compare the cerebrospinal fluid (CSF) proteomes of both ME/CFS and nPTLS and were able to demonstrate that both were neurologic entities and distinct from one another and normals. We used the same approach here to compare ME/CFS with and without FM.
Material and methods
Clinical specimens for this study
A total of 15 and 15 subjects were included in the CFS-only and CFS + FM groups, respectively. They were diagnosed as reported [Citation7]. Thus all subjects fulfilled the 1994 case criteria for CFS [Citation8] as modified by BHN to include severity: Patients had to report at least a substantial reduction in activity across a number of life spheres where substantial was ‘3’ of a 0 to five Likert scale (0 none; 1 mild; 2 moderate; 3 substantial; 4 severe and 5 very severe). The same Likert scale was used to assess symptom severity. So, in the month prior to intake, subjects had to report at least a substantial problem with three of the following symptoms plus at least a moderate problem on a fourth of the following list: sore throat, tender lymph nodes; headache; myalgia; arthralgia; unrefreshing sleep; problems with attention and/or concentration; and the complaint that minimal effort – physical or emotional – produces a dramatic worsening of symptoms – known as post-exertional malaise. All subjects tested negative on a set of rule out bloods used to identify medical causes of fatigue including anaemia, liver dysfunction, thyroid problems or possible autoimmune diseases. Subjects were also evaluated to determine if they fulfilled criteria for the 1990 case definition for fibromyalgia. Thus subjects given the co-morbid diagnosis of fibromyalgia had to report four quadrant pain and have at least 11 of 18 tender points on palpitation using 4 kg of force at each point [Citation9].
Ages were similar at 41.3 ± 9.4 SD and 40.1 ± 11.0, respectively. There were no differences in gender or rates of current comorbid psychiatric diagnosis between the groups. Samples were immediately aliquoted, frozen and stored at −80 °C. Samples had been banked from previous IRB approved studies at the Icahn School of Medicine at Mount Sinai, and were provided in a de-identified fashion.
Proteomic sample preparation
A 2.0-mL CSF aliquot of each sample was first concentrated with a Millipore Amicon Ultra-2 3000 MWCO filter (Fisher Scientific) to a final volume of 100 μL. The concentrated samples were then individually immunoaffinity depleted using an Agilent MARS Hu-14 column (4.6 × 50 mm), and the flow-through proteins were collected. The depleted CSF samples were concentrated and buffer exchanged into 50 mM N-2-hydroxyethylpiperazine-N-2-ethane sulphonic acid (HEPES), pH 8 (final volume was 100 μL). Trifluoroethanol (TFE) was added to each sample to reach a final concentration of 50% (v/v), and the samples were incubated at 99 °C for 90 min with shaking. Proteins were reduced with 5 mM dithiothreitol for 1 h at 37 °C, then diluted 1:5 with nanopure water for digested with trypsin (Promega) at 1:50 enzyme‐to‐substrate ratio (37 °C for 3 h). The digested samples were acidified with 10% formic acid (FA) to reach a final concentration of 1%, and dried using a Speed-Vac concentrator.
The resulting peptides were labelled with 11-plex tandem mass tag (TMT) reagents (ThermoFisher Scientific) using conditions modified from the manufacturer’s instructions. Peptides (10 µg) from each of the CSF samples were dissolved in 5 μL of 200 mM HEPES, pH 8.5 solution, and mixed with 20 µg of TMT reagent that was dissolved in acetonitrile (ACN). Channel 131 C was used for labelling the internal reference sample (pooled from all 30 CSF samples) in each of the three TMT-11 plexes (the full TMT labelling scheme is provided in Table S1). After 1 h incubation at RT, each sample was diluted 2.5 µg/µL concentration with 200 mM HEPES, pH 8.5 in 20% ACN. The labelling reactions were stopped by adding 5% hydroxylamine (final concentration is 0.5%) for 15 min and then acidified with TFA (final concentration is 0.5%). Peptides labelled by different TMT reagents were then mixed and desalted by Sep-Pac C18 (Waters).
Approximately 45 μg of 11-plex TMT labelled sample was fractionated using high-pressure, high-resolution separations coupled with intelligent selection and multiplexing (PRISM) [Citation10]. A nanoACQUITY UPLC system (Waters) equipped with a reversed-phase capillary LC column (30-µm Jupiter C18 bonded particles packed in 200 µm i.d. × 50 cm capillary) was used. Separations were performed by reversed-phase LC fractionation at mobile phase flow rates of 2.2 µL/min on the binary pump systems using 10 mM ammonium formate (pH 7) in water as mobile phase A and 10 mM ammonium formate (pH 7) in 90% ACN as mobile phase B. 45 µL of sample with a peptide concentration of 1 µg/µL was loaded onto the reversed-phase capillary column and separated into 96 fractions using a 190-min gradient of (min:%B): 35:1, 37:10, 52:15, 87:25, 112:35, 125:45, 150:90, 156:1. The eluent was automatically deposited every minute and concatenated into 24 fractions by combining 4 fractions that are 24 fractions apart (i.e. combining fractions #1, #25, #49, and #73; #2, #26, #50, and #74; and so on). Prior to peptide fraction collection, 20 µL of 0.1% FA was added to each well of the 96-well plate to avoid the loss of peptides. All the elute were then dried under vacuum and re-suspended in 2% ACN, 0.1% FA to a peptide concentration of 0.1 µg/µL for LC-MS/MS analysis.
Liquid chromatography coupled to tandem mass spectrometry (LC-MS/MS) analysis
Fractionated peptide samples were separated using a nanoACQUITY UPLC system (Waters) by reversed-phase LC. The analytical column was manufactured in-house using ReproSil-Pur 120 C18-AQ 1.9 µm stationary phase (Dr. Maisch GmbH) and slurry packed into a 25-cm length of 360 µm o.d. x 75 µm i.d. fused silica picofrit capillary tubing (New Objective). The analytical column was heated to 50 °C using an AgileSLEEVE column heater (Analytical Sales and Services). The analytical column was equilibrated to 98% Mobile Phase A (MP A, 0.1% formic acid/3% acetonitrile) and 2% Mobile Phase B (MP B, 0.1% formic acid/90% acetonitrile) and maintained at a constant column flow of 200 nL/min. The sample was injected into a 5-µL loop placed in-line with the analytical column which initiated the gradient profiles (min:%MP B): 0:2, 1:6, 85:30, 94:60, 95:90, 100:90, 101:50, 110:50. The column was allowed to equilibrate at start conditions for 30 min between analytical runs.
MS analysis was performed using an Orbitrap Fusion Lumos Tribrid Mass Spectrometer (ThermoFisher Scientific). All samples were analysed under identical conditions. Peptides were ionized by applying a voltage of 1800 V. Data were acquired in a data-dependent acquisition mode and the peptides were isolated using a quadrupole system (the isolation window was 0.7). Fractionated ions with a mass range 350–1800 m/z were scanned at 60,000 resolutions with 50 ms ion injection time (IT) and an 100% automatic gain control (AGC) target (4E5). Precursor ions with intensities > 1E4 were selected for fragmentation by higher-energy collisional dissociation (HCD) at 30% collision energy. The fragment ions were detected by the Orbitrap (resolution 50,000). The AGC target for MS/MS was 1E5 with a maximum injection time of 105 ms. Peptide mode was selected for monoisotopic precursor scan and charge state screening was enabled to reject unassigned 1+ ions with a dynamic exclusion time of 45 s to discriminate against previously analysed ions between ± 10 ppm.
Data processing and statistical analysis
The LC-MS/MS data were processed using MSGF + for identification of the peptides/proteins with a stringent cut of 1% FDR at both peptide and protein levels [Citation11,Citation12], resulting in a total of 2083 protein identifications. The TMT reporter ion intensity were extract using MASIC and used for protein quantification. The sample-to-reference ratios in each TMT experiment were log2 transformed, corrected for loading differences using medium centring, and batch corrected using the limma package (ComBat) in R, reducing the number of quantified proteins to 1789 (Table S2). All statistical analyses, including ANOVA, unsupervised hierarchical clustering, and Random Forest analysis, were also performed in R using corresponding R packages.
Results
Beginning with an unbiased proteomic approach where one does not need to know in advance what proteins may be in the sample, we performed comprehensive, quantitative proteomics using immunoaffinity depletion, TMT-11 isobaric labelling, and offline two-dimensional LC-MS/MS analysis.
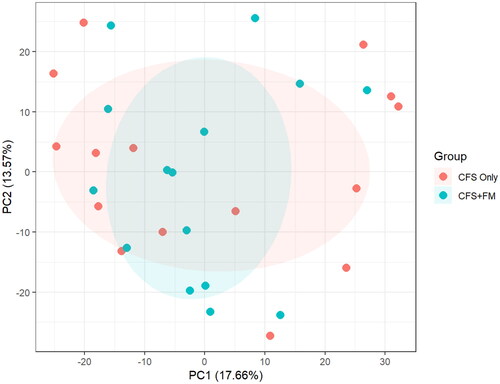
PCA analysis of 1789 proteins were quantified in all 15 ME/CFS-only (note labelled as CFS only in ) and 15 ME/CFS + FM (labelled CFS + FM in ) CSF samples. ANOVA analysis revealed a total of 14 proteins with p value <.05; however, none of these proteins has an adjusted p value <.05. Thus, there is no clear separation of the two groups using their entire CSF proteome profiles.
Figure 1. PCA analysis of 1789 proteins quantified in all 15 CFS-only and 15 CFS + FM CSF samples. ANOVA analysis revealed a total of 14 proteins with p value <.05; however, none of these proteins has an adjusted p value <.05. There is no clear separation of the two groups using their entire CSF proteome profiles.
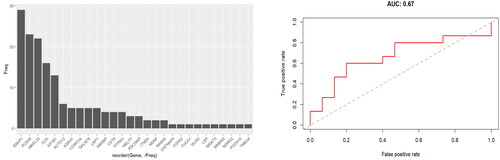
Random Forest machine learning approach was then used to classify between the two groups based on relative protein abundance changes. Prediction accuracy was estimated using leave- one-out cross-validation (LOOCV). This did not distinguish the two groups either (). The selection frequency for the differential proteins being selected into the Random Forest classifiers for separating the two groups is shown in the left panel (only 4 of 29 proteins were selected in 50% of the models), and the AUC composed from all LOOCV predictions was a modest 0.67 (right panel).
Figure 2. Random forest classifier cross-validation. A random forest machine learning approach was used to classify between the two groups based on relative protein abundance changes. Prediction accuracy was estimated using LOOCV. The selection frequency for the differential proteins being selected into the Random Forest classifiers for separating the two groups is shown in the left panel (only 4 of 29 proteins were selected in 50% of the models), and the AUC composed from all LOOCV predictions was 0.67 (right panel).
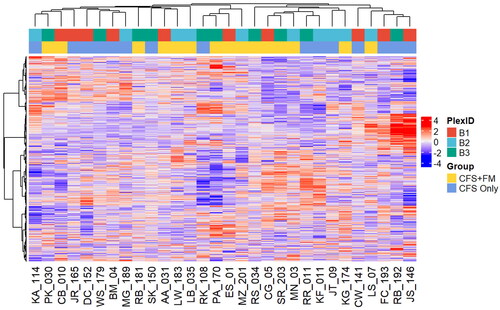
Lastly, we employed unsupervised hierarchical clustering analysis, and there is no clear separation of the two groups using their entire CSF proteome profiles ().
Figure 3. Unsupervised hierarchical clustering of the entire CSF proteome. There is no clear separation of the two groups using their entire CSF proteome profiles. The TMT-11 plex from which the individual samples were analysed is also shown as a reference.
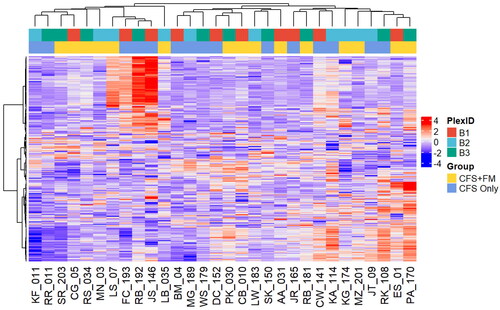
Unsupervised hierarchical clustering of the top 20% most variable proteins in CSF proteome did not lead to clear separation of the two groups either ().
Figure 4. Unsupervised hierarchical clustering of the top 20% most variable CSF proteome. There is no clear separation of the two groups. The TMT-11 plex from which the individual samples were analysed is also shown as a reference.
The sum of these results do not support the hypothesis that ME/CFS and ME/CFS with fibromyalgia are distinct entities. Even with comprehensive proteome coverage enabled by immunoaffinity depletion and fractionation and precise quantification provided by isobaric labelling via TMT (i.e. (∼1800 proteins quantified across an cohort of 30 CSF samples with CV < 20%, which is equivalent to or better than those reported in the literature), no distinguishing CSF proteins could be found between patients with ME/CFS and those with both ME/CFS + FM.
Discussion
CFS, now known as ME/CFS, and FM are medically unexplained illnesses, predominantly of women, characterized by disabling fatigue and by widespread pain with tenderness, respectively. The prevalence of ME/CFS is a tenth that of FM (0.3% [Citation13] vs 3% [Citation9]) because, in contrast to FM which has no exclusions, ME/CFS is not diagnosed in the face of any disease process that could produce fatigue. However, the core symptoms of pain, fatigue, sleep problems and cognitive difficulties exist across both syndromes and lead to significant co- morbidity between them. The fact that these two syndromes co-exist so often has led some to question whether they are, in fact, distinct diagnostic entities. Wessely et al. [Citation1]. suggested that the ‘similarities between them outweigh the differences’ – a position taken by other researchers [Citation14].
Although overlap between the occurrence of CFS and FM exists, there are differences between the illnesses. For example, substance P is increased in the spinal fluid of FM patients [Citation15] but not in the spinal fluid of CFS patients [Citation16]. In addition to this study, we have reviewed the work of others in which immunological, physiological and genetic differences have been reported between the two syndromes [Citation17]; moreover, many of our own studies also show differences between the two illnesses – supporting the position that the illnesses are different, produced by different pathophysiological processes.
Because our studies were subsumed under the auspices of an NIH-funded CFS Cooperative Research Center, we studied patients with CFS only or with CFS + FM and did not have the opportunity to study those with FM only. The studies revealed: (1) Those in the CFS only but not the CFS + FM group showed neuropsychological dysfunction and an elevated brain serotonergic response to tryptophan infusion relative to controls [Citation18,Citation19]. (2) Those with CFS + FM did not but CFS only showed an altered physiological response to a standardized sub-maximal exercise test through reduced blood pressure and an increased stroke index. (3) Concerning post-traumatic stress disorder, CFS only patients had community rates of having this diagnosis on diagnostic psychiatric interview – i.e. 1.5%, while those with CFS + FM were substantially and significantly higher − 8.5% (Natelson, unpublished data). Another group also reported this [Citation2]. (4) Approximately twice as many CFS only patients developed their illness following a sudden, influenza-like onset compared to those with CFS + FM [Citation20]. (5) Next, our group has identified a series of patients diagnosed with obstructive sleep apnoea based on data recorded during overnight polysomnography [Citation21]. Fourteen percent of these patients had CFS only, four percent fulfilled case criteria for the diagnosis of CFS + FM (4%); in contrast, none of these patients had FM only. These findings indicate discordance in rates of CFS and FM; compared to substantially higher rates for CFS (compare 14% to 0.3% in community samples [Citation13], rates of FM only were not different from those found in community samples [Citation22] (∼4% in both [Citation9]). Another difference in the two groups was found in sleep architecture using our newer approach that determined the probability for transitioning among the various sleep phases [Citation23]. This review suggests that CFS only and CFS + FM are categorically different and not just the same disorder that differs in severity.
As noted by Hauser, FM is rarely a stand-alone condition. A revision of the original 1990 case definition for FM published in 2010 [Citation24] has reduced the difference between the two illnesses with nearly twice as many ME/CFS patients also receiving the diagnosis of FM than when the 1990 case definition is used [Citation25]. Blurring the difference between the two syndromes left open the research question of whether the two illnesses are spectrum variants of one another or are due to distinct different pathophysiological processes which this current study examined.
The quantitative proteomics approach we used examining the CSF as a reflection of the CNS- related major symptoms did not support the hypothesis that the two conditions studied – ME/CFS with and without fibromyalgia – were separable. Thus, there do not appear to be discrete CSF proteins for ME/CFS which allow that group of patients to be clearly differentiated from those for ME/CFS + FM. Thus, this proteomic study did not support the hypothesis that ME/CFS has a different underlying pathophysiology from CFS + FM in the CNS.
We and others have had success in distinguishing one disease from another beginning with the first step: an unbiased discovery using MS-based proteomics that employs immunoaffinity depletion of common abundant proteins that could otherwise mask the less abundant proteins that have higher biomarker potential [Citation7,Citation15], followed by isobaric labelling of the resulting low abundance proteins in each individual sample. In the current study the same methods that potentially could have distinguished one disease from another, did not demonstrate a pathophysiologic distinction between ME/CFS and ME/CFS + FM. Although we did not have the benefit of the rare resource of CSF from ‘pure’ FM group, we expected differences to show up by skewing from the ME/CFS + FM group. As shown in no statistically significant differences were found. This basic science analysis comparing the two illness processes suggests that the two may share a similar pathophysiological basis. If that conclusion is supported by other research including a set of FM only patients (should that become available), this would support the notion that the two illnesses fall along a common illness spectrum and may be approached as a single entity – with implications for both diagnosis and the development of new treatment approaches.
Author contributions
SES, TL, BHN, RDS, JB contributed to the conception and design of the study; SES, TL, CT, VAP, AAS, YW, KKW, RDS, BHN contributed to the acquisition and analysis of data; SES, TL, CT, VAP, BHN contributed to drafting the text or preparing the figures.
Supplemental Material
Download PDF (27.6 KB)Supplemental Material
Download MS Excel (447.2 KB)Disclosure statement
No potential conflict of interest was reported by the author(s).
Data availability statement
The raw MS data have been deposited to MassIVE (accession: MSV000090685) and PRIDE (accession: PXD038078). The access link is https://massive.ucsd.edu/ProteoSAFe/dataset.jsp?task=457b0ce78fdc460b9f36d59dcce15572. The username for web access: MSV000090685_reviewer, and the access key is CSF3429. A preprint precursor version of this study was published at BioRxiv: https://www.biorxiv.org/content/10.1101/2022.09.14.506792v2.
Additional information
Funding
References
- Wessely S, Nimnuan C, Sharpe M. Functional somatic syndromes: one or many? Lancet. 1999;354(9182):1–7.
- Cook DB, Stegner AJ, Nagelkirk PR, et al. Responses to exercise differ for chronic fatigue syndrome patients with fibromyalgia. Med Sci Sports Exerc. 2012;44(6):1186–1193.
- Kishi A, Natelson BH, Togo F, et al. Sleep-stage dynamics in patients with chronic fatigue syndrome with or without fibromyalgia. Sleep. 2011;34(11):1551–1560.
- Schutzer SE. Rapidly maturing field of proteomics: a gateway to studying diseases. Proteomics. 2014;14(9):991–993.
- Smith RD. Mass spectrometry in biomarker applications: from untargeted discovery to targeted verification, and implications for platform convergence and clinical application. Clin Chem. 2012;58(3):528–530.
- Carr SA, Abbatiello SE, Ackermann BL, et al. Targeted peptide measurements in biology and medicine: best practices for mass spectrometry-based assay development using a fit-for-purpose approach. Mol Cell Proteomics. 2014;13(3):907–917.
- Schutzer SE, Angel TE, Liu T, et al. Distinct cerebrospinal fluid proteomes differentiate post-treatment lyme disease from chronic fatigue syndrome. PLoS One. 2011;6(2):e17287.
- Fukuda K, Straus SE, Hickie I, et al. The chronic fatigue syndrome: a comprehensive approach to its definition and study. Ann Intern Med. 1994;121(12):953–959.
- Wolfe F, Smythe HA, Yunus MB, et al. The American College of Rheumatology 1990 criteria for the classification of fibromyalgia: report of the multicenter criteria committee. Arthritis Rheum. 1990;33(2):160–172.
- Shi T, Fillmore TL, Sun X, et al. Antibody-free, targeted mass-spectrometric approach for quantification of proteins at low picogram per milliliter levels in human plasma/serum. Proc Natl Acad Sci U S A. 2012;109(38):15395–15400.
- Qian WJ, Liu T, Monroe ME, et al. Probability-based evaluation of peptide and protein identifications from tandem mass spectrometry and SEQUEST analysis: the human proteome. J Proteome Res. 2005;4(1):53–62.
- Elias JE, Gygi SP. Target-decoy search strategy for increased confidence in large-scale protein identifications by mass spectrometry. Nat Methods. 2007;4(3):207–214.
- Jason LA, Richman JA, Rademaker AW, et al. A community-based study of chronic fatigue syndrome. Arch Intern Med. 1999;159(18):2129–2137.
- Barsky AJ, Borus JF. Functional somatic syndromes. Ann Intern Med. 1999;130(11):910–921.
- Russell IJ, Orr MD, Littman B, et al. Elevated cerebrospinal fluid levels of substance P in patients with the fibromyalgia syndrome. Arthritis Rheum. 1994;37(11):1593–1601.
- Evengård B, Nilsson CG, Lindh G, et al. Chronic fatigue syndrome differs from fibromyalgia. No evidence for elevated substance P levels in cerebrospinal fluid of patients with chronic fatigue syndrome. Pain. 1998;78(2):153–155.
- Abbi B, Natelson BH. Is chronic fatigue syndrome the same illness as fibromyalgia: evaluating the ‘single syndrome’ hypothesis. QJM. 2013;106(1):3–9.
- Cook DB, Nagelkirk PR, Peckerman A, et al. Exercise and cognitive performance in chronic fatigue syndrome. Med Sci Sports Exerc. 2005;37(9):1460–1467.
- Weaver SA, Janal MN, Aktan N, et al. Sex differences in plasma prolactin response to tryptophan in chronic fatigue syndrome patients with and without comorbid fibromyalgia. JWomens Health. 2010;3:6–11.
- Ciccone DS, Natelson BH. Comorbid illness in the chronic fatigue syndrome: a test of the single syndrome hypothesis. PsychosomMed. 2003;62:268–275.
- Pejovic S, Natelson BH, Basta M, et al. Chronic fatigue syndrome and fibromyalgia in diagnosed sleep disorders: a further test of the ‘unitary’ hypothesis. BMC Neurol. 2015;15:53.
- White KP, Speechley M, Harth M, et al. The London Fibromyalgia Epidemiology Study: the prevalence of fibromyalgia syndrome in London, Ontario. J Rheumatol. 1999;26:1570–1576.
- Kishi A, Struzik ZR, Natelson BH, et al. Dynamics of sleep stage transitions in healthy humans and patients with chronic fatigue syndrome. Am J Physiol Regul Integr Comp Physiol. 2008;294(6):R1980–R1987.
- Wolfe F, Clauw DJ, Fitzcharles MA, et al. The American College of Rheumatology preliminary diagnostic criteria for fibromyalgia and measurement of symptom severity. Arthritis Care Res. 2010;62(5):600–610.
- Kaseeska K, Brown M, Jason LA. Comparing two fibromyalgia diagnostic criteria in a cohort of chronic fatigue syndrome patients. BullIACFS/ME. 2011;19:47–57.