
Abstract
Background
In colorectal cancer (CRC), both tumor invasion and immunological analysis at the tumor invasive margin (IM) are significantly associated with patient prognosis, but have traditionally been reported independently. We propose a new scoring system, the TGP-I score, to assess the association and interactions between tumor growth pattern (TGP) and tumor infiltrating lymphocytes at the IM and to predict its prognostic validity for CRC patient stratification.
Materials and Methods
The types of TGP were assessed in hematoxylin and eosin-stained whole-slide images. The CD3+ T-cells density at the IM was automatically quantified on immunohistochemical-stained slides using a deep learning method. A discovery (N = 347) and a validation (N = 132) cohorts were used to evaluate the prognostic value of the TGP-I score for overall survival.
Results
The TGP-I score3 (trichotomy) was an independent prognostic factor, with higher TGP-I score3 associated with worse prognosis in the discovery (unadjusted hazard ratio [HR] for high vs. low 3.62, 95% confidence interval [CI] 2.22–5.90; p < 0.001) and validation cohort (unadjusted HR for high vs. low 5.79, 95% CI 1.84–18.20; p = 0.003). The relative contribution of each parameter to predicting survival was analyzed. The TGP-I score3 had similar importance compared to tumor-node-metastasis staging (31.2% vs. 32.9%) and was stronger than other clinical parameters.
Conclusions
This automated workflow and the proposed TGP-I score could further provide accurate prognostic stratification and have potential value for supporting the clinical decision-making of stage I–III CRC patients.
A new scoring system, the TGP-I score, was proposed to assess the association and interactions of TGP and TILs at the tumor invasive margin.
TGP-I score could be an independent predictor of prognosis for CRC patients, with higher scores being associated with worse survival.
TGP-I score had similar importance compared to tumor-node-metastasis staging and was stronger than other clinical parameters.
Key messages
Introduction
In colorectal cancer (CRC), the close interactions between the developing tumor and the host immune system play a crucial role in controlling tumor proliferation and progression [Citation1]. The tumor invasive margin (IM) is regarded as the region that manifests tumor aggressiveness, forming at the junction of malignant nests and normal tissue [Citation2]. Infiltrative growth of the tumor at the IM led to a blurring of the tumor-normal tissue boundary, which has been associated with poor survival outcomes for CRC patients [Citation3]. However, tumor growth and aggression would trigger corresponding host anti-tumor immune responses, forming an immune barrier to block tumor invasion [Citation4]. Several studies have shown that, in general, primary tumors are densely infiltrated by various subsets of T cells [Citation5,Citation6]. Specifically, the existence of high-density T cells in primary tumors was correlated with a better prognosis for CRC patients compared to low-density [Citation7]. Thus, simultaneous consideration of the correlation and interactions between tumor infiltration and anti-tumor immune response at the IM may contribute to accurate prognostic stratification for CRC patients and aid clinical decision-making.
Tumor growth pattern (TGP) is a histomorphological feature used to describe the status of tumor infiltration at the invasive front, first proposed by Jass et al. [Citation8]. It has been demonstrated that evaluating the tumor border configuration may be a useful complement to the tumor-node-metastasis (TNM) classification by offering stage-independent prognostic information [Citation9]. Morikawa and colleagues indicated that the infiltrative growth pattern as an independent prognostic indicator of patient survival had a poor prognosis [Citation10]. Furthermore, the types of TGP can be simply and quickly assessed by pathologists at low magnification, making it ideal for implementation in routine diagnosis [Citation11]. Both TGP and TNM staging focus exclusively on the tumor, but it is now clear that the host interactions within the tumor microenvironment, particularly immune infiltration, are essential for tumor aggression [Citation12]. During the last two decades, after a thorough investigation of immune infiltration, the Immunoscore was developed [Citation13]. The Immunoscore, a prognostic marker based on the CD3+ and CD8+ tumor-infiltrating lymphocyte (TIL) density in specific regions (e.g. tumor center and IM), has superior predictive value for CRC patients over the traditional TNM system [Citation14]. Previous clinical studies have shown that the presence and quantification of CD3 and CD8 TILs were significantly correlated with disease-specific and overall survival (OS) in colorectal cancer [Citation15]. In particular, Reichling et al. have stated that CD3+ T-cells have a prognostic value comparable to the classical CD3 & CD8-based Immunescore [Citation16].
Whole-slide images (WSIs) provide an enabling platform for quantifying the spatial relationships of various biological phenotypes [Citation17]. The combination of artificial intelligence (AI) and WSIs allows for effective tissue segmentation, making it possible to fully auto-quantify the density of immune-infiltrating lymphocytes (CD3+ T-cells) at the margins of tumor infiltration in WSIs, providing a more objective and accurate quantification [Citation18]. Therefore, an AI-assisted analysis was conducted to quantify tumor-infiltrating lymphocytes and assess their interactions with tumor growth patterns using consecutive sections stained with hematoxylin and eosin (HE) and immunohistochemistry (IHC). The TGP-I score was further proposed and its prognostic value was validated in two cohorts of CRC patients.
Materials and methods
Patient cohort
In this retrospective study, CRC patients from two centers were enrolled. From June 2008 to May 2015, patients diagnosed with CRC from the Guangdong Provincial People’s Hospital (GDPH) were included in the discovery cohort; patients diagnosed with rectum cancer from January 2013 to April 2015 at The Sixth Affiliated Hospital of Sun Yat-sen University (SYSU6) were included in the validation cohort. This analysis was approved by the Research Ethics Committees of both hospitals and informed consent was waived. Inclusion criteria were histologically proven stage I–III CRC patients treated by surgery with the goal of curing the disease. By the way, paraffin-embedded tissue blocks containing the IM were also collected. Samples were excluded if the HE/IHC-strained WSIs were of poor quality (image quality control) or if the patients underwent neoadjuvant therapy or death within 30 days after surgery (clinical quality control). Data on the clinicopathological features, such as age, sex, TNM classification, tumor location (colon/rectum), carcinoembryonic antigen (CEA, normal = 0–5 ng/mL, abnormal >5 ng/mL), tumor grade, microsatellite instability (MSI) status, molecular characteristics (including KRAS, BRAF, EGFR), and therapeutic approaches, were collected from medical records. Microsatellite instability (MSI) is a genomic phenotype caused by the deficiency of the mismatch repair (MMR) system, mainly resulting from a germline mutation in MMR genes (MLH1, MSH2, MSH6, and PMS2). IHC was performed to assess the expression of four mismatch repair proteins, and patients with deficient mismatch repair and proficient mismatch repair were indicated as MSI and microsatellite stability (MSS), respectively, in accordance with previous studies [Citation14]. The endpoint of interest was OS and recurrence-free survival (RFS). OS refers to the time from surgery to death for any cause. RFS is defined as the time from the date of surgery to the date of the first evidence of recurrence (e.g. local or distant metastasis) or death from any cause, whichever comes first.
Acquisition of HE/IHC-stained WSIs
Pathologists who were unaware of the patient’s clinical information and outcomes examined and chose the most invasive parts of the tumor. The tissue specimen of each patient was formalin-fixed, paraffin-embedded, and then cut into 4–5 μm sections. The two consecutive sections were selected and stained with hematoxylin and eosin and immunohistochemistry to obtain HE- and IHC-stained slices. Then, the IHC-stained sections were performed with anti-CD3. Full details about the IHC staining could be found in our prior work [Citation19]. These HE/IHC-stained slides were all scanned using digital whole-slide scanning (Aperio AT2 or GT450, Leica, USA) at 40× objective magnification (resolution: 0.24–0.26 μm/pixel).
Evaluation of TGP
The evaluation process of TGP was presented in . In this study, we used a trichotomy way to assess the types of tumor growth pattern. In brief, the TGP was assessed using HE-stained WSIs at a low-power magnification (2.5×), classified as expansile, intermediate, or infiltrative growth patterns according to Morikawa et al. [Citation10]. Two observers (H.W. and H.Y.) reviewed a subset of the sections (100 cases were randomly selected) to evaluate the inter-observer agreement. Then the remaining slices were evaluated by one of the observers (H.W.).
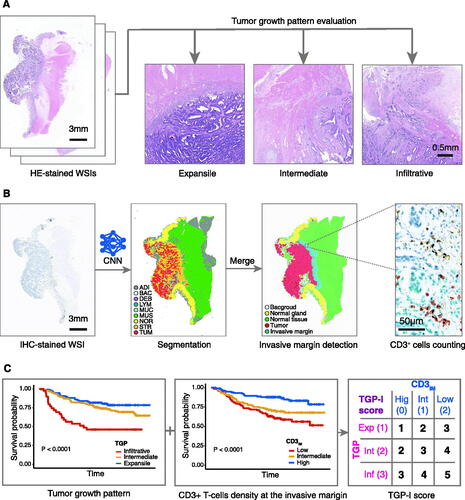
Figure 1. Study workflow. (A) HE-stained WSIs at low magnification (2.5×) were used to assess the tumor growth pattern using a trichotomous method (expansile, intermediate, or infiltrative). (B) A CNN model (CNN-IHC) was used to classify the IHC-stained WSIs of colorectal cancer into nine tissue categories, and a rough segmentation map was obtained. Merged tissues were obtained as tumor region and normal tissue region, respectively. Separate expansion operations were performed to obtain tumor invasive margin. The density of CD3+ T-cells at the tumor invasive margin (CD3IM) was calculated under 40× high magnification: the number of CD3+ T-cells at IM divided by the area of the tumor infiltrative margin. (C) Overall survival rates were obtained for TGP and CD3IM, separately. The TGP-I score was synthesized from the TGP and CD3IM. Expansile, intermediate, and infiltrative growth patterns were given scores of 1, 2, and 3, respectively. High, intermediate, and low CD3IM were scored as 0, 1, and 2, respectively. A new scoring system, the TGP-I score, was established by summing the TGP and the CD3IM. HE: hematoxylin and eosin; WSI: whole-slides image; CNN, convolutional neural network; IHC: immunohistochemistry; IM: invasive margin; ADI: adipose; BAC: background; DEB: debris; LYM: lymphocyte aggregates; MUC: mucus; MUS: muscle; NOR: normal mucosa; STR: stroma; TUM: tumor epithelium; TGP: tumor growth pattern; CD3IM, CD3+ T-cells density at the tumor invasive margin.
Calculation of CD3+ T-cells density at the tumor invasive margin
We used an artificial intelligence approach to achieve a fully automated assessment of TILs density at the tumor invasive margin, and the entire workflow is shown in .
First, tissue segmentation was performed on IHC-stained WSIs to determine the tumor invasive margin automatically. The CRC tissue was divided into nine categories using a convolutional neural network (CNN) model, including adipose (ADI), debris (DEB), tumor epithelium (TUM), tumor stroma (STR), lymphocytes (LYM), normal mucosa (NOR), mucus (MUC), smooth muscle (MUS), and background (BAC), as described in our previous work [Citation18]. Then morphological operation was used for image post-processing. The tumor region was obtained by merging debris, stroma, and tumor epithelium areas in WSIs, while the normal tissue was acquired by combining the areas of adipose and smooth muscle. The dilation operation was applied to the tumor and normal tissue regions respectively. The invasive margin of the tumor, with a thickness of roughly 500 μm, was recognized as the region where the tumor overlapped with the normal tissue.
Within the invasive margin region, CD3+ T-cells (brown color) and other type nuclei (blue color) were segmented with a divided-and-conquer strategy. The strategy mainly consisted of the super-pixel algorithm, color deconvolution, watershed, and feature-based segmentation. The CD3+ T-cells density at the tumor invasive margin (CD3IM) was calculated as follows: the number of CD3+ T-cells at the IM divided by the area of the tumor invasive margin. A percentile value was determined for each patient in accordance with the distribution of CD3IM in the discovery cohort. The thresholds of 33.3% and 66.6% were used to divide patients into low, intermediate, and high groups.
Calculation of TGP-I score
We hypothesized that simultaneously considering the interactions between TGP and TILs at the tumor invasive margin could provide additional prognostic information for CRC patients. Therefore, a TGP-I score (I: immune) was established by combining TGP and CD3IM. For TGP, the expansile growth pattern scored 1, the intermediate growth pattern scored 2, and the infiltrative growth pattern scored 3. For CD3IM, the high, intermediate, and low CD3IM were given a score of 0, 1, and 2, respectively. The final score (TGP-I score) was the sum of TGP and CD3IM scores according to the above criteria, ranging from 1 to 5 ().
Statistical analysis
Comparisons of clinicopathological characteristics were performed with Student’s t-test for continuous variables and the Chi-square test for categorical variables. Inter-observer agreements were evaluated using Cohen’s kappa coefficient with squared weights. Kaplan–Meier analysis with log-rank test was calculated for survival difference comparisons. The associations between survival and confounders were evaluated with multivariable Cox regression models using a stepwise forward method, with p < 0.05 as an entry point, for variable selection. Harrell’s C-statistic was used to evaluate the model performance. p < 0.05 was considered statistically significant. R software (v 4.1.2) was used for statistical analysis.
Results
Patients
After quality control, tumor samples from 479 stage I–III CRC patients who had follow-up information and HE/IHC-stained WSIs were collected for this retrospective analysis. The discovery cohort included 347 patients (209 males and 138 females; median age was 65 years) with a median follow-up time of 80 (interquartile range [IQR], 69–104) months. The validation cohort included 132 patients (78 males and 54 females; the median age was 62 years), with a median follow-up time of 65 (IQR, 58–73) months. Among all enrolled CRC patients, 80 (16.7%) patients had stage I colorectal cancer, 184 (38.4%) had stage II colorectal cancer, and 215 (44.9%) had stage III colorectal cancer. displays the demographic and clinicopathological characteristics of the samples in this study. The clinicopathological characteristics of both cohorts were well balanced, except for the TNM stage, tumor location, tumor grade and MSI status.
Table 1. The distributions of demographic and clinicopathologic characteristics of colorectal cancer patients in the two cohorts.
Association between TGP and CD3IM
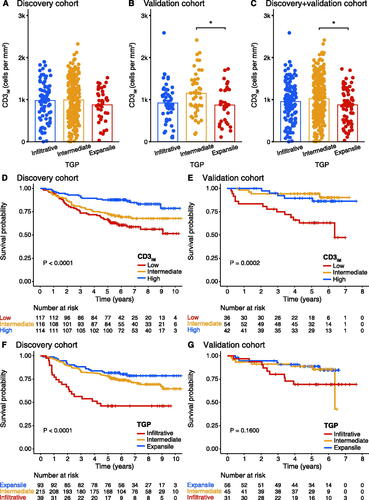
shows the distribution of CD3IM among different types of TGP in the two cohorts and a pooled cohort. In the discovery cohort, the expansile growth pattern had a lower mean CD3IM than the other two growth patterns, with no statistical difference (p > 0.05). In comparison to the intermediate growth pattern, the expansile growth pattern was substantially related to lower levels of CD3IM in the validation cohort (p = 0.014). The results were similar to the validation cohort after combining the discovery cohort and the validation cohort (intermediate vs. expansile, p = 0.011). This analysis demonstrated an association between the types of TGP and the density of CD3+ T lymphocytes at the IM.
Figure 2. The association between CD3IM and TGP and the respective prognostic value. (A–C) Student’s t-test was used to compare the distribution of CD3+ T-cells density among different types of TGP in the two cohorts and a pooled cohort. (*p < 0.05, Student’s t-test). (D, E) Kaplan–Meier curves analysis for the CD3IM in the discovery and validation cohort. (F, G) Kaplan–Meier curves analysis for the TGP in the discovery and validation cohort. TGP, tumor growth pattern; CD3IM, CD3+ T-cells density at the tumor invasive margin.
Prognostic significance of CD3IM
Patients were categorized into three groups according to their CD3IM score: low, intermediate, and high by using the cutoffs of 768 and 1211 cells/mm2. In the discovery cohort, 117 (33.7%) patients had a low CD3IM score, 116 (33.4%) patients had an intermediate CD3IM score, and 114 (32.9%) patients had a high CD3IM score. The Kaplan-Meier curve showed that patients with high CD3IM scores had a longer OS and RFS (p < 0.0001 for OS, ; p < 0.0001 for RFS, Supplementary Figure S1A). The 5-year survival rates were 66.7% (95% confidence interval [CI] 58.6–75.8%) for the CD3IM-low group, 72.4% (95% CI 64.7–81.0%) for the CD3IM-intermediate group, and 87.7% (95% CI 81.9–94.0%) for CD3IM-high group. There was a significant difference in OS between patients with high and low CD3IM score (unadjusted hazard ratio [HR] 0.32, 95% CI 0.18–0.55; p < 0.001; ).
Table 2. Uni- and multivariate analyses for OS in the two cohorts.
The validation cohort was divided into three categories by using the same cutoffs as the discovery cohort, including 36 (27.3%) low CD3IM score, 54 (40.9%) intermediate CD3IM score, and 42 (31.8%) high CD3IM score. The 5-year survival rates were recorded for 63.0% (95% CI 48.8–81.3%) patients with a low score, 94.3% (95% CI 88.2–100.0%) patients with an intermediate score, and 89.5% (95% CI 80.2–99.8%) patients with a high score. While the difference between the high-score group and the intermediate-score group was not obvious, it was significantly different from the low-score group (p = 0.0002; ). The unadjusted HR (intermediate vs. low score) was 0.16 (95% CI 0.05–0.50; p = 0.001; ); the unadjusted HR (high vs. low score) was 0.26 (95% CI 0.09–0.72; p = 0.010; ). For RFS, the KM curve displayed a similar trend with a p-value close to the significance level (p = 0.053; Supplementary Figure S1B).
Prognostic significance of TGP
In the consistency analysis of 100 TGP cases, the kappa value was 0.589, indicating moderate inter-reader agreement. In the discovery cohort, 93 samples (26.8%) exhibited an expansile growth pattern, 215 samples (62.0%) displayed an intermediate growth pattern, and 39 tumors (11.2%) had an infiltrative growth pattern. The infiltrative growth pattern was significantly related to shorter OS in Kaplan–Meier analysis (p < 0.0001; ) and demonstrated significantly shorter RFS (p < 0.0001; Supplementary Figure S1C). The 5-year survival rates were 81.7% (95% CI 74.2–90.0%) for the expansile growth pattern, 78.1% (95% CI 72.8–83.9%) for the intermediate growth pattern, and 46.2% (95% CI 32.9–64.8%) for the infiltrative growth pattern.
In the validation cohort, 56 samples (42.4%) exhibited an expansile pattern, 45 samples (34.1%) had an intermediate pattern, and 31 samples (23.5%) displayed an infiltrative pattern. The 5-year overall survival rates for patients with expansile, intermediate, and infiltrative growth patterns were 88.6% (95% CI 80.4–97.7%), 88.7% (95% CI 79.8–98.5%), and 69.3% (95% CI 54.3–88.3%), respectively. However, in the validation cohort, no statistically significant differences were observed in both OS (p = 0.1600; ) and RFS (p = 0.58; Supplementary Figure S1D).
Prognostic significance of TGP-I score
Using the 5-level categorization scoring criterion in the discovery cohort (TGP-I score5), 27 patients (7.8%) were categorized as score 1, 117 patients (33.7%) as score 2, 96 patients (27.7%) as score 3, 94 patients (27.1%) as score 4, and 13 patients (3.7%) were classified as score 5. The Kaplan–Meier curves showed that the higher the TGP-I score5, the worse the OS of patients (p < 0.0001, ). Patients with the highest score had the worst prognosis, while the lowest score was most favorable for patient survival (unadjusted HR for score 5 vs. 1 11.8, 95% CI 3.19–43.9; p < 0.001; ). The 5-year survival rates were 92.6% and 30.8% for subgroups 1 and 5, respectively. In the validation cohort, the number and percentage of patients with scores 1–5 were 14 (10.6%), 45 (34.1%), 42 (31.8%), 20 (15.2%), and 11 (8.3%), respectively. The 5-year survival rates from 1 to 5 points were 92.9%, 97.7%, 82.4%, 75.0%, and 54.5%, respectively ().
Figure 3. Survival analysis of the TGP-I score5 and TGP-I score3. Kaplan–Meier curves analysis for the TGP-I score in the discovery and validation cohort. (A, B) TGP-I score5 (5-level, score 1–5); (C, D) TGP-I score3 ((3-level, combined scores 1 and 2 into a new low score and scores 4 and 5 into a new high score (low [Citation1,Citation2] vs. intermediate [Citation3] vs. high [Citation4,Citation5])). TGP, tumor growth pattern.
![Figure 3. Survival analysis of the TGP-I score5 and TGP-I score3. Kaplan–Meier curves analysis for the TGP-I score in the discovery and validation cohort. (A, B) TGP-I score5 (5-level, score 1–5); (C, D) TGP-I score3 ((3-level, combined scores 1 and 2 into a new low score and scores 4 and 5 into a new high score (low [Citation1,Citation2] vs. intermediate [Citation3] vs. high [Citation4,Citation5])). TGP, tumor growth pattern.](/cms/asset/2cb59f80-db1f-4302-8762-5ac96a7e1788/iann_a_2215541_f0003_c.jpg)
Due to the relatively small number of cases with scores 1 and 5 in both cohorts, we further combined scores 1 and 2 into a new low score and scores 4 and 5 into a new high score to form a three-category score (TGP-I score3, low [Citation1,Citation2] vs. intermediate [Citation3] vs. high [Citation4,Citation5]). Analysis of the relationship between the TGP-I score and clinical characteristics showed that the TGP-I score was significantly associated with the TNM stage and CEA level (Supplementary Table S1-2). According to the Kaplan–Meier curves, patients in both cohorts with higher TGP-I score3 had worse OS (p < 0.0001 for the discovery cohort; p = 0.0039 for the validation cohort, ). In the discovery cohort, 5-year survival rates of the high and low TGP-I score3 were 61.7% and 86.8% (unadjusted HR for high vs. low 3.62, 95% CI 2.22–5.90; p < 0.001; ). The results were further confirmed in the validation cohort with 5-year survival rates of high and low TGP-I score3 were 67.7% and 96.5% (unadjusted HR for high vs. low 5.79, 95% CI 1.84–18.2; p = 0.003; ).
Furthermore, the Kaplan–Meier curve analysis demonstrated a significant correlation between the TGP-I score and RFS in the discovery cohort, indicating that patients with higher TGP-I score had a lower RFS (both p < 0.0001 for TGP-I score5 and TGP-I score3; Supplementary Figure S2A,C). Despite no statistically significant differences in RFS observed among the TGP-I score subgroups in the validation cohort, a positive trend could still be observed (Supplementary Figure S2B,D).
Ten potential predictors were subjected to univariate and multivariate Cox regression analysis. TNM stage, age, CEA level, tumor grade, TGP, CD3IM, and TGP-I score were identified as favorable predictors of OS (p < 0.05; ). Our study indicated that the TGP-I score3 maintained a prognostic association with OS in multivariate analysis, independent of other clinical factors. The adjusted HR high vs. low scores in the discovery cohort were 2.76 (95% CI 1.65–4.61; p < 0.001); adjusted HR high vs. low scores in the validation cohort were 6.03 (95% CI 1.88–19.4; p = 0.003; ). Based on the results of multivariate analysis, nomograms including TNM stage, age, CEA level, and TGP-I score3 were constructed to predict OS (Supplementary Figure S3).
Association of TGP, CD3IM, and TGP-I score3 with MSI
In addition, the relationship between the available MSI and MSS information from the discovery cohort with TGP, CD3IM, and TGP-I score3 were analyzed, respectively. The highest proportion of MSI was found for the expansile growth pattern. The percentages of MSI with expansile, intermediate, and infiltrative growth patterns were 19.4%, 6.5%, and 0.0%, respectively (Supplementary Figure S4(A)). The higher the CD3+ T-cells density at the tumour invasive margin, the higher the proportion of MSI: 6.7%, 9.8%, and 11.5% for low, intermediate, and high CD3IM, respectively (Supplementary Figure S4(B)). The proportion of MSI in low and intermediate TGP-I score3 was similar (12.0% vs. 13.0%) in contrast to the lowest proportion (2.5%) of MSI for high TGP-I score3 (Supplementary Figure S4(C)).
Prognostic significance of KRAS/BRAF/EGFR
The information regarding KRAS/BRAF/EGFR available was collected from the discovery cohort, which comprised 255 patients. However, no corresponding molecular detection was performed in the validation cohort. Based on the analysis of KM curves, no statistically significant relationship was observed between these molecular characteristics and OS (Supplementary Figure 5(A-C)). The TGP-I score proposed in this study, independent of KRAS/BRAF/EGFR, was not influenced by subgroups (Supplementary Figure 6(A-F)).
Predictive value of TGP-I score
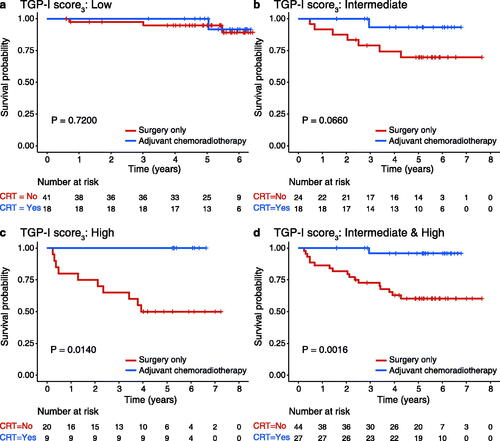
The survival probability of 130 CRC patients with post-surgery treatment information from the validation cohort was analyzed. OS with surgery only and adjuvant chemoradiotherapy in the low TGP-I score3 and intermediate TGP-I score3 was not statistically significant (p = 0.720 in the low TGP-I score3; ; p = 0.066 in the intermediate TGP-I score3; ). However, the Kaplan-Meier curves showed that patients in the group with a high TGP-I score3 would benefit from adjuvant chemoradiotherapy (p = 0.014; ). The 5-year survival rates were 100% and 50% in the adjuvant chemoradiotherapy and surgery-only groups, respectively. Combined intermediate and high TGP-I score3 showed comparable results with 5-year survival rates of 95.8% and 60.3%, respectively (p = 0.0016; ).
Figure 4. Predictive value of TGP-I score. (A–C) Kaplan–Meier curves analysis of overall survival for surgery alone or adjuvant chemoradiotherapy in TGP-I score3 (low, intermediate, and high). (D) Kaplan-Meier curves analysis of overall survival for surgery alone or adjuvant chemoradiotherapy in combined intermediate and high TGP-I score3. TGP, tumor growth pattern.
Predictor and model performance comparison
The prognostic discrimination ability between the TGP-I score and TGP or CD3IM alone was evaluated and compared. In the discovery cohort, the TGP-I score5 and the TGP-I score3 were comparable in their ability to predict OS (C-index, 0.658 vs. 0.647; ) and both outperformed the TGP (C-index, 0.596) or CD3IM (C-index, 0.617) scores alone. Similar findings were shown in the validation cohort: the TGP-I score3 achieved a higher C-index (0.700) than TGP (0.606) or CD3IM (0.674) scores (). From the multivariate analysis, age, CEA level, and TNM stage were the variables that were significant for survival. Adding the TGP-I score3 to a model that combined clinical variables (age, CEA, and TNM stage), we found that the TGP-I score3 could improve the prognostic performance in both cohorts (). The relative contribution of each parameter to predicting survival was analyzed, and the TGP-I score3 has similar importance compared with the TNM stage (31.2% vs. 32.9%) and is stronger than other clinical parameters ().
Figure 5. Discrimination performance of predictor or model. (A, B) Clinical performance of tumor-related and immune-related risk factors in two cohorts. The predictive accuracy for overall survival based on the iAUC with 1000 × bootstrap resampling for each parameter is shown in a box plot. Median values of 1000× bootstrap resampling are shown with thick lines. (C) The relative importance of each risk parameter to survival risk using the χ2 proportion test for clinical parameters (including Age, CEA, TNM; above) and for clinical parameters plus TGP-I score3 (below). iAUC: integrated area under the ROC curve; CEA: carcinoembryonic antigen; TNM: tumor-node-metastasis. TGP, tumor growth pattern; CD3IM, CD3+ T-cells density at the tumor invasive margin.
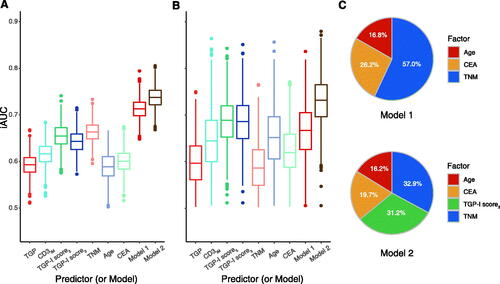
Table 3. The prediction performance in two cohorts.
Discussion
Prognostic stratification and clinical treatment decisions for CRC patients still need to be improved. There is increasing recognition that the importance of the interactions between tumor and the host immune system in cancer progression and invasion [Citation1,Citation20]. The tumor infiltration margin represents a critical interface for tumor-host interactions, where the balance of pro- and anti-tumor components may be the key determinant of tumor aggression and clinical outcomes [Citation21]. TGP and TILs are promising prognostic biomarkers at IM [Citation8,Citation14,Citation16]. However, these characteristics are mostly evaluated independently of one another. Therefore, the work presented herein utilized AI-assisted analysis to fully automate the quantification of TILs at IM and to assess their interaction with TGP. Our study demonstrated the correlation between these two features and supported that their spatial relationship could further increase the prognostic value of stage I-III colorectal cancer patients.
Previously, biomarkers including TGP and tumor budding (TB) have been proposed to describe histomorphological changes of the tumor invasive margin [Citation10,Citation22]. TGP was first proposed by Jass et al. as an influential prognostic indicator for patients with rectal cancer [Citation8]. Previous studies have indicated that the infiltrative growth pattern as a pro-tumor factor leads to a poorer prognosis for CRC patients [Citation3,Citation23,Citation24]. TB is closely, but not identically, related to TGP. It is a separate feature diagnosed at high magnification which is defined as a single tumor cell or a cluster of up to four tumor cells at the front of tumor invasion [Citation22]. It is worth noting, however, quantification of TB requires precise selection of region. Furthermore, individual cell clusters may be affected by mixed mesenchymal components and inflammatory infiltration, making the assessment challenging [Citation25]. Different from TB, TGP represents a characteristic diagnosed at low magnification with a simple and rapid assessment [Citation10]. It also has the advantage of being cost-effective and less affected by the sample location of the infiltrating tumor margin [Citation26]. Therefore, the assessment of TGP typing is easily performed in clinical practice and it is promising to be incorporated into the routine diagnosis of gastrointestinal pathology in the future [Citation9]. Previous studies using a dichotomy (i.e. expansile or infiltrative) showed certain limitations, such as a wide variation in the frequency of infiltrative growth patterns [Citation10]. The trichotomy (i.e. expansile, intermediate, or infiltrative) has demonstrated reasonableness in the stratification of patient prognosis and thus received our attention. The infiltrative tumor margin may represent a morphological alteration of tumor cells dividing and then migrating directionally into host tissue, which may result in unfavorable patient prognosis. Contrarily, an expansile margin may be the randomly arranged tumor cells following division, resulting in a lower proclivity or capacity to invade host tissue [Citation27,Citation28]. The findings of our discovery group were consistent with previous studies showing that infiltrative growth pattern is significantly related to shorter OS in patients with stage I–III CRC [Citation10]. Similarly, patients with an infiltrative growth pattern had a significantly shorter RFS, which further supports the detrimental effect of an infiltrative growth pattern on tumor progression and prognosis. However, this tendency was not evident in our validation group, probably due to a lack of instances.
In regions of tumor invasive frontier, in addition to the primary tumor itself, TILs are critical as anti-tumor factors in balancing tumor invasion and cancer defense [Citation21]. TILs inhibit tumor growth by recruiting, maturing, and activating immune cells [Citation29]. The quantity and quality of inflammatory cell infiltration are important independent predictors of survival outcomes and correlate with the efficiency of the antitumor host response [Citation6]. A high incidence of TILs was found to favor patient prognosis [Citation30]. CD3+ T-cells, a widely distributed membrane indicator of mature T lymphocytes, might be utilized to estimate the total number of T lymphocytes [Citation18]. According to Galon et al. the density of TILs measured by CD3 immunostaining of the infiltrating margins was a stronger predictor of OS than traditional histopathological prognostic factors (i.e. TNM classification) [Citation6]. Our research investigated the value of TILs density in determining prognosis, with longer OS in CRC patients with higher CD3+ TILs density at IM. This result was consistent with Nosho et al. that high-density CD3+ TILs have a good prognosis [Citation31]. This confirms the critical role of CD3+ TILs on patient prognosis.
Standardizing the assessment of immune cell infiltration would be essential for the development of prognostic and predictive tools [Citation32]. Immunoscore is a standardized method for assessing lymphocyte immune infiltration that has proven highly reproducible in multiple centers [Citation14]. Currently, most studies assessing the clinical effects of immune infiltration were performed by IHC techniques of tissue sections combined with image analysis or subjective assessment, which lacks objectivity and is time-consuming [Citation33]. In our study, we used deep learning-based techniques combined with unsupervised segmentation for tissue segmentation and CD3+ T-cells counting. The approach eliminates human subjectivity and removes the requirement for experienced operators to spend time quantifying large features over the entire slide section. The proposed AI-based CD3IM score has the advantages of reproducibility and reliability, which could further save the efforts of pathologists and facilitate clinical dissemination.
Considering simultaneously tumor histopathological patterns and immune status may provide more accurate and adequate prognostic information. TGP is hypothesized to differ in the invasive capacity of tumor margins. The infiltrating tumor boundary structure, by penetrating the arterial and lymphatic vessels, lead to the growth and dispersion of tumor cells. The host, on the other hand, strives to repel this onslaught by developing an immune response to prevent the tumor from invading vascular and lymphatic channels [Citation21]. Thus, the interactions between immune profiling and TGP may contain important information on the potential for tumor progression. Based on this hypothesis, we attempted to develop a deep learning-based score, the TGP-I score, to reflect the interactions between the TGP and the infiltrating immune cells and further understand the role in patient survival. We found that those with both the infiltrative growth pattern and a low CD3IM score had the worst prognosis, with significantly shorter OS and RFS. Previous studies have shown that, at the invasive tumor front, the existence of an infiltrative growth pattern was negatively associated with the immune and inflammatory response [Citation21,Citation31,Citation34]. The stronger the lymphocytic response, the longer the survival time of the patient. It implies that a lessened host immunological and inflammatory response to tumor cells may be indicated by the infiltrative growth pattern, which results in shorter patient survival. In the TGP-I score3, patients with the lowest scores had the most favorable OS, whereas those with the highest scores had the worst OS (unadjusted HR 3.62 for high vs. low). Similar findings could be observed in the validation cohort (unadjusted HR 5.79 for high vs. low), suggesting that the TGP-I score3 we established was robust. In addition, multivariate analysis showed that the TGP-I score3 remained a predictor independent of clinical factors. Meanwhile, the nomogram was demonstrated in our study, which facilitates the calculation of individual OS probabilities and visualization of outcomes in clinical practice. The TGP-I score combining TGP and CD3IM showed superiority over the TGP score alone as well as the CD3IM score in the survival analysis, demonstrating the validity of the TGP-I scoring model. In addition, we noted that the TGP-I score significantly correlated with the TNM stage, which suggested that the TGP-I score could be used as a valuable tool to predict tumor aggressiveness and prognosis, and for the complementary TNM stage. In the assessment of model performance, the complete model including the TGP-I score3 and clinicopathological factors showed improved model performance prognostic value to the clinicopathological model alone. The above results demonstrate that the TGP-I score3 we developed cloud provided more prognostic information predicting OS in stage I–III CRC. The relationship between TGP and the density of CD3+ T-cells could better capture the interaction of invasive fronts, which in turn translates into a more robust prognostic indicator.
In CRC, the presence of MSI is associated with a favourable prognosis [Citation35]. Immunotherapy has been shown to have a significant therapeutic effect in CRC patients with MSI [Citation36]. Our study showed that the highest proportion of MSI was observed in the subgroup with expansile growth patterns and high CD3IM. Moreover, the proportion of MSI was lowest in the subgroup with high TGP-I score. This indicated that low CD3IM combined with infiltrative growth pattern may be a limiting factor for MSI in tumor immunotherapy. A previous study has shown that the infiltrative growth pattern was negatively correlated with MSI, which could be a result of certain molecular changes (e.g. BRAF) linked to aggressive tumor activity, and they were independently associated with the prognosis of colorectal cancer patients [Citation10]. This is further confirmed by our findings. consensus molecular subtypes (CMS) are also important molecular subtypes of colorectal cancer. CMS1 subtype is usually associated with a high MSI status, which may be related to tumor immune activation and genetic losses [Citation37]. We hypothesize that there is a link between the TGP-I score and CMS, especially CMS1, as they are both associated with MSI. Further prospective studies are needed in the future to validate this hypothesis.
The necessity and applicability of postoperative adjuvant therapy in colorectal cancer patients remain controversial [Citation38,Citation39], and it is essential to identify the patient most likely to benefit. In this study, we explored the relationship between TGP-I score3 and treatment modalities for patients with stage I-III colorectal cancer. We found that patients with high TGP-I score3 were more promising to benefit from adjuvant chemoradiotherapy. The same trend could be observed in the combined intermediate- and high score groups. This suggested, in part, that the patients most likely to benefit from adjuvant chemoradiotherapy would be those with clinicopathologic variables indicating a high probability of invasive or distant spread, respectively. Yasmeen et al. suggested that adjuvant chemotherapy should be considered for CRC patients with stage II with infiltrative border structures and no lymph node metastases, which supported our conjecture to some extent [Citation3]. Yet, no statistically significant differences were found in OS between adjuvant chemoradiotherapy or surgery alone in the subgroup with a lower TGP-I score3. Our study indicated that the TGP-I score3 constructed by TGP and CD3IM could identify patients who would benefit from adjuvant chemoradiotherapy, which has significant implications for patient management in clinical practice.
Our study has several limitations. Firstly, the tumor growth pattern of HE-stained WSIs was not assessed fully automatically. The types of tumor growth patterns could be easily examined by routine histopathological assessment at low magnification with less time and cost. Second, this study is retrospective and may be susceptible to bias introduced by certain risk factors, and the results need further prospective and multicenter assessment for generalizability. Further, the caseload used in this study was small. However, the TGP-I score3 showed better prognostic efficacy in both cohorts. Finally, data on cancer treatment are limited. A separate analysis of stage II efficacy was not done because of the small number of enrolled cases regarding stage II patients.
Conclusions
In this study, we proposed a new scoring system, the TGP-I score, to assess the interactions between TGP and tumor-infiltrating lymphocytes at the margins of tumor infiltration by utilizing a database of stage I-III CRC patients from two retrospective cohort studies. The results supported that the TGP-I score could be an independent predictor of prognosis for CRC patients, with higher score being associated with worse survival. This research may serve as a basis for future studies on the prognostic significance of the interactions between tumor infiltration and host anti-tumor immune response in CRC patients.
Ethical approval
This study was approved by the Research Ethics Committees of Guangdong Provincial People’s Hospital (GDREC2020011H) and the Institutional Review Board of the Sixth Affiliated Hospital of Sun Yat-sen University (2019ZSLYEC-169), with the need for informed consent waived for this retrospective study.
Author contributions
YRY, KZ, CHL, and ZYL conceptualized and designed the studies. YRY, KZ wrote the manuscript. KZ and ZYL edited and reviewed the manuscript. XMW, HHW, HFY, and SY performed the research and collected data. KZ and YXZ analyzed and interpreted the data. XMW, SY, ZYL, QLZ and CHL provided discussion, critical feedback, and manuscript editing.
Supplemental Material
Download PDF (948.6 KB)Disclosure statement
No potential conflict of interest was reported by the author(s).
Data availability statement
The data used to support the findings of the present study are available from the corresponding author upon request.
Additional information
Funding
References
- Angell HK, Bruni D, Barrett JC, et al. The immunoscore: colon cancer and beyond. Clin Cancer Res. 2020;26(2):1–15.
- Hendry S, Salgado R, Gevaert T, et al. Assessing tumor-infiltrating lymphocytes in solid tumors: a practical review for pathologists and proposal for a standardized method from the international immunooncology biomarkers working group: part 1: assessing the host immune response, TILs in invasive breast carcinoma and ductal carcinoma in situ, metastatic tumor deposits and areas for further research. Adv Anat Pathol. 2017;24(5):235–251.
- Qwaider YZ, Sell NM, Stafford CE, et al. Infiltrating tumor border configuration is a poor prognostic factor in stage II and III Colon adenocarcinoma. Ann Surg Oncol. 2021;28(6):3408–3414.
- Schmitt M, Greten FR. The inflammatory pathogenesis of colorectal cancer. Nat Rev Immunol. 2021;21(10):653–667.
- Zhang L, Yu X, Zheng L, et al. Lineage tracking reveals dynamic relationships of T cells in colorectal cancer. Nature. 2018;564(7735):268–272.
- Galon J, Costes A, Sanchez-Cabo F, et al. Type, density, and location of immune cells within human colorectal tumors predict clinical outcome. Science. 2006;313(5795):1960–1964.
- Pagès F, Kirilovsky A, Mlecnik B, et al. In situ cytotoxic and memory T cells predict outcome in patients with early-stage colorectal cancer. J Clin Oncol. 2009;27(35):5944–5951.
- Jass JR, Love SB, Northover JM. A new prognostic classification of rectal cancer. Lancet. 1987;1(8545):1303–1306.
- Koelzer VH, Lugli A. The tumor border configuration of colorectal cancer as a histomorphological prognostic indicator. Front Oncol. 2014;4:29.
- Morikawa T, Kuchiba A, Qian ZR, et al. Prognostic significance and molecular associations of tumor growth pattern in colorectal cancer. Ann Surg Oncol. 2012;19(6):1944–1953.
- Karamitopoulou E, Zlobec I, Koelzer VH, et al. Tumour border configuration in colorectal cancer: proposal for an alternative scoring system based on the percentage of infiltrating margin. Histopathology. 2015;67(4):464–473.
- Hwang W-L, Lan H-Y, Cheng W-C, et al. Tumor stem-like cell-derived exosomal RNAs prime neutrophils for facilitating tumorigenesis of Colon cancer. J Hematol Oncol. 2019;12(1):10.
- Lugli A, Zlobec I. The battle for prognosis at the invasive front of colorectal cancer. EBioMedicine. 2020;58:102918.
- Pagès F, Mlecnik B, Marliot F, et al. International validation of the consensus immunoscore for the classification of Colon cancer: a prognostic and accuracy study. Lancet. 2018;391(10135):2128–2139.
- Idos GE, Kwok J, Bonthala N, et al. The prognostic implications of tumor infiltrating lymphocytes in colorectal cancer: a systematic review and meta-analysis. Sci Rep. 2020;10(1):3360.
- Reichling C, Taieb J, Derangere V, et al. Artificial intelligence-guided tissue analysis combined with immune infiltrate assessment predicts stage III Colon cancer outcomes in PETACC08 study. Gut. 2020;69(4):681–690.
- Niazi MKK, Parwani AV, Gurcan MN. Digital pathology and artificial intelligence. Lancet Oncol. 2019;20(5):e253–61–e261.
- Xu Z, Li Y, Wang Y, et al. A deep learning quantified stroma-immune score to predict survival of patients with stage II-III colorectal cancer. Cancer Cell Int. 2021;21(1):585.
- Zhao K, Wu X, Li Z, et al. Prognostic value of a modified immunoscore in patients with stage I − III resectable colon cancer. Chin J Cancer Res. 2021;33(3):379–390.
- Väyrynen JP, Kantola T, Väyrynen SA, et al. The relationships between serum cytokine levels and tumor infiltrating immune cells and their clinical significance in colorectal cancer. Int J Cancer. 2016;139(1):112–121.
- Zlobec I, Lugli A. Invasive front of colorectal cancer: dynamic interface of pro-/anti-tumor factors. World J Gastroenterol. 2009;15(47):5898–5906.
- Mitrovic B, Handley K, Assarzadegan N, et al. Prognostic and predictive value of tumor budding in colorectal cancer. Clin Colorectal Cancer. 2021;20(3):256–264.
- Zlobec I, Baker K, Minoo P, et al. Tumor border configuration added to TNM staging better stratifies stage II colorectal cancer patients into prognostic subgroups. Cancer. 2009;115(17):4021–4029.
- Dai W, Li Y, Meng X, et al. Does tumor size have its prognostic role in colorectal cancer? Re-evaluating its value in colorectal adenocarcinoma with different macroscopic growth pattern. Int J Surg. 2017;45:105–112.
- Lugli A, Kirsch R, Ajioka Y, et al. Recommendations for reporting tumor budding in colorectal cancer based on the international tumor budding consensus conference (ITBCC) 2016. Mod Pathol. 2017;30(9):1299–1311.
- Dundas SA, Laing RW, O’Cathain A, et al. Feasibility of new prognostic classification for rectal cancer. J Clin Pathol. 1988;41(12):1273–1276.
- Enderling H, Hlatky L, Hahnfeldt P. Tumor morphological evolution: directed migration and gain and loss of the self-metastatic phenotype. Biol Direct. 2010;5(1):23.
- Prehn RT. The inhibition of tumor growth by tumor mass. Cancer Res. 1991;51:2–4.
- Alexander PG, McMillan DC, Park JH. The local inflammatory response in colorectal cancer - Type, location or density? A systematic review and meta-analysis. Cancer Treat Rev. 2020;83:101949.
- Malka D, Lièvre A, André T, et al. Immune scores in colorectal cancer: where are we? Eur J Cancer. 2020;140:105–118.
- Nosho K, Baba Y, Tanaka N, et al. Tumour-infiltrating T-cell subsets, molecular changes in colorectal cancer, and prognosis: cohort study and literature review. J Pathol. 2010;222(4):350–366.
- Denkert C, Wienert S, Poterie A, et al. Standardized evaluation of tumor-infiltrating lymphocytes in breast cancer: results of the ring studies of the international immuno-oncology biomarker working group. Mod Pathol. 2016;29(10):1155–1164.
- Rizzardi AE, Johnson AT, Vogel RI, et al. Quantitative comparison of immunohistochemical staining measured by digital image analysis versus pathologist visual scoring. Diagn Pathol. 2012;7(1):42.
- Mlecnik B, Tosolini M, Kirilovsky A, et al. Histopathologic-based prognostic factors of colorectal cancers are associated with the state of the local immune reaction. J Clin Oncol. 2011;29(6):610–618.
- Ganesh K, Stadler ZK, Cercek A, et al. Immunotherapy in colorectal cancer: rationale, challenges and potential. Nat Rev Gastroenterol Hepatol. 2019;16(6):361–375.
- André T, Shiu K-K, Kim TW, et al. Pembrolizumab in microsatellite-instability-high advanced colorectal cancer. N Engl J Med. 2020;383(23):2207–2218.
- Becht E, de Reyniès A, Giraldo NA, et al. Immune and stromal classification of colorectal cancer is associated with molecular subtypes and relevant for precision immunotherapy. Clin Cancer Res off J Am Assoc Cancer Res. 2016;22(16):4057–4066.
- Baxter NN, Kennedy EB, Bergsland E, et al. Adjuvant therapy for stage II colon cancer: ASCO guideline update. J Clin Oncol. 2022;40(8):892–910.
- Petrelli F, Coinu A, Lonati V, et al. A systematic review and meta-analysis of adjuvant chemotherapy after neoadjuvant treatment and surgery for rectal cancer. Int J Colorectal Dis. 2015;30(4):447–457.