
Abstract
Objective
The purpose of this study is to explore the risk factors of gallbladder stone (GBS) in patients with type 2 diabetes mellitus (T2DM) and also develop a simple-to-use nomogram for GBS in patients with T2DM.
Methods
This study retrospectively analyzed 2243 patients with T2DM hospitalized in Peking University International Hospital from January 2017 to August 2022. According to the results of colour Doppler ultrasonic examinations, the patients were divided into two groups.
Results
(1) Compared with the non-GBS group, the GBS group was older (p < 0.05), and the diabetes duration in the GBS group was longer (p < 0.05). The proportion of overweight and obese people in the GBS group was significantly higher than that in the non-GBS group (p < 0.05, respectively). The proportion of patients with diabetic nephropathy (DN) and diabetic peripheral neuropathy (DPN) was higher in the GBS group (p < 0.05, respectively). (2) Logistic regression showed that age, body mass index (BMI), diabetes duration, total cholesterol (TC), triglycerides (TG), alanine aminotransferase (ALT), DN, and DPN were independent risk factors for GBS (p < 0.05, respectively). (3) The area under the curve (AUC) of the nomogram for GBS was 0.704 (95% CI 0.656, 0.748), with a specificity of 90.34%, a sensitivity of 55.38%, and an accuracy of 86.83%.
Conclusion
The nomogram is accurate to a certain degree and provides a clinical basis for predicting the incidence of GBS in patients with T2DM, which has a certain predictive value.
Introduction
Gallstones occur mainly in the gallbladder and bile duct and are a common indication for surgery [Citation1,Citation2]. The incidence of GBS appears to increase due to dietary changes and improved living standards [Citation3]. Diabetes mellitus (DM) is a chronic disease associated with dysregulated insulin metabolism. T2DM accounts for most of DM and is characterized by obesity and hyperinsulinemia. Patients with T2DM are more likely to develop GBS than the overall population [Citation4]. Elmehdawi et al. [Citation5] found that obese and elderly patients with T2DM are more likely to suffer from GBS and considered BMI, age, and female sex as risk factors for its development. It has also been found that the likelihood of developing GBS increases with diabetes duration [Citation6]. In addition, it has also been suggested that GBS may increase the risk of T2DM [Citation7].
DM is recognized as a significant risk determinant in surgical procedures, demonstrated to augment both mortality and the incidence of complications post-abdominal surgery, particularly in the context of gallbladder ailments. Existing scientific literature underlines that surgical interventions about the biliary system in patients with diabetes necessitate specialized attention [Citation8]. In addition, although T2DM patients with GBS may be asymptomatic for a long time, once they get sick, they may develop gallbladder gangrene and perforation, as well as severe cholangitis and pancreatitis. The exploration of risk factors for GBS in patients with T2DM is important.
Therefore, this study aimed to construct a nomogram to predict the risk of GBS in patients with T2DM, to allow the early detection of high-risk groups, and to institute effective preventative or therapeutic measures to prevent and delay the complications of severe GBS.
Materials and methods
Ethics statement
The present investigation secured approval from the Peking University International Hospital’s Ethics Committee and adhered to the ethical principles of both institutional and national research committees. Moreover, it aligned with the 1964 Helsinki Declaration, including its later amendments or analogous ethical standards. Given the retrospective nature of this study, which involves analysis of previously collected clinical data, the mandate for written informed consent was waived.
Research subjects
This study retrospectively analyzed 2243 patients with T2DM hospitalized in the Peking University International Hospital from January 2017 to August 2022. This population included 1425 men and 818 women, with an average age of 53.43 ± 13.12 years. The inclusion criteria were: (1) a diagnosis of T2DM according to the criteria of the WHO (1999) for diabetes [Citation9] and (2) aged between 18 and 70 years. Patients were excluded if they had: (1) diabetes other than T2DM, including gestational, type 1, gestational, or other forms, (2) malignant tumours, (3) severe liver or kidney disease, or (4) been previously diagnosed with GBS, (5) application of contraceptives and cephalosporins in the past six months.
Methods
General conditions and clinical data
The baseline characteristics of the participants included sex, age, diabetes duration, height, weight, BMI, medications, systolic blood pressure (SBP), diastolic blood pressure (DBP), and T2DM complications such as DN, DR, and DPN. The BMI was determined as BMI (kg/m2) = weight (kg)/height2 (m2).
Laboratory biochemical indices
Venous blood was collected after an eight-hour fast. The biochemical indices (Beckman Coulter Corp., Boulevard Brea, CA, USA) measured included glycated haemoglobin (HbA1c), fasting blood glucose (FBG), postprandial blood glucose (PBG), TC, TG, high-density lipoprotein cholesterol (HDL-C), low-density lipoprotein cholesterol (LDL-C), uric acid (UA), serum creatinine (sCr), aspartate aminotransferase (AST), alkaline phosphatase (ALP), ALT, gamma-glutamyl transpeptidase (GGT), total bilirubin (TBIL), direct bilirubin (DBIL), and total bile acid (TBA). The glomerular filtration rate (eGFR) was determined using the sCr of the study subjects.
eGFR was calculated based on the sCr of the study subjects. Calculation formula [Citation10]:
Male:
sCr ≤ 0.9 mg/dl: eGFR CKD-EPI-ASIA = 141 × (sCr/0.9)–0.411 × 0.993age × 1.057
sCr > 0.9 mg/dl: eGFR CKD-EPI-ASIA = 141 × (sCr/0.9)–1.209 × 0.993age × 1.057
Female:
sCr ≤ 0.7 mg/dl: eGFR CKD-EPI-ASIA = 141 × (sCr/0.7)–0.329 × 0.993age × 1.049
sCr > 0.7 mg/dl: eGFR CKD-EPI-ASIA = 141 x (sCr/0.7)–1.209 × 0.993age × 1.049
Ultrasonography of the abdomen
All participating patients were instructed to abstain from food for at least 12 h before the examination. The subsequent morning, a proficient ultrasound practitioner conducted abdominal ultrasonography on the subjects, utilizing an Echolaser X4 (Esaote SpA, Genoa, Italy) colour Doppler ultrasound device. Thorough documentation was made of the gallbladder and bile duct conditions. Based on the presence or absence of GBS, participants were categorized into two groups: the GBS group (n = 212) and the non-GBS group (n = 2031).
Statistical analysis
Data were analyzed using SPSS version 21.0 (IBM Corp., NY, USA). The data were analyzed using the Kolmogorov-Smirnova test in normality analysis. Normally distributed data were expressed as mean ± standard deviation and were compared with T-tests. The continuous data with non-normal distribution were presented as median (interquartile range). The difference between continuous data with non-normal distribution was tested with the Mann–Whitney U test. Count data were presented as ratios, and differences between groups were analyzed using χ2 tests. Unconditional multivariate logistic regression analysis was used to evaluate odds ratios (ORs) and 95% confidence intervals (95% CIs). All statistical tests were two-sided; p-values <0.05 were considered statistically significant.
Receiver operating characteristic (ROC) curves were constructed, and their AUCs were determined. AUCs with 95% CIs with 500 bootstrap resamplings were used to assess the discriminatory efficacy of the nomogram. R (http://www.R-project.org) and Empower Stats (www.empowerstats.com, X&Y Solutions, Inc., Boston, MA) were used for analyses.
Results
Baseline features of participants
All continuous variables adhered to a normal distribution. It was noted that individuals within the GBS group exhibited a higher average age, with a more significant percentage exceeding 60 years than the non-GBS group (p < 0.05). The patients with GBS had also had T2DM for longer (p < 0.05) and showed higher levels of AST, ALT, and GGT (p < 0.05), as well as being significantly more likely to be overweight or obese (p < 0.05, respectively) and have abnormal TC and TG values than the non-GBS group (p < 0.05, respectively). Furthermore, more individuals with GBS suffered DN and DPN than those without (p < 0.05, respectively). However, the two groups did not differ significantly regarding sex, FBG, PBG, HbA1c, ALP, GGT, LDL-C, HDL-C, TBA, or UA levels (p > 0.05 for all). There is no significant difference in medication between the two groups (p > 0.05 for all) ().
Table 1. Comparison of general conditions and biochemical indexes between the two groups.
Univariate analysis of GBS
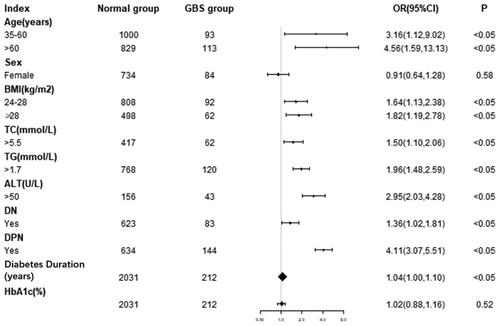
A univariate regression model was set up using GBS as the dependent variable. The incidence of GBS in middle-aged patients was approximately 3.16 times than that in young people (OR = 3.16, 95% CI: 1.12–9.02), while the incidence in elderly patients was about 4.56 times than that in young people (OR = 4.56, 95% CI: 1.59–13.13). GBS was also 1.64 times more common in overweight (24 kg/m2<BMI < 28kg/m2) patients (OR = 1.64, 95% CI: 1.13–2.38), and was 1.82 times more prevalent in obese patients (BMI ≥ 28kg/m2) compared with normal-weight patients (OR = 1.82, 95% CI: 1.19–2.78). The likelihood of GBS incidence was found to be 1.50 and 1.96 times higher in individuals presenting elevated levels of TC and TG, respectively, as opposed to those with regular lipid levels (OR = 1.50, 95%CI: 1.10–2.06; OR = 1.96, 95%CI: 1.48–2.59, correspondingly). Furthermore, GBS demonstrated a 2.95 times greater prevalence in subjects exhibiting irregular ALT levels than those with standard ALT (OR = 2.95, 95%CI: 2.03–4.28). The incidence of GBS in patients with DN was 1.36 times greater than in people without DN (OR = 1.36, 95%CI: 1.02–1.81) and 4.11 times greater with DPN (OR = 4.11, 95%CI: 3.07–5.51). The results showed that sex and HbA1c were not independent risk factors for GBS ().
Figure 1. Forest map of GBS risk factors of patients with T2DM.
The multivariate analysis used GBS as the dependent variable and sex, age, BMI, diabetes duration, TC, TG, ALT, HbA1c, DN, and DPN as independent variables. The regression equation of the model was logit (GBS)= −6.41462 − 0.26761*SEX +0.03247*AGE +0.03529*BMI +0.00710*DIABETES DURATION +0.18205*TC +0.44168*TG +1.12999*ALT +0.02580*HBA1C +1.00542*DN +1.73204*DPN.
Accuracy of the nomogram for predicting GBS in T2DM patients
A nomogram () was constructed using the risk factors determined by the multivariate regression analysis. The AUC of the nomogram for GBS was 0.704 (95% CI 0.656, 0.748), with a specificity of 90.34%, a sensitivity of 55.38%, and an accuracy of 86.83% ().
Figure 2. Nomogram for GBS in patients with T2DM. Instructions: Each individual’s GBS risk for patients with T2DM was estimated by plotting each variable axis. A verticle line was drawn from that value to the top points scale to determine the number of points assigned by that variable value. Then, the points from each variable value were summed. The sum on the total points scale was located and vertically projected onto the bottom axis, and then a personalized risk for GBS was obtained.
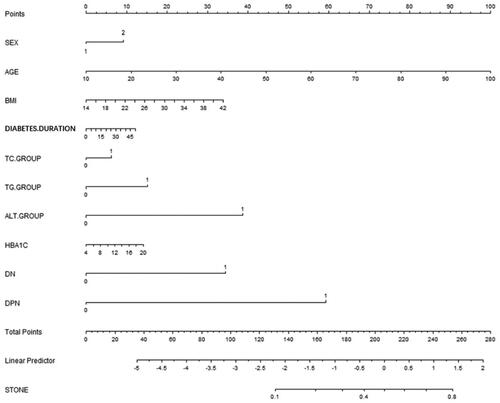
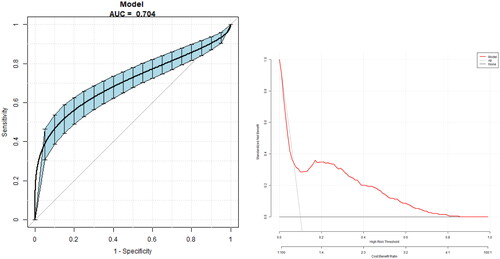
Figure 3. ROC curves for the accuracy of the GBS nomogram in patients with T2DM.The AUC of the nomogram for GBS was 0.704 (95% CI 0.656, 0.748), with a specificity of 90.34%, a sensitivity of 55.38%, and an accuracy of 86.83%, respectively.
Discussion
GBS is closely associated with diabetes, especially T2DM. More than 30% of patients with T2DM have GBS simultaneously, while its incidence in non-diabetes is only about 10% [Citation11,Citation12]. The incidence of T2DM with GBS is three times that of GBS without T2DM [Citation13,Citation14]. Therefore, the association between the two diseases is important in diagnosing and treating such patients. The objective was to construct a nomogram model using the identified risk factors for GBS in T2DM, allowing the direct prediction of GBS development and early identification of high-risk groups for timely preventative and treatment measures.
Previous studies have designed various models for predicting the risk of GBS development in T2DM [Citation15,Citation16], although these are used infrequently due to wide variations in individual differences in populations. Our study is the first to use a nomogram for predicting GBS risk in Chinese patients with T2DM. Nomograms are widely used for assessing prognosis in cancer and cardiovascular disease [Citation17]. Furthermore, recent studies have also used nomograms to predict the likelihood of developing gestational diabetes into T2DM [Citation18]. Despite this, the evolution of GBS in individuals afflicted with T2DM has been scarcely explored in existing research. Nomograms, on the other hand, provide a visually appealing and straightforward method for forecasting, enabling personalized disease management. This tool could prove instrumental in guiding clinical decision-making processes.
Many studies have investigated GBS in patients with T2DM [Citation19]. It is known that various factors, particularly age, and sex, are involved, and it is reported that patients who are overweight and of advanced age are at increased risk [Citation19]. As the human body ages, the functions of the various organs decline, and there is reduced activity of the age-related enzyme 7α-hydroxylase reduced. This adversely affects cholesterol conversion to bile acid and reduces its degradation, increasing the overall levels and promoting excretion in the bile duct. Here, it was found that patients who developed GBS were older than those who did not, and GBS was especially prevalent in the over-60 age group (p < 0.05). Univariate regression found that middle-aged and elderly patients had 3.18 times (OR = 3.18, 95% CI: 1.12–9.02) and 4.56 times (OR = 4.56, 95% CI: 1.59–13.13) higher risk of developing GBS than younger patients.
Obesity is reported to lead to a 2-3-fold increase in the incidence of GBS, and GBS risk is also raised by fast weight loss. Therefore, it has been concluded that there is a strong association between GBS and BMI and that BMI is an important factor in predicting the risk of GBS [Citation20]. In addition, several researchers have found that excess weight and older age were linked to an elevated risk of GBS in T2DM [Citation19]. However, the study also noted that the association’s evidence was inconclusive. The present study found a similar result. In the hospitalized patients, when patients were grouped according to BMI, the results showed that the numbers of overweight (24 kg/m2<BMI < 28kg/m2) and obese (BMI ≥ 28kg/m2) patients in the GBS group were markedly higher than those in patients without GBS. Further univariate analysis showed that after adjusting for age, sex, diabetes duration, and other indices, overweight and obesity remained risk factors for GBS in T2DM patients (OR = 1.64, 95% CI: 1.13–2.38; OR = 1.82, 95% CI: 1.18–2.78), thus further confirming the association.
The sex of the patient has also been found to affect the incidence of GBS. Estrogen levels in women are known to influence bile acid secretion, with higher levels leading to reduced secretion of bile acid, thus potentially leading to GBS [Citation20]. The current investigation noted that the GBS group contained a marginally higher percentage of females, although the difference between the two groups was not statistically significant (p > 0.05). Most female participants were over 50, indicating a likely postmenopausal status with diminished estrogen levels. Hence, these findings may not entirely represent a younger demographic of patients suffering from T2DM.
In most cases, GBS results from cholesterol crystallization, resulting in cholesterol stones. The mechanism is associated with both metabolic and digestive factors [Citation21]. Approximately 20% of the cholesterol in bile is derived from de novo synthesis in the liver, with the remainder from the cholesterol pool in the liver. Increased levels of total cholesterol may also raise the levels in the pool, leading to increased excretion through the bile duct and stone formation. Here, it was found that increased TC and TG levels in T2DM patients were independent risk factors for GBS. However, a study investigating the correlations between TBIL, DBIL, and TBA levels, reflecting liver and gallbladder function, and GBS incidence observed no significant differences between patients with GBS and those without. This may have been because these indicators only reflect the overall physiological function of the liver and gallbladder rather than cholesterol excretion and thus may not affect the incidence of stones.
The prevalence of GBS is acknowledged to be elevated in individuals afflicted with DM. Though many studies have endeavoured to unravel the pathogenesis of GBS, the underlying mechanism remains partially elusive. Numerous factors could potentially play a role. Individuals suffering from DM frequently exhibit concomitant autonomic nervous system dysfunction symptoms, which might result in compromised gallbladder contraction, thereby promoting the formation of stones [Citation22]. Second, DM may influence immune function, reducing immunity and increased susceptibility to bacterial infections. This may lead to gallbladder inflammation, altering the proportions of cholesterol, cholic acid, and phospholipids, accelerating cholesterol deposition, and promoting the formation of stones [Citation23]. Third, DM causes injury to red blood cells, increasing free bilirubin and potential stone aggregation. In addition to its chelation of calcium ions in the blood, bilirubin can form nuclei for stone formation [Citation24]. Fourth, DM is associated with endocrine lipid disorders, significantly dysregulated lipid metabolism, potentially leading to hyperlipoproteinemia, cholesterolemia, and hyperlipidemia and affecting cholesterol secretion, leading to increased cholesterol levels and free fatty acids and an increased likelihood of stone formation [Citation25]. Diabetic patients have an increased risk of hyperinsulinemia linked with stone formation [Citation26,Citation27].
This study analyzed the correlation between diabetes duration, HbA1c, FBG, and GBS. It was found that the incidence of GBS increased gradually with prolonged diabetes duration. Logistic regression also confirmed that the diabetes duration was a risk factor for GBS. This finding indicated that the development of GBS is related not only to T2DM but also to the diabetes duration and severity of the disease.
At the same time, we further analyzed the correlation between T2DM complications and GBS. Many studies have shown that older T2DM patients with chronic kidney disease (CKD) have a higher incidence of GBS [Citation28]. A recent study reported that age and eGFR were significantly linked to GBS and that a decline in eGFR was independently predictive of GBS [Citation29]. In this investigation, DN emerged as an independent predictor of GBS, marking the inaugural demonstration of an association between diabetic complications and GBS in T2DM patients. Further, the study reaffirmed the linkage between DPN and GBS. Neurological dysregulation in T2DM undermines the gallbladder’s contractile abilities, inflicts long-lasting damage to immune functionality, induces significant harm to red blood cells, and triggers endocrine imbalances, particularly those associated with lipid metabolism dysregulation.
We further constructed a nomogram using the risk factors for GBS identified by multifactorial analysis. The AUC of the nomogram for GBS was 0.704 (95%CI 0.656, 0.748), with a specificity of 90.34%, a sensitivity of 55.38%, and an accuracy of 86.83%. The model thus has good accuracy and specificity and can be used for the preliminary assessment of GBS risk in T2DM patients.
The study has several limitations. First, it was a retrospective investigation and several indicators, such as the levels of some inflammatory factors, were not included in the medical records. Further investigation is, therefore, necessary to determine whether the control of glucose and lipid levels can mitigate GBS development. Further prospective studies are also needed to address the pathological mechanisms for the association between T2DM and GBS. In the future, research with larger samples needs to be carried out. Lastly, the study did not clarify the pathophysiological mechanism responsible for the close relationship between T2DM and GBS. This should be addressed using animal studies in the future.
Conclusion
It was shown that patient age, BMI, diabetes duration, TC, TG, DN, and DPN independently predicted the development of GBS in T2DM patients. A nomogram for the prediction of GBS was constructed and found to be accurate, thus representing an effective tool for the early prediction of GBS in patients with T2DM.
Author contributions
TTW and QW conceived and designed research; QW and CSP collected data and conducted research; TTW analyzed and interpreted data; QW wrote the initial paper; TTW revised the paper; TTW had primary responsibility for the final content. All authors read and approved the final manuscript.
Disclosure statement
No potential conflict of interest was reported by the author(s).
Data availability
The datasets generated during the current study are available from the corresponding author upon reasonable request.
Additional information
Funding
References
- La Greca G, Barbagallo F, Sofia M, et al. Simultaneous laparoendoscopic rendezvous for the treatment of cholecystocholedocholithiasis. Surg Endosc. 2009;24(4):1–8.
- Reshetnyak V1. Concept of the pathogenesis and treatment of GBS. World J Hepatol. 2012;4(2):18–34.
- Tazuma S, Kanno K, Kubota K, et al. Report on the 2013 national GBS survey in Japan. J Hepatobiliary Pancreat Sci. 2015;22(5):392–395.
- Johner A, Raymakers A, Wiseman SM. Cost utility of early versus delayed laparoscopic cholecystectomy for acute cholecystitis. Surg Endosc. 2013;27(1):256–262.
- Elmehdawi RR, Elmajberi SJ, Behieh A, et al. Prevalence of gall bladder stones among type 2 diabetic patients in Benghazi Libya: a case-control study. Libyan J Med. 2008;4(1):27–30.
- Ahmed Omer Almobarak A, Jervase A, Abdelrahman F, et al. The prevalence of diabetes and metabolic syndrome and associated risk factors in Sudanese individuals with GBS: a cross sectional survey. Transl Gastroenterol Hepatol. 2020;5:14.
- Aune D, Vatten LJ. Diabetes mellitus and the risk of gallbladder disease: a systematic review and meta-analysis of prospective studies. J Diabetes Complications. 2016;30(2):368–373.
- Cojocaru C, Pandele GI. Clinial and paraclinical features in diabetic patients cholecystectomized for gallstones. Rev Med Chir Soc Med Nat Insi. 2010;114(4):998–1004.
- World Health Organization. Definition, diagnosis and classification of diabetes mellitus and its complications. Report of a WHO consultation. Part 1: diagnosis and classification of diabetes mellitus. Geneva: WHO 1999. 4–7.
- Stevens LA, Claybon MA, Schmid CH, et al. Evaluation of the chronic kidney disease epidemiology collaboration equation for estimating the glomerular filtration rate in multiple ethnicities. Kidney Int. 2011;79(5):555–562.
- Iorgulescu A, Turcu F, Iordache N. ERCP after bariatric surgery iterature review and case report. J Med Life. 2014;7(3):339–342.
- Bertolotti M, Mussi C, Pellegrini E, et al. Age-associated alterations inchoIestero homeostasis: evidence from a cross-sectional study in a Northern Italy population. Clin Interv Aging. 2014;9(9):425–432.
- Borzellino G, Rodella L, Saladino E, et al. Treatment for retrieved common bile duct stones during laparoscopic cholecystectomy. Arch Surg. 2010;145(12):1145–1149.
- Tommasi C, Bencini L, Bernini M, et al. Routine use of simultaneous laparoendoscopic approch in patient with confirmend gallbladder and bile duct stones:fit for laparoscopy fit for “rendezvous”. World J Surg. 2013;37(5):999–1005.
- Khoury T, Sbeit W. Diabetes mellitus is associated with a higher rate of acute cholangitis among patients with common bile duct stones: a retrospective study. Medicine. 2022;101(4):e28687.
- Tereshchenko IV, Kamenskikh YA, Kayushev PE. The concurrence of diabetes mellitus and gallstone disease. Ter Arkh. 2015;87(10):105–109.
- B, O, H, et al. Development and validation of a simple-to-use nomogram for predicting 5-, 10-, and 15-year survival in asymptomatic adults undergoing coronary artery calcium scoring. JACC Cardiovasc Imaging. 2018;11:450–458.
- Li W, Leng J, Liu H, et al. Nomograms for incident risk of post-partum type 2 diabetes in chinese women with prior gestational diabetes mellitus. Clin Endocrinol. 2019;90(3):417–424.
- Liao KF, Lai SW, Li CI, et al. Diabetes mellitus correlates with increased risk of pancreatic cancer: a population-based cohort study in Taiwan. J Gastroenterol Hepatol. 2012;27(4):709–713.
- A1-Bayati S, Kodayer S. GBS in a group of Iraqi patients with type 2 diabetes mellitus[J]. Sandi Med. 2012;33(4):412–417.
- Plesker R, Schulze H, Schuhmacher A. Gallstones in slender lorises (Lofts tardigradus). J Zoo Wildl Med. 2012;43(3):473–478.)[
- Sayeed U, Palepu J, Palepu J, et al. Population-based study to estimate prevalence and determine risk factors of gallbladder diseases in the rural gangetic basin of North India. HPB. 2011;13(2):117–125.
- Stinton LM, Myers RP, Shaffer EA. Epidemiology of gallstones. Gastroenterol Clin North Am. 2010;39(2):157–169.
- Brazzelli M, Cruickshank M, Kilonzo M, et al. Clinical effectiveness and cost effectiveness of cholecystectomy compared with observation/conservative management for preventing recurrent symptoms and complications in adults presenting with uncomplicated symptomatic gallstones or cholecystitis:a systematic review and economic evaluation. Health Technol Assess. 2014;18(55):1–102.
- Morris S, Gurusamy KS, Patel N, et al. Cost-effectiveness of early laparoscopic cholecystectomy for mild acute gallstone pancreatitis. Br J Surg. 2014;101(7):828–835.
- Pols TWH, Noriega LG, Nomura M, et al. The bile acid membrane receptor TGR%: a valuable metabolic target. Dig Dis. 2011;29(1):37–44.
- Halilbasic E, Claudel T, Trauner M. Bile acid transporters and regulatory nuclear receptors in the liver and beyond. J Hepatol. 2013;58(1):155–168.
- Kazama JJ, Kazama S, Koda R, et al. The risk of gallbladder stone formation is increased in patients with predialysis chronic kidney disease but not those undergoing chronic hemodialysis therapy. Nephron Clin Pract. 2009;111(3):c167–c172.
- Yılmaz Ü, İnci A, Özcan E, et al. Gallbladder stone prevalence and related factors in predialysis chronic kidney disease patients. Turk J Gastroenterol. 2022;33(9):760–766.