
Abstract
Background
Perfluoroalkyl and polyfluoroalkyl substances (PFASs) are widely used for industrial and commercial purposes and have received increasing attention due to their adverse effects on health.
Objective
To examine the relationship of serum PFAS and glycometabolism among adolescents based on the US National Health and Nutrition Examination Survey.
Methods
General linear regression models were applied to estimate the relationship between exposure to single PFAS and glycometabolism. Weighted quantile sum (WQS) regression models and Bayesian kernel machine regressions (BKMR) were used to assess the associations between multiple PFASs mixture exposure and glycometabolism.
Results
A total of 757 adolescents were enrolled. Multivariable regression model showed that Me-PFOSA-AcOH exposure was negatively associated with fasting blood glucose. WQS index showed that there was marginal negative correlation between multiple PFASs joint exposure and the homeostasis model of assessment for insulin resistance index (HOMA-IR) (β = −0.26, p < .068), and PFHxS had the largest weight. BKMR models showed that PFASs mixture exposure were associated with decreased INS and HOMA-IR, and the exposure-response relationship had curvilinear shape.
Conclusions
The increase in serum PFASs were associated with a decrease in HOMA-IR among adolescents. Mixed exposure models could more accurately and effectively reveal true exposure.
The detection rates of different PFAS contents in adolescent serum remained diverse.
Adolescent serum PFASs had negative curvilinear correlation with INS and HOMA-IR levels.
PFHxS had the highest weight in the associations between multiple PFASs and adolescent glycometabolism.
Key Messages
1. Introduction
Perfluoroalkyl and polyfluoroalkyl substances (PFASs) are emerging organic contaminants [Citation1]. Due to their thermal stability, chemical stability and high surface activity [Citation2]. PFASs are widely used in industrial and commercial fields, including fire extinguishing products, nonstick pot coatings, food packaging, outdoor clothing, carpet production and so on [Citation3]. At present, more than 5000–10,000 individual PFASs have been identified and these include PFAS synthesized for industrial purposes as well as PFASs that are by-products and/or transformation products of other PFASs. Humans are exposed to PFASs either directly or indirectly through diet, drinking water and packaged food. Upon entering the body, the vast majority of PFAS that have been studied to date appear to combine with proteins in the liver and blood, accumulate in the blood and highly perfused organs and are not metabolized or otherwise transformed [Citation4]. Among adolescents aged 12–15 years, the detection rate of PFASs reached 94% [Citation5]. It has been reported that perfluorooctanoic acid (PFOA), perfluorooctane sulphonate (PFOS), perfluorononanoic acid (PFNA) and perfluorohexane sulphonic acid (PFHxS) have been widely detected in children [Citation6–8], with an average half-life of 3.5–7.3 years [Citation9,Citation10]. Due to the high detection rate and long half-life, the health problems associated with PFAS exposure have gradually attracted international attention. Countries around the world have taken measures to reduce PFAS use and release. However, due to their environmental persistence, long-distance migration and bioaccumulation, PFASs are still widely present in various environmental samples and human serum.
Population-based epidemiological studies have provided some evidence for the relationship between several common PFASs in humans and blood glucose levels. A study based on 981 pregnant women in Shanghai, China, found that PFAS exposure was associated with an increased risk of elevating 1-h plasma glucose (1 h-PG) [Citation11]. A study of obese Spanish children showed that increased serum concentrations of PFOA and PFHxS led to a significant increase in 2-h postprandial serum glucose levels [Citation12]. Rodent studies have also shown that PFAS exposure may disrupt the balance of glucose metabolism and affect body weight [Citation13,Citation14]. However, these studies evaluated the association between each PFAS and glycometabolism separately based on single-exposure models. In addition, mice exposed to PFASs tend to suffer from impaired glucose homeostasis, a result of a negatively regulated protein kinase B (PKB) pathway by PFASs in white adipose tissue, which gives rise to increased glucose, decreased insulin and insulin resistance [Citation15].
Based on a cross-sectional epidemiological survey from the US National Health and Nutrition Examination Survey (NHANES) database, we investigated the association between PFASs and glycometabolism in American adolescents by combining single exposure and mixed exposure models. We aimed to identify the types of PFASs that are associated with a higher risk of affecting glycometabolism. Our study a provides a theoretical basis for the formulation and improvement of environmental endocrine disruptors measurement standards and the strengthening of PFAS environmental risk management and control policies.
2. Methods
2.1. Study population
NHANES is a national cross-sectional survey initiated by the National Center for Health Statistics at the Centers for Disease Control and Prevention (CDC) in the United States [Citation16]. A multistage random sampling design was used for a survey cycle every two years to obtain information on the health and nutritional status of adults and children in the United States. The survey is unique in that it combines interviews with physical examinations, with the interview component covering demographic, socioeconomic, diet and health-related questions. The physical examination included physiological measurement and laboratory examination. The NHANES protocol was approved by the Ethics Review Committee of the National Center for Health Statistics and written informed consent was collected from all participants. The NHANES is a well-known public database that can be downloaded for free from the official website (https://www.cdc.gov/nchs/nhanes/).
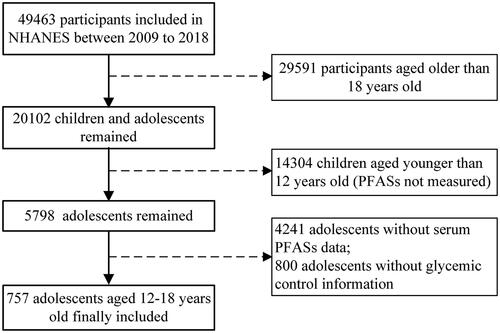
In this study, adolescents aged 12–18 who had participated in NHANES between 2009 and 2018 were included, and their data were collected, including demographic informatics, physical examination and biochemical examination. We used five consecutive investigation cycles of NHANES data from 2009–2010 to 2017–2018. Exclusion criteria included individuals who did not have serum PFASs measured and individuals who did not have fasting glucose, insulin, or glycosylated haemoglobin levels measured. Ultimately, 757 adolescents aged 12–18 years were included in the analysis ().
Figure 1. Flow chart of study screening.
2.2. Serum PFAS measurements
Since the NHANES began to detect PFAS concentrations in participants in 2009–2010, the types of PFAS measured in each subsequent investigation cycle were slightly different. We selected the types of PFAS that were available in each cycle, namely, perfluorodecanoic acid (PFDeA), PFHxS, 2-(N-methyl-perfluorooctane sulphonamido)-acetic acid (Me-PFOSA-AcOH), PFNA and perfluoroundecanoic acid (PFUA). Phlebotomists collected blood samples from participants at mobile examination centres (MECs). PFASs were quantitatively detected by online solid phase extraction coupled to high-performance liquid chromatography-turbo ion spray ionization-tandem mass spectrometry (online SPE-HPLC-TIS-MS/MS). Based on the guidelines, we assigned the value of serum PFAS concentrations below the limit of detection (LOD) as the LOD divided by the square root of 2. The laboratory protocol for detecting serum PFAS is available from the official website of NHANES [Citation17].
2.3. Assessment of glycometabolism
In this study, the main outcomes that we were interested in included fasting blood glucose (FBG), insulin (INS), homeostasis model of assessment for insulin resistance index (HOMA-IR) and glycosylated haemoglobin (GHB). Specimens were stored at −70 °C until analysed. FBG testing was performed in the Diabetes Diagnostic Laboratory University of Missouri 1 Hospital. Plasma samples were studied and analysed using a Roche/Hitachi Cobas C chemical analyser-C311. INS levels were measured in serum samples using the Tosoh Bioscience AIA-900 method. The GHB level was analysed using both the Tosoh G8 Glycohaemoglobin Analyser and Trinity Biotech Boronate Affinity HPLC. The average relative error of the two instruments for detecting GHB is 0.5% (range − 4.0% ∼ 5.2%), which is considered acceptable.
2.4. Covariates
Covariates considered in the analyses included age, gender (male, female), race (Mexican American, other Hispanic, non-Hispanic White, non-Hispanic Black, other Race-including multi-racial), number of family members (≤3, 4–5, >5), annual household income ($0 to $24,999, $25,000 to $74,999, $75,000 and over) and body mass index (BMI; kg/m2).
2.5. Statistical analysis
The quantitative data are expressed as the mean ± standard deviation, and qualitative data are expressed as the frequency (proportion). PFAS exposure levels varied widely among individuals and showed severely skewed distributions, so the data were log-transformed to correct for skewness [Citation12]. To measure the association between the five PFASs and glycometabolism, we combined different statistical methods, including linear regression, weighted quantile sum (WQS) regression and Bayesian kernel machine regression (BKMR), and comprehensively considered their characteristics to jointly explain the results. First, multiple linear regressions were used to evaluate the associations between each PFAS and FBG, INS, HOMA-IR and GHB. Model 1 was the unadjusted model, and model 2 was further adjusted for potential confounding factors.
In addition, the WQS was used to comprehensively evaluate the relationship between multiple PFASs and outcome variables. The WQS regression analysis estimated the individual’s overall exposure level, which was derived from the weighting of different chemicals to outcome associations and the weighting of exposure concentrations [Citation18]. It is useful not only for analysing the overall exposure to a series of highly correlated environmental chemicals but also for exploring the types of chemicals that have the greatest impacts on the outcome. Each chemical was divided into four groups based on the exposure concentration. The score of each group was given by q, and qi = 0, 1, 2 and 3 represented exposure levels ranging from 1 to 4. The scores of each chemical were weighted, and the WQS index values of all the chemicals were eventually obtained, reflecting the overall burden of exposure [Citation19,Citation20]. To improve the reliability of the results, the data were randomly divided into two datasets: 40% in the training dataset and 60% in the verification dataset. The weights of various PFASs were calculated in the training dataset, and the WQS scores were calculated in the validation dataset to explore the association between WQS scores and glycometabolism.
Finally, we used the BKMR model to assess the joint effect of five PFASs on glycometabolism [Citation21]. The core of the BKMR model is kernel machine regression (KMR), also known as Gaussian process regression, which uses machine learning algorithms to identify nonlinear and nonadditive relationships between chemicals and outcomes [Citation22]. Before the BKMR model analysis, the chemicals were assigned into three groups based on the value of the correlation coefficient and similar exposure sources [Citation23,Citation24], in which PFDeA, PFHxS and PFUA were divided into group 1, and Me-PFOSA-AcOH and PFNA were group 2 and group 3, respectively. The five PFASs in the analysis were highly correlated, so we applied the Markov chain Monte Carlo algorithm with 10,000 iterations of the hierarchical variable selection method [Citation25]. All analyses were performed with R Studio (Version 4.1.1). WQS and BKMR were calculated by the R packages ‘gWQS’ (version 3.0.4) and ‘BKMR’ (version 0.2.0), respectively.
It is suggested that the samples of the NHANES should be weighted to reduce the selection bias resulting from age, gender and ethnic subgroups. In this case, we used unweighted estimation in the mixed exposure model because the demographic information used to calculate the sample weight was considered, which is also consistent with the previous recommendation [Citation25,Citation26].
2.6. Subgroup analysis
Compared with normal-weight adolescents, PFASs may have different effects on glycometabolism in overweight and obese adolescents. Therefore, based on the United States Centers for Disease Control and Prevention’s recommended BMI ranges for children and adolescents of different ages and genders, we divided participants into normal-weight (n = 417) and overweight or obese (n = 340) adolescents using a mixed exposure model for subgroup analysis. After adjusting for the same covariates, the association between PFASs and glycometabolism was examined by subgroup analysis through mixed exposure approaches. In addition, participants were divided into high-, middle- and low-exposure groups based on the concentration of PFAS to explore the association between different exposure levels and the outcomes of interest.
3. Results
3.1. Characteristics of participants
The average age of the adolescents was 14.95 ± 1.96 years old, including 400 males (52.84%) and 357 females (47.16%). Among all subjects, non-Hispanic White people accounted for the largest proportion (27.48%). The average BMI was 24.55 ± 5.6 kg/m2 for all children, among which 370 were overweight or obese, accounting for 44.8% ().
Table 1. Characteristics of adolescents in the NHANES, 2009–2018.
3.2. Distribution of serum PFASs
The percentiles, ranges and detection rates of serum concentrations of five PFASs are presented for all adolescents. The LODs of PFDeA, PFHxS, Me-PFOSA-AcOH, PFNA and PFUA were 0.10, 0.10, 0.08, 0.08 and 0.10 ng/mL, respectively. The detection rate of PFHxS and PFNA reached 99%, and the detection rate of PFUA at 33.3% was the lowest. Among the included PFASs, PFHxS had the highest concentration (median= 0.10 ng/mL) and the largest range (LOD-22.90 ng/mL), while PFUA had the lowest exposure level (median = LOD) and the smallest range (LOD-1.70 ng/mL) (Table S1).
3.3. Correlation measurement between different PFASs
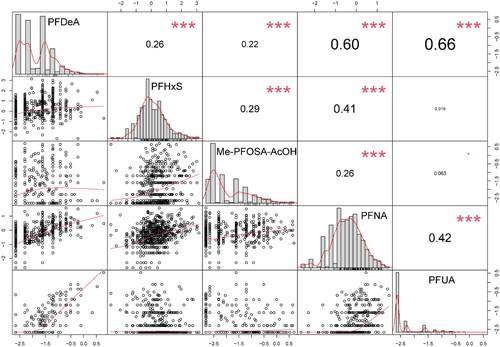
Spearman correlation analysis was conducted for the concentration of serum PFASs in adolescents. Most PFAS concentrations were positively correlated. In particular, PFDeA showed a strong correlation with PFUA and PFNA (correlation coefficients were 0.66 and 0.60, respectively). However, PFUA had no significant correlations with PFHxS nor Me-PFOSA-AcOH ().
Figure 2. Pairwise correlation of five serum PFASs in adolescents. All correlations were statistically significant (p value < .001).
3.4. Association between serum PFASs and glycometabolism
Multiple linear regression was performed for the relationship between each serum PFAS and FBG, INS, HOMA-IR and GHB. In the model adjusted for confounding factors, the level of serum Me-PFOSA-AcOH had a significant negative association with FBG in adolescents (β= −0.19, p = .006), while other PFAS exposures were not significantly associated with glycometabolism outcomes. In addition, PFDeA and PFHxS were associated with the reduction of HOMA-IR in the crude model but were not significant in the adjusted model ().
Table 2. Associations between each serum PFAS (ln-transformed) and the glycometabolism outcomes.
3.5. WQS regression analysis
WQS regression models were applied to analyse the associations between the mixture exposure of 5 PFASs and glycometabolism. The WQS index showed a marginal negative correlation between joint exposure with 5 PFASs and INS (β= −0.93, p = .066) and HOMA-IR (β= −0.41, p = .060) levels in the unadjusted models. Stable results were also presented in the adjusted model, where HOMA-IR decreased by 0.26 µlU/mL (95% CI: −0.54, 0.02) for each unit increase in the WQS index ().
Table 3. Associations between the WQS regression index and glycometabolism in NHANES, 2009–2018.
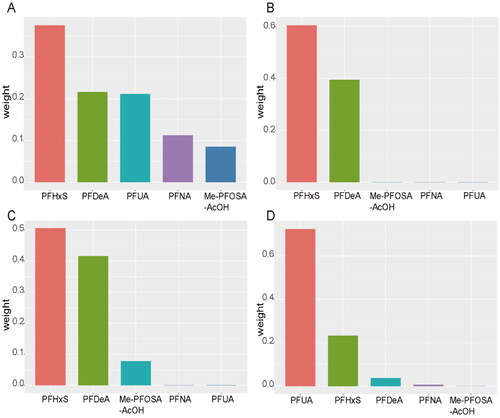
The WQS model also showed the weight of each PFAS, with PFHxS having the highest weight in the FBG, INS and HOMA-IR models (0.38, 0.60 and 0.50 respectively), followed by PFDeA (0.22, 0.40 and 0.42, respectively). It should be noted that the sum of the weights of PFHxS and PFDeA in the INS model was nearly 1, so the other three chemicals with small weights were barely represented. In terms of the effect on GHB, PFUA has the largest weight (weighted 0.72), followed by PFHxS (weighted 0.23) ().
Figure 3. The weight of each PFAS in the WQS model. The figure shows the weights of individual PFAS contributing to the overall effect. WQS model regression index weights for FBG: fasting blood glucose (A), INS: insulin (B), HOMA-IR: homeostasis model of assessment for insulin resistance index (C) and GHB: glycosylated haemoglobin (D).
3.6. BKMR model analysis
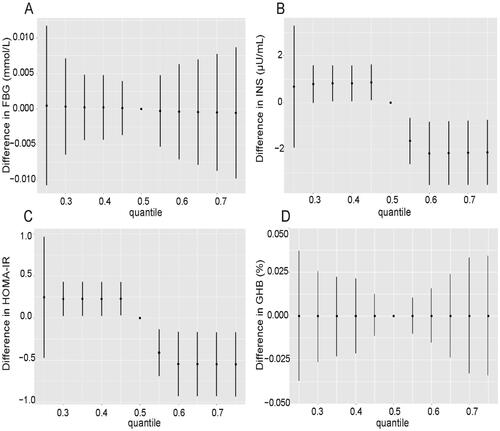
To explore the effect of collinearity and potential interactions between various PFASs on outcomes, we further used BKMR model analysis to fit the combined effect of mixed exposure to PFASs on glycometabolism-related indicators. First, the effect of each PFAS at median levels and the combined effect of all PFASs at higher exposure levels on blood glucose are shown. We found that exposures of combined PFASs at levels of 60 percentile and above were associated with significantly lower INS and HOMA-IR compared to median level exposures of individual PFAS, and the exposure-response relationship showed a broken line shape. There was no significant difference in the relationship between mixed PFAS exposure and FBG and GHB levels ().
Figure 4. Combined effects of mixed PFAS exposure on FBG: fasting blood glucose (A), INS: insulin (B), HOMA-IR: homeostasis model of assessment for insulin resistance index (C) and GHB: glycosylated haemoglobin (D) levels in the BKMR model. The relationship between PFASs at other percentiles and outcomes of interest was shown in comparison to the situation where all PFASs were kept at median levels.
In addition, we further identified which PFASs were associated with decreased insulin levels in the combined effect assessment. We fixed other PFASs at the median level and investigated whether individual PFASs had a nonlinear relationship with insulin levels. As shown in Figure S1 (B), there was a curved exposure-response relationship between PFDeA and insulin levels. PFNA showed a positive exposure-response relationship with INS, while for PFHxS and ME-PFOsa-ACOH, this relationship was negative (Figure S1).
Finally, to determine whether the exposure-response relationship between a certain PFAS and glycometabolism is affected by the concentration of a second PFAS, we maintained the concentration of all other PFASs at the median level and looked at the slope of the exposure-response curve. If the slope of the exposure-response curve changes at different concentrations of the second PFAS, an interaction is considered. Taking the upper right of Figure S2 (B) as an example, when all chemicals except PFUA and Me-PFOSA-AcOH were fixed at the median exposure level and the exposure level of Me-PFOSA-AcOH was fixed at the 10th, 50th and 90th percentiles, an exposure-response relationship was observed between PFUA and glucose control indicators. The results showed no significant interaction among the five PFASs (Figures S2 and S3).
3.7. Subgroup analysis
Furthermore, the associations between the mixed exposure of five PFASs and glycometabolism were investigated in normal-weight and obese children. The results showed that there was no significant difference between the WQS index and the outcomes of interest in normal-weight children. In obese children, we found that the WQS index was significantly correlated with the decrease in FBG, which showed relatively stable results before and after adjusting for covariates (Table S2). No significant effects were observed in BKMR models for either group (Figures S4 and S5).
Finally, INS and HOMA-IR in the medium- and high-exposure groups decreased significantly, with the low-exposure PFDeA group as the reference, and FBG and HOMA in the high exposure PFHxS group were significantly decreased. In addition, FBG in the middle exposure group of Me-PFOSA-AcOH decreased significantly. Overall, the results showed that the glycometabolism index showed a downward trend with the increase in PFAS exposure level (Table S3).
4. Discussion
In this study, multiple linear regression, WQS and BKMR models were combined to provide relevant evidence for the negative association between serum PFASs and INS and HOMA-IR in adolescents aged 12–18 years. More importantly, these correlations are not linear. Among them, PFDeA and PFHxS have a relatively large weight, indicating that they play an important role.
PFASs have been reported to bioaccumulate into organisms at various ecological levels and also have been detected in a high proportion of the human population. Some PFASs are known to be in breast milk, thus exposing humans starting in infancy [Citation27,Citation28]. Due to the relatively small body mass and blood volume of the child, PFASs were more concentrated per volume of serum during childhood and accumulated gradually as the child grows [Citation29]. From childhood to adolescence, individuals can be cumulatively exposed to PFASs through the living environment or drinking water and diet. It is well known that individuals in the early stage of life were most susceptible to adverse environmental influences, which could cause events that were not conducive to development [Citation30,Citation31]. This cross-sectional study using the NHANES database found that serum PFASs in children aged 12–18 years were associated with decreased HOMA-IR, contradicting most but not all studies. However, it was also consistent with the results of a cohort study, which found that higher concentrations of PFOA, PFOS and PFDeA were associated with lower HOMA-IR in eight-year-old children, especially in females [Citation32]. However, sex-stratified findings need to be further verified in populations with different characteristics [Citation33]. A disaster epidemiology study conducted in the United States, which matched children in areas with high PFAS contamination with controls, also detected an inverse relationship between PFHxS and insulin resistance [Citation34]. In addition, a population study aged 12–80 years based on the NHANES showed that there were positive associations between concentrations of PFOS, PFOA and PFNA and total and non-high-density cholesterol. However, the evidence of the relationship between PFAS and insulin resistance was inconsistent. For example, PFNA and insulin resistance showed a significant positive trend in adult females, while PFHxS showed a negative trend in adolescent females [Citation35].
We realized that the negative association we found between PFAS concentrations and insulin resistance in children could be occasional or residual confounding, so we performed multiple iterations of the analysis to correct for the statistical associations caused by chance, but its stable results pattern showed no possibility of spurious associations. We also considered the potential influence by including adolescents aged 12 to 18 with a high prevalence of obesity, nearly 40%, as well as the concentration distribution of PFASs. Studies have reported increased insulin resistance in adolescents [Citation36] and an association between PFAS concentrations and a delay in adolescence [Citation37], which may drive the reverse association between PFAS concentrations and HOMA-IR in adolescents. However, some studies have limited the analysis of preadolescent children and yielded similar results [Citation32]. Further confirmations will be made about the extent and direction of the association with metabolic status through well-designed controlled studies of PFAS exposure in early adulthood in the future.
The biological mechanisms associated with PFAS and insulin resistance are unclear, and most of our information was obtained from animal studies. PFASs have either harmful or beneficial effects on insulin sensitivity. On the harmful side, PFASs may increase the oxidative stress response and thus exacerbate insulin resistance [Citation38], which may be due to the structural homology between PFASs and some fatty acids in the human body, increasing the expression of genes related to fatty acid oxidation [Citation39,Citation40]. On the other hand, the information we obtained from animal studies shows that PFASs have an affinity for PPAR-α and act as agonists of these receptors. Even so, the degree of agonist effect is variable and depends on the specific compound detected [Citation41]. In addition, the affinity between PFASs and PPAR-γ has been demonstrated; exposure to PFASs may also trigger the expression of genes that store free fatty acids and regulate the transcription of various insulin-related genes by activating nuclear PPAR-γ and ultimately enhance insulin sensitivity [Citation42–44]. This mechanism is similar to thiazolidinediones, which are used in the treatment of type 2 diabetes [Citation34]. Although the findings of toxicological studies provide valuable insights, these findings are not directly applicable to humans, so further research is needed to clarify the underlying mechanisms.
Major strengths of this study include combining WQS regression analysis with the BKMR model to evaluate the effect of highly correlated mixed PFAS exposure on blood glycometabolism, which objectively reflects complex exposure in the real world [Citation25]. Moreover, it can visualize the potential nonlinear and nonadditive effects of PFAS mixtures, avoid the rough presentation of continuous exposure and reduce the deviation of evaluation. In our study, the WQS regression model robustly evaluated the multilinearity of PFASs and clearly showed the weight of the relationship between each chemical and the outcome of interest. Our results found that PFHxS and PFDeA were important chemicals associated with glycometabolism glycemic control. However, the WQS index is not yet able to assess the combined effect of exposure in different directions, so we introduced the BKMR model to further capture the exposure-response relationship and identify the interactions between the two chemicals, showing a nonlinear negative correlation between mixed PFAS exposure and insulin resistance. There were some limitations in our study. The major limitation of NHANES-related research is that although it is a national multilevel stratified cluster sampling survey, it has a cross-sectional design, and our results can show only correlation rather than causality. Secondly the laboratory test data are obtained from a single point in time, and any accidental misclassification may mask the real association. In addition, the family history and life behaviour variables of the included population were not considered, which may limit the power of our evidence to some extent. Finally, the high rate of overweight and obesity and the frequent occurrence of insulin resistance among American adolescents may lead to more challenges in regard to population extrapolation.
5. Conclusion
In summary, there is no evidence of adverse effects of PFAS exposure on glycometabolism in American adolescents. In this cross-sectional study, higher serum PFAS concentrations were associated with lower insulin resistance. Although this finding is biologically plausible, it is in contrast with previous literature about early life exposure to PFASs, and considering the high rates of obesity in the included population, our conclusions need to be treated with caution. Even so, we suggest strengthening PFAS environmental risk management of PFASs and taking preventive measures to reduce exposure and promote the health of children and adolescents.
Author contributions
The authors’ responsibilities were as follows: WY, RHB, XW, XNL: designed the research; QQZ, XNY: conducted the research; WY, RHB, YNS: analysed data and performed statistical analysis; WY, QQZ, RZY, CJJ: wrote the paper and explained the results; XW, XNL: had primary responsibility for final content, and all authors read and approved the final manuscript.
Supplemental Material
Download MS Word (2.5 MB)Disclosure statement
No potential conflict of interest was reported by the author(s).
Data availability statement
The data that support the findings of this study are openly available in NHANES - National Health and Nutrition Examination Survey Homepage at https://www.cdc.gov/nchs/nhanes/.
Additional information
Funding
References
- Sunderland EM, Hu XC, Dassuncao C, et al. A review of the pathways of human exposure to poly- and perfluoroalkyl substances (PFASs) and present understanding of health effects. J Expo Sci Environ Epidemiol. 2019;29(2):1–11. doi: 10.1038/s41370-018-0094-1.
- Steenland K, Winquist A. PFAS and cancer, a scoping review of the epidemiologic evidence. Environ Res. 2021;194:110690. doi: 10.1016/j.envres.2020.110690.
- Lindstrom AB, Strynar MJ, Libelo EL. Polyfluorinated compounds: past, present, and future. Environ Sci Technol. 2011;45(19):7954–7961. doi: 10.1021/es2011622.
- Haug LS, Huber S, Becher G, et al. Characterisation of human exposure pathways to perfluorinated compounds–comparing exposure estimates with biomarkers of exposure. Environ Int. 2011;37(4):687–693. doi: 10.1016/j.envint.2011.01.011.
- Zeng XW, Qian Z, Emo B, et al. Association of polyfluoroalkyl chemical exposure with serum lipids in children. Sci Total Environ. 2015;512-513:364–370. doi: 10.1016/j.scitotenv.2015.01.042.
- Mora AM, Oken E, Rifas-Shiman SL, et al. Prenatal exposure to perfluoroalkyl substances and adiposity in early and mid-childhood. Environ Health Perspect. 2017;125(3):467–473. doi: 10.1289/EHP246.
- Braun JM, Chen A, Romano ME, et al. Prenatal perfluoroalkyl substance exposure and child adiposity at 8 years of age: the HOME study. Obesity. 2016;24(1):231–237. doi: 10.1002/oby.21258.
- Worley RR, Moore SM, Tierney BC, et al. Per- and polyfluoroalkyl substances in human serum and urine samples from a residentially exposed community. Environ Int. 2017;106:135–143. doi: 10.1016/j.envint.2017.06.007.
- Cariou R, Veyrand B, Yamada A, et al. Perfluoroalkyl acid (PFAA) levels and profiles in breast milk, maternal and cord serum of French women and their newborns. Environ Int. 2015;84:71–81. doi: 10.1016/j.envint.2015.07.014.
- Olsen GW, Burris JM, Ehresman DJ, et al. Half-life of serum elimination of perfluorooctanesulfonate, perfluorohexanesulfonate, and perfluorooctanoate in retired fluorochemical production workers. Environ Health Perspect. 2007;115(9):1298–1305. doi: 10.1289/ehp.10009.
- Ren Y, Jin L, Yang F, et al. Concentrations of perfluoroalkyl and polyfluoroalkyl substances and blood glucose in pregnant women. Environ Health. 2020;19(1):88. doi: 10.1186/s12940-020-00640-8.
- Alderete TL, Jin R, Walker DI, et al. Perfluoroalkyl substances, metabolomic profiling, and alterations in glucose homeostasis among overweight and obese Hispanic children: a proof-of-concept analysis. Environ Int. 2019;126:445–453. doi: 10.1016/j.envint.2019.02.047.
- Mariussen E. Neurotoxic effects of perfluoroalkylated compounds: mechanisms of action and environmental relevance. Arch Toxicol. 2012;86(9):1349–1367. doi: 10.1007/s00204-012-0822-6.
- Zeng HC, Zhang L, Li YY, et al. Inflammation-like glial response in rat brain induced by prenatal PFOS exposure. Neurotoxicology. 2011;32(1):130–139. doi: 10.1016/j.neuro.2010.10.001.
- Du G, Sun J, Zhang Y. Perfluorooctanoic acid impaired glucose homeostasis through affecting adipose AKT pathway. Cytotechnology. 2018;70(1):479–487. doi: 10.1007/s10616-017-0164-6.
- NHANES - About the National Health and Nutrition Examination Survey [Internet]. Centers for Disease Control and Prevention. Centers for Disease Control and Prevention; 2021 [cited 2022 Jun 18]. Available from: https://www.cdc.gov/nchs/nhanes/about_nhanes.htm
- Centers for Disease Control and Prevention. [cited 2021 Jan 21]. Available from: https://wwwn.cdc.gov/nchs/data/nhanes/2017-2018/labmethods/PFAS-J-MET-508.pdf
- Carrico C, Gennings C, Wheeler DC, et al. Characterization of weighted quantile sum regression for highly correlated data in a risk analysis setting. J Agric Biol Environ Stat. 2015;20(1):100–120. doi: 10.1007/s13253-014-0180-3.
- Czarnota J, Gennings C, Colt JS, et al. Analysis of environmental chemical mixtures and non-Hodgkin lymphoma risk in the NCI-SEER NHL study. Environ Health Perspect. 2015;123(10):965–970. doi: 10.1289/ehp.1408630.
- Czarnota J, Gennings C, Wheeler DC. Assessment of weighted quantile sum regression for modeling chemical mixtures and cancer risk. Cancer Inform. 2015;14(Suppl 2):159–171. doi: 10.4137/CIN.S17295.
- Bobb JF, Valeri L, Claus Henn B, et al. Bayesian kernel machine regression for estimating the health effects of multi-pollutant mixtures. Biostatistics. 2015;16(3):493–508. doi: 10.1093/biostatistics/kxu058.
- Wang X, Sun X, Zhang Y, et al. Identifying a critical window of maternal metal exposure for maternal and neonatal thyroid function in China: a cohort study. Environ Int. 2020;139:105696. doi: 10.1016/j.envint.2020.105696.
- Andaluri G, Manickavachagam M, Suri R. Plastic toys as a source of exposure to bisphenol-A and phthalates at childcare facilities. Environ Monit Assess. 2018;190(2):65. doi: 10.1007/s10661-017-6438-9.
- Czaplicka M. Sources and transformations of chlorophenols in the natural environment. Sci Total Environ. 2004;322(1-3):21–39. doi: 10.1016/j.scitotenv.2003.09.015.
- Zhang Y, Dong T, Hu W, et al. Association between exposure to a mixture of phenols, pesticides, and phthalates and obesity: comparison of three statistical models. Environ Int. 2019;123:325–336. doi: 10.1016/j.envint.2018.11.076.
- Blount BC, Pirkle JL, Osterloh JD, et al. Urinary perchlorate and thyroid hormone levels in adolescent and adult men and women living in the United States. Environ Health Perspect. 2006;114(12):1865–1871. doi: 10.1289/ehp.9466.
- Gyllenhammar I, Benskin JP, Sandblom O, et al. Perfluoroalkyl acids (PFAAs) in serum from 2-4-month-old infants: influence of maternal serum concentration, gestational age, breast-feeding, and contaminated drinking water. Environ Sci Technol. 2018;52(12):7101–7110. doi: 10.1021/acs.est.8b00770.
- VanNoy BN, Lam J, Zota AR. Breastfeeding as a predictor of serum concentrations of per- and polyfluorinated alkyl substances in reproductive-aged women and young children: a rapid systematic review. Curr Environ Health Rep. 2018;5(2):213–224. doi: 10.1007/s40572-018-0194-z.
- Koponen J, Winkens K, Airaksinen R, et al. Longitudinal trends of per- and polyfluoroalkyl substances in children’s serum. Environ Int. 2018;121(Pt 1):591–599. doi: 10.1016/j.envint.2018.09.006.
- Symonds ME, Sebert SP, Hyatt MA, et al. Nutritional programming of the metabolic syndrome. Nat Rev Endocrinol. 2009;5(11):604–610. doi: 10.1038/nrendo.2009.195.
- Fenton SE, Ducatman A, Boobis A, et al. Per- and polyfluoroalkyl substance toxicity and human health review: current state of knowledge and strategies for informing future research. Environ Toxicol Chem. 2021;40(3):606–630. doi: 10.1002/etc.4890.
- Fleisch AF, Rifas-Shiman SL, Mora AM, et al. Early-Life exposure to perfluoroalkyl substances and childhood metabolic function. Environ Health Perspect. 2017;125(3):481–487. doi: 10.1289/EHP303.
- Friend A, Craig L, Turner S. The prevalence of metabolic syndrome in children: a systematic review of the literature. Metab Syndr Relat Disord. 2013;11(2):71–80. doi: 10.1089/met.2012.0122.
- Koshy TT, Attina TM, Ghassabian A, et al. Serum perfluoroalkyl substances and cardiometabolic consequences in adolescents exposed to the world trade center disaster and a matched comparison group. Environ Int. 2017;109:128–135. doi: 10.1016/j.envint.2017.08.003.
- Nelson JW, Hatch EE, Webster TF. Exposure to polyfluoroalkyl chemicals and cholesterol, body weight, and insulin resistance in the general U.S. population. Environ Health Perspect. 2010;118(2):197–202. doi: 10.1289/ehp.0901165.
- Vryonidou A, Paschou SA, Muscogiuri G, et al. Mechanisms in endocrinology: metabolic syndrome through the female life cycle. Eur J Endocrinol. 2015;173(5):R153–R163. doi: 10.1530/EJE-15-0275.
- Lopez-Espinosa MJ, Fletcher T, Armstrong B, et al. Association of perfluorooctanoic acid (PFOA) and perfluorooctane sulfonate (PFOS) with age of puberty among children living near a chemical plant. Environ Sci Technol. 2011;45(19):8160–8166. doi: 10.1021/es1038694.
- Karpe F, Dickmann JR, Frayn KN. Fatty acids, obesity, and insulin resistance: time for a reevaluation. Diabetes. 2011;60(10):2441–2449. doi: 10.2337/db11-0425.
- Guruge KS, Yeung LW, Yamanaka N, et al. Gene expression profiles in rat liver treated with perfluorooctanoic acid (PFOA). Toxicol Sci. 2006;89(1):93–107. doi: 10.1093/toxsci/kfj011.
- Hu W, Jones PD, Celius T, et al. Identification of genes responsive to PFOS using gene expression profiling. Environ Toxicol Pharmacol. 2005;19(1):57–70. doi: 10.1016/j.etap.2004.04.008.
- Wolf CJ, Schmid JE, Lau C, et al. Activation of mouse and human peroxisome proliferator-activated receptor-alpha (PPARα) by perfluoroalkyl acids (PFAAs): further investigation of C4-C12 compounds. Reprod Toxicol. 2012;33(4):546–551. doi: 10.1016/j.reprotox.2011.09.009.
- Vanden Heuvel JP, Thompson JT, Frame SR, et al. Differential activation of nuclear receptors by perfluorinated fatty acid analogs and natural fatty acids: a comparison of human, mouse, and rat peroxisome proliferator-activated receptor-alpha, -beta, and -gamma, liver X receptor-beta, and retinoid X receptor-alpha. Toxicol Sci. 2006;92(2):476–489. doi: 10.1093/toxsci/kfl014.
- Takacs ML, Abbott BD. Activation of mouse and human peroxisome proliferator-activated receptors (alpha, beta/delta, gamma) by perfluorooctanoic acid and perfluorooctane sulfonate. Toxicol Sci. 2007;95(1):108–117. doi: 10.1093/toxsci/kfl135.
- Ojo AF, Peng C, Ng JC. Combined effects and toxicological interactions of perfluoroalkyl and polyfluoroalkyl substances mixtures in human liver cells (HepG2). Environ Pollut. 2020;263(Pt B):114182. doi: 10.1016/j.envpol.2020.114182.