
Abstract
Background
Papillary thyroid cancer (PTC) is the most common endocrine malignant tumour. The purpose of this study was to explore the potential molecular mechanism of circRNA regulating immune-related mRNA through sponge miRNA in the occurrence and immune regulation of PTC.
Methods
All data were downloaded from public databases, such as GEO, Immport and TCGA. Differentially expressed (DE) mRNAs (DEmRNAs), DEmiRNAs and DEcircRNAs were identified using metaMA and limma packages. Subsequently, immune-related DEmRNAs were screened, and circRNA-miRNA-mRNA (ceRNA) regulatory network was constructed. In addition, functional annotation, protein-protein interaction (PPI) network construction, immune cell infiltration analysis and Pearson correlation analysis were performed. Finally, qRT-PCR validation and cell experiments were also performed.
Results
In total, 2962 DEmRNAs, 78 DEmiRNAs and 51 DEcircRNAs were obtained. Subsequently, 195 immune-related DEmRNAs were obtained based on Immport database. Cytokine-cytokine receptor interaction was the only signalling pathway obtained in KEGG analysis. Then, 8 hub immune-related DEmRNAs were identified based on PPI network and CytoHubba plug-in. Subsequently, ceRNA sub-network containing hub immune-related DEmRNAs was extracted from ceRNA regulatory network. In ceRNA sub-network, hsa_circ_0082182-hsa-miR-18b-5p-FGF1/PDGFC, hsa_circ_0016404-hsa-miR-1275-FGF1/CTSB/IL13RA1, hsa_circ_0070100-hsa-miR-27a-3p/hsa-miR-27b-3p-TGFBR3, hsa_circ_0060055/hsa_circ_0038718-hsa-miR-150-3p-CXCL14, hsa_circ_0030427/hsa_circ_0002917-hsa-miR-22-3p-BMP7 and hsa_circ_0030427/hsa_circ_0002917-hsa-miR-125a-5p-LIFR axes were identified. Moreover, FGF1, PDGFC, CTSB, IL13RA1, TGFBR3, CXCL14, BMP7, LIFR, hsa-miR-125a-5p, hsa-miR-1275, hsa-miR-150-3p, hsa-miR-18b-5p and hsa-miR-27b-3p were also found to have good diagnostic accuracy and may be potential novel diagnostic markers for PTC. XCell analysis showed that the levels of immune cell infiltration (including Tregs, HSC, DC and Monocytes) were significantly different between the PTC and the control groups. Knockdown of the expression of hsa_circ_0082182 significantly inhibits the activity, proliferation, migration and invasion of TPC-1 cells.
Conclusion
Several circRNA-miRNA-mRNA axes identified in this study may be related to the occurrence, progression and survival of PTC. This lays a theoretical foundation for further understanding the molecular mechanism of PTC, and also contributes to clinical management and research.
KEY MESSAGES
In ceRNA sub-network, hsa_circ_0082182-hsa-miR-18b-5p-FGF1/PDGFC, hsa_circ_0016404-hsa-miR-1275-FGF1/CTSB/IL13RA1, hsa_circ_0070100-hsa-miR-27a-3p/hsa-miR-27b-3p-TGFBR3, hsa_circ_0060055/hsa_circ_0038718-hsa-miR-150-3p-CXCL14, hsa_circ_0030427/hsa_circ_0002917-hsa-miR-22-3p-BMP7 and hsa_circ_0030427/hsa_circ_0002917-hsa-miR-125a-5p-LIFR axes were identified.
FGF1, PDGFC, CTSB, IL13RA1, TGFBR3, CXCL14, BMP7, LIFR, hsa-miR-125a-5p, hsa-miR-1275, hsa-miR-150-3p, hsa-miR-18b-5p and hsa-miR-27b-3p were also found to have good diagnostic accuracy and may be potential novel diagnostic markers for PTC.
Knockdown the expression of hsa_circ_0082182 significantly inhibits the activity, proliferation, migration and invasion of TPC-1 cell.
1. Introduction
Thyroid cancer (TC) is the most common endocrine malignant tumor, of which 80% are papillary thyroid cancer (PTC) [Citation1]. The increase in the incidence of TC is almost entirely due to the increase in PTC [Citation2]. Total thyroidectomy and lobectomy remain the primary surgical treatments [Citation3]. Although the majority of PTC patients have good overall survival after treatment, PTC is still worrying because of the recurrence rate of nearly 30% and the cause-specific mortality rate of 8.6% within 30 years [Citation4]. At present, the complex molecular mechanism of PTC remains unclear. In order to find novel molecular markers and therapeutic targets, it is necessary to constantly explore the potential molecular mechanism of PTC to help better patient management.
Circular RNAs (circRNAs) exist in the form of closed-loop RNA and lack polyadenosylated tail compared with messenger RNA [Citation5]. CircRNAs can act as a molecular sponge for microRNAs (miRNAs) to regulate mRNA expression [Citation6]. miRNAs are a class of small (approximately 22 nt) non-coding RNAs [Citation7]. Currently, circRNAs are a potential new strategy for treating TC [Citation8]. Hsa_circ_NRIP1 promotes PTC progression by sponging hsa-miR-195-5p and modulating the P38 MAPK and JAK/STAT pathways [Citation9]. A study showed that hsa_circ_0058124 promotes tumorigenesis and invasion of PTC via NOTCH3/GATAD2A axis [Citation10]. Hsa_circ_ITCH sponge hsa-miR-22-3p up-regulates the expression of CBL and may regulate the proliferation, invasion and apoptosis of PTC cells through the CBL/β-catenin pathway [Citation11]. Therefore, exploring the potential molecular mechanism of PTC is beneficial to the diagnosis and treatment of patients.
Avoidance of immune destruction is a distinct feature of cancer [Citation12]. The aetiology and progression of PTC are also mediated by the immune system [Citation13]. TREM1 may promote the immunosuppressive microenvironment of PTC by regulating the infiltration of immune cells in the immune microenvironment [Citation14]. High THBS1 expression leads to a poor prognosis of PTC and inhibits anti-tumor immune microenvironment [Citation15]. In view of this, it is necessary to identify immune-related differentially expressed (DE) RNAs (DEmRNAs) in PTC to further explore the underlying molecular mechanisms. In this study, immune-related DEmRNAs, DEmiRNAs and DEcircRNAs in PTC were identified based on the GEO database. To our knowledge, the regulatory mechanisms of circRNA-miRNA-mRNA associated with PTC have rarely been reported. Therefore, a circRNA-miRNA-mRNA (ceRNA) regulatory network was constructed based on DEmRNA s, DEmiRNAs and DEcircRNAs to identify the potential molecular immunomodulatory mechanisms mediated by circRNA-miRNA-mRNA.
2. Materials and methods
2.1. Datasets retrieval
Retrieve and download the expression data of mRNA, miRNA and circRNA from the GEO database (http://www.ncbi.nlm.nih.gov/geo/). Appropriate datasets were selected according to the following criteria: (1) dataset must be genome-wide mRNA/miRNA/circRNA transcriptome data; (2) data were derived from PTC tissues (disease group) and paracancer tissues (control group); (3) both raw and standardized datasets were considered. Ultimately, 7 datasets were obtained, including 3 mRNA datasets, 2 miRNA datasets and 2 circRNA datasets ().
Table 1. Detailed information of the datasets selected in this study.
2.2. Differential expression analysis
GSE60542, GSE29265 and GSE3467 datasets were downloaded from the GEO database. The probe corresponding to multiple mRNA was removed. The mRNA corresponding to multiple probes only retained the probe with the largest average expression. Subsequently, the mRNAs in GSE60542, GSE29265 and GSE3467 datasets were intersected to obtain 20281 common mRNAs. At the same time, GSE63511, GSE113629, GSE93522 and GSE173299 datasets were also downloaded from GEO. The probe was one-to-one corresponded with miRNA ID and circRNA ID. Subsequently, 2522 common miRNAs and 2876 common circRNAs were obtained. After the scale standardization of datasets, datasets were merged and batch effects were removed through the ComBat function of the sva package. The metaMA and limma packages were used to identify DEmRNAs, DEmiRNAs and DEcircRNAs. |Combined.effect sizes (ES)|>1 and false discovery rate (FDR)<0.05 were the screening criteria for differential expression [Citation16]. Immune-related mRNAs were downloaded from the Immport database (https://www.immport.org/shared/home). Then, immune-related mRNAs and DEmRNAs were intersected to obtain immune-related DEmRNAs.
2.3. Construction of ceRNA regulatory network
The CircBank database (http://www.circbank.cn/) was used to predict the targeted miRNAs of DEcircRNAs. The predicted miRNAs intersected with DEmiRNAs to obtain negatively regulated circRNA-miRNA targeting pairs. The miRWalk database (http://mirwalk.umm.uni-heidelberg.de/interactions/) was used to predict the targeted mRNAs of DEmiRNAs. The miRNA-mRNA targeting relationship has been verified in at least one database (TargetScan, miRDB, and MiRTarBase). The predicted mRNAs was intersected with immune-related DEmRNAs to obtain negatively regulated miRNA-mRNA targeting pairs. Subsequently, the circRNA-miRNA targeting relationship pairs and the miRNA-mRNA targeting relationship pairs were fused to construct the ceRNA regulatory network.
2.4. Functional annotation of immune-related DEmRNAs in ceRNA regulatory network
To understand the biological functions involved in immune-related DEmRNAs, the GO and the KEGG functions were performed based on the David database (https://david.ncifcrf.gov/tools.jsp). The screening criteria were FDR < 0.05. GO annotation includes BP, CC and MF.
2.5. Identification of hub immune-related DEmRNAs
In order to understand the interaction between immune-related DEmRNAs in ceRNA regulatory network, PPI network was constructed based on STRING database. The results obtained based on STRING database were imported into Cytoscape software, and degree, EPC, MCC and DMNC in CytoHubba plug-in were used to screen hub immune-related DEmRNAs. Subsequently, ceRNA sub-network containing hub immune-related DEmRNAs was extracted from ceRNA regulatory network for separate display.
2.6. Immune cell infiltration
XCell converts gene expression profiles into abundance scores based on ssGSEA method to show the distribution of immune cells in each sample [Citation17]. Subsequently, Pearson correlation was used to calculate the correlation between hub immune-related DEmRNAs and differential immune cell infiltration. In addition, the CIBERSORT method also was used to evaluate the proportion of various immune cell types in the sample.
2.7. Expression verification and ROC curve analysis
To further verify the expression of DEmiRNAs and hub immune-related DEmRNAs in the sub-network, electronic expression verification was performed based on TCGA database (https://tcga-data.nci.nih.gov/tcga/). Meanwhile, ROC analysis was also performed based on TCGA database. In ROC analysis, area under the curve (AUC) is often used to assess diagnostic accuracy. The closer the curve is to the upper left corner, the larger the AUC, and the better the ability of the test to distinguish between diseased and non-diseased [Citation18]. AUC > 0.6 indicates sufficient diagnostic accuracy.
2.8. In vitro validation
Based on the above bioinformatics integration analysis results, FGF1, hsa-miR-18b-5p, hsa-miR-1275, hsa_circ_0082182 and hsa_circ_0016404 were further validated in vitro. Cancer and paracancerous tissues were collected from 13 PTC patients for qRT-PCR to verify the expression of FGF1, hsa-miR-18b-5p, hsa-miR-1275, hsa_circ_0082182 and hsa_circ_0016404. The clinical information of 13 PTC patients is shown in Table S1. Subsequently, TPC-1 cell was also selected to knockdown hsa_circ_0082182 to further verify its function. QRT-PCR was used to detect the expression level of hsa_circ_0082182 in the knockdown cells to screen the most effective interference target. The internal reference gene used for qRT-PCR validation of both tissue and cell samples was GAPDH. All primers used in qRT-PCR are shown in Table S2. The TPC-1 cells were divided into normal control (NC), Si-hsa_circ_0082182-1 (knockdown group) and Si-hsa_circ_0082182-2 (knockdown group) groups. Cell counting kit-8 (CCK-8) kit was used to detect the activity of cancer cell in NC, Si-hsa_circ_0082182-1 and Si-hsa_circ_0082182-2 groups at 0, 24, 48 and 72 h. Plate clone proliferation experiment was used to determine the proliferation of TPC-1 cells in NC, Si-hsa_circ_0082182-1 and Si-hsa_circ_0082182-2 groups. Images were taken with a camera after staining with 0.1% crystal violet staining solution. Image J statistical analysis of the number of cell clones formed. The migration and invasion abilities of TPC-1 cell in NC, Si-hsa_circ_0082182-1 and Si-hsa_circ_0082182-2 groups were also verified by transwell assay. In addition, the dual-luciferase reporter assay was used to investigate the association between hsa-miR-18b-5p and hsa_circ_0082182 or FGF1. Dual-luciferase reporter assay kit was adopted to examine the luciferase activity after 48 h of co-transfection.
3. Results
3.1. Identification of immune-related DEmRNAs, DEmiRNAs and DEcircRNAs
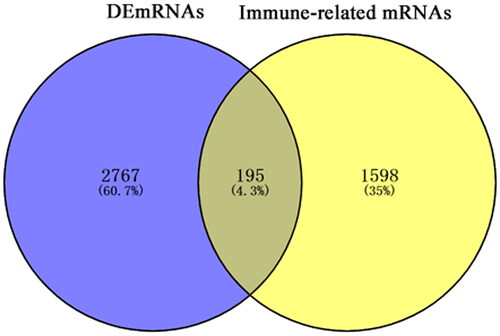
In total, 2962 DEmRNAs (1372 up-regulated, 1590 down-regulated), 78 DEmiRNAs (47 up-regulated, 31 down-regulated) and 51 DEcircRNAs (32 up-regulated, 19 down-regulated) were obtained based on |Combined.ES|>1 and FDR < 0.05. Heatmaps of the top 100 DEmRNAs, all DEmiRNAs and all DEcircRNAs are shown in . Subsequently, 1793 immune-related mRNAs obtained from the Immport database interacted with DEmRNAs. Finally, 195 immune-related DEmRNAs were obtained ().
Figure 1. Heatmaps of the top 100 DEmRNAs (A), all DEmiRNAs (B) and all DEcircRNAs (C) in PTC.
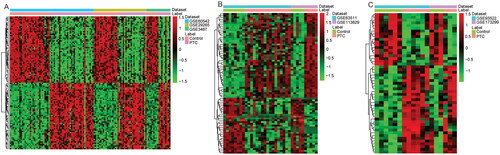
Figure 2. Venn diagram of DEmRNAs in PTC and immune-related mRNAs.
3.2. ceRNA regulatory network
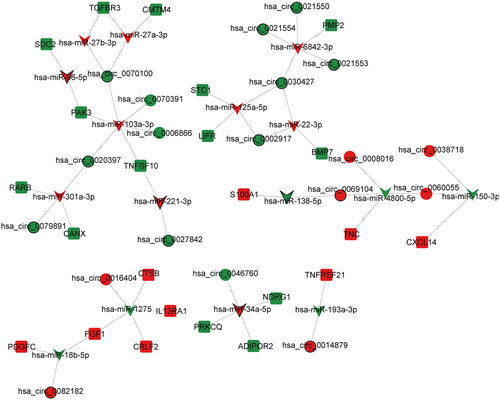
A total of 45 negative regulated circRNA-miRNA targeting relationship pairs were obtained based on CircBank database, including 26 DEcircRNAs and 29 DEmiRNAs (Table S3). In addition, a total of 52 negative regulated miRNA-mRNA targeting relationship pairs were obtained based on miRWalk database, including 36 DEmiRNAs and 32 immune-related DEmRNAs (Table S4). Subsequently, circRNA-miRNA targeting relationship pairs were fused with miRNA-mRNA targeting pairs, and a ceRNA regulatory network containing 16 DEmiRNAs, 23 immune-related DEmRNAs and 19 DEcircRNAs was constructed ().
Figure 3. ceRNA (circRNA-miRNA-mRNA) regulatory network in PTC. V-shaped, circle and square represent DEmiRNAs, DEcircRNAs and immune-related DEmRNAs, respectively. Red and green represent up- and down-regulation, respectively. The black border represents the top 10 up- and down-regulated DEmiRNAs, DEcircRNAs and DEmRNAs.
3.3. GO and KEGG functional enrichment analysis of immune-related DEmRNAs in ceRNA regulatory network
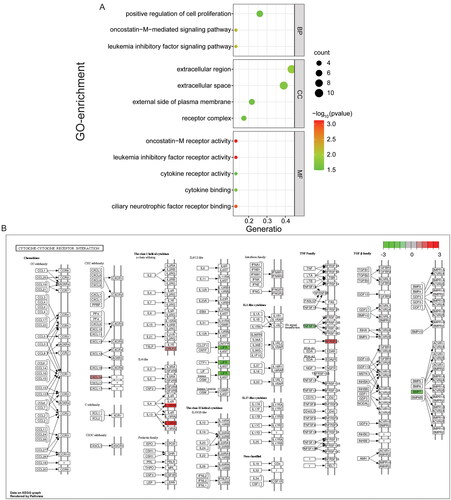
Functional enrichment analysis of 23 immune-related DEmRNAs in ceRNA regulatory network was performed. In GO-BP, positive regulation of cell proliferation, oncostatin-M-mediated signalling pathway and leukaemia inhibitory factor signalling pathway were significantly enriched. In GO-CC, the extracellular region, extracellular space, external side of the plasma membrane and receptor complex were significantly enriched. In GO-MF, oncostatin-M receptor activity, leukaemia inhibitory factor receptor activity, ciliary neurotrophic factor receptor binding, cytokine binding and cytokine receptor activity were significantly enriched (). In addition, the only significantly enriched signalling pathway identified by KEGG enrichment analysis was the cytokine-cytokine receptor interaction ().
Figure 4. GO (A) and KEGG (B) Functional enrichment analysis of immune-related DEmRNAs in ceRNA regulatory network.
3.4. Identification of hub immune-related DEmRNAs base on CytoHubba plug-in
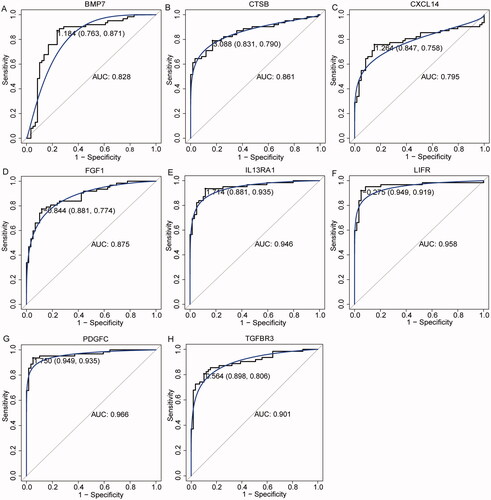
In order to understand the interaction between immune-related DEmRNAs in ceRNA regulatory network, the PPI network was constructed (). Subsequently, the top 10 immune-related DEmRNAs ranked by degree in degree, EPC, MCC and DMNC algorithms were intersected. Finally, 8 hub immune-related DEmRNAs (BMP7, CTSB, CXCL14, FGF1, IL13RA1, LIFR, PDGFC and TGFBR3) were obtained (). Subsequently, ceRNA sub-network containing 8 hub immune-related DEmRNAs were extracted from ceRNA regulatory network (including 7 DEmiRNAs, 8 DEmRNAs and 7 DEcircRNAs) (). In ceRNA sub-network, some relationship pairs were identified, such as hsa_circ_0082182-hsa-miR-18b-5p-FGF1, hsa_circ_0016404-hsa-miR-1275-FGF1, hsa_circ_0070100-hsa-miR-27b-3p-TGFBR3, and hsa_circ_0038718-hsa-miR-150-3p-CXCL14. Remarkably, ROC analysis of 8 hub immune-related DEmRNAs found that their AUC was greater than 0.7. These results suggest that BMP7, CTSB, CXCL14, FGF1, IL13RA1, LIFR, PDGFC and TGFBR3 have high diagnostic accuracy and may be potential molecular diagnostic markers for PTC ().
Figure 5. Identification of hub immune-related DEmRNAs. (A) PPI regulatory network of immune-related DEmRNAs in ceRNA regulatory network; (B) Venn diagram of 4 algorithms in CytoHubba plug-in; (C) ceRNA regulatory network of hub immune-related DEmRNAs. V-shaped, circle and square represent DEmiRNAs, DEcircRNAs and immune-related DEmRNAs, respectively. Red and green represent up- and down-regulation, respectively. The black border represents the top 10 up- and down-regulated DEmiRNAs, DEcircRNAs and DEmRNAs.
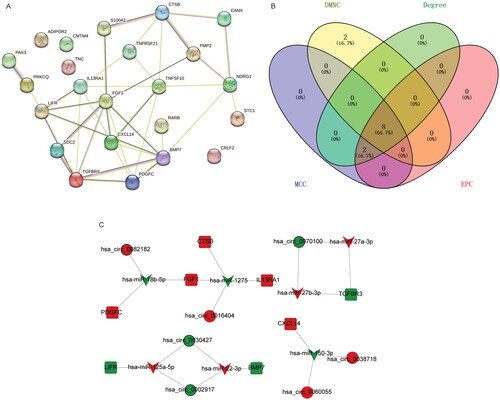
Figure 6. ROC analysis of 8 hub immune-related DEmRNAs. (A) ROC analysis of BMP7; (B) ROC analysis of CTSB; (C) ROC analysis of CXCL14; (D) ROC analysis of FGF1; (E) ROC analysis of IL13RA1; (F) ROC analysis of LIFR; (G) ROC analysis of PDGFC; (H) ROC analysis of TGFBR3.
3.5. Correlation between immune cell infiltration and hub immune-related DEmRNAs
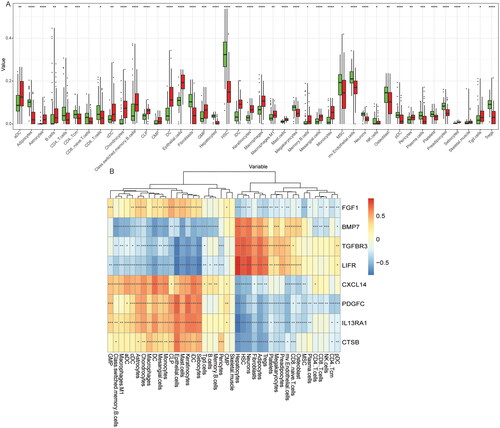
The distribution of immune cells in each sample was analyzed based on xCell, and the results showed that the levels of immune cell infiltration were significantly different between the PTC and the control groups (). For example, Tregs and HSC cells were down-regulated in the TPC group, while DC and Monocytes were up-regulated. Pearson correlation analysis found that Tregs, HSC, DC and Monocytes were correlated with 8 hub immune-related DEmRNAs (). In addition, CIBERSORT analysis also showed that most of the immune cell infiltration levels between PTC and control groups were significantly different (Figure S1A), and these differentially infiltrated immune cells were associated with hub immune-related DEmRNAs (Figure S1B).
Figure 7. Correlation between immune cell infiltration and hub immune-related DEmRNAs. (A) Distribution of immune cells in PTC (red and green represent PTC and control, respectively); (B) Pearson correlation between immune cell infiltration and hub immune-related DEmRNAs. * represent P <0.05; ** represent P < 0.01; *** represent P < 0.001;**** represent P < 0.0001.
3.6. Expression verification and ROC analysis of hub immune-related DEmRNAs and DEmiRNAs based on the TCGA database
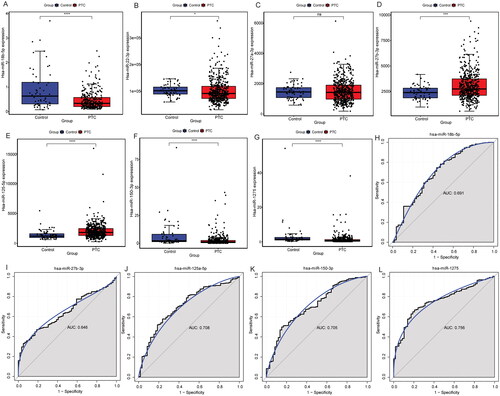
The electronic expression verification of hub immune-related DEmRNAs showed that the expressions of CTSB, CXCL14, FGF1, IL13RA1 and PDGFC were up-regulated, while the expressions of BMP7, LIFR and TGFBR3 were down-regulated in the PTC group, which were consistent with the previous differential expression analysis in GEO database (). Moreover, ROC analysis results showed that 8 hub immune-related DEmRNAs had high diagnostic accuracy, which again suggests that BMP7, CTSB, CXCL14, FGF1, IL13RA1, LIFR, PDGFC and TGFBR3 may be potential molecular diagnostic markers for PTC (). At the same time, the electronic expression of DEmiRNA in ceRNA sub-network was also verified. The results showed that the differential expression results of hsa-miR-18b-5p, hsa-miR-22-3p, hsa-miR-27b-3p, hsa-miR-125a-5p, hsa-miR-150-3p and hsa-miR-1275 were consistent with the analysis results in GEO, but there was no significant difference in the expression of hsa-miR-27a-3p (). Subsequently, ROC analysis was performed of hsa-miR-18b-5p, hsa-miR-22-3p, hsa-miR-27b-3p, hsa-miR-125a-5p, hsa-miR-150-3p and hsa-miR-1275. The results showed that hsa-miR-18b-5p, hsa-miR-27b-3p, hsa-miR-125a-5p, hsa-miR-150-3p and hsa-miR-1275 had high diagnostic accuracy, suggesting that they may be potential molecular diagnostic markers for PTC ().
Figure 8. Expression validation and ROC analysis of hub immune-related DEmRNAs in the TCGA dataset. (A-H) Expression validation of BMP7, CTSB, CXCL14, FGF1, IL13RA1, LIFR, PDGFC and TGFBR3 in the TCGA dataset; (I-P) ROC analysis of BMP7, CTSB, CXCL14, FGF1, IL13RA1, LIFR, PDGFC and TGFBR3 in the TCGA dataset.
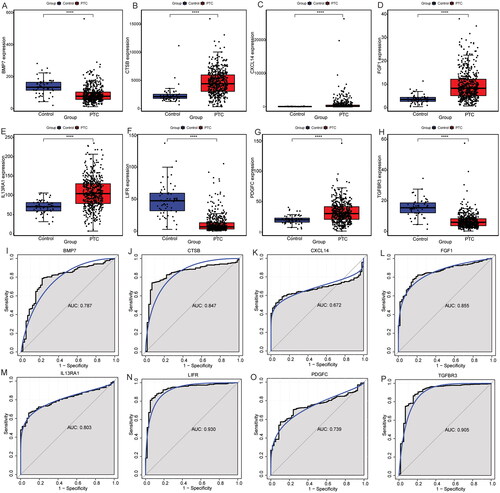
Figure 9. Expression validation and ROC analysis of hsa-miR-18b-5p, hsa-miR-22-3p, hsa-miR-27a-3p, hsa-miR-27b-3p, hsa-miR-125a-5p, hsa-miR-150-3p and hsa-miR-1275 in the TCGA dataset. (A-G): Expression validation of hsa-miR-18b-5p, hsa-miR-22-3p, hsa-miR-27a-3p, hsa-miR-27b-3p, hsa-miR-125a-5p, hsa-miR-150-3p and hsa-miR-1275 in the TCGA dataset; (H-J): ROC analysis of hsa-miR-125a-5p, hsa-miR-150-3p and hsa-miR-1275 in the TCGA dataset.
3.7. QRT-PCR validation and cell experiments
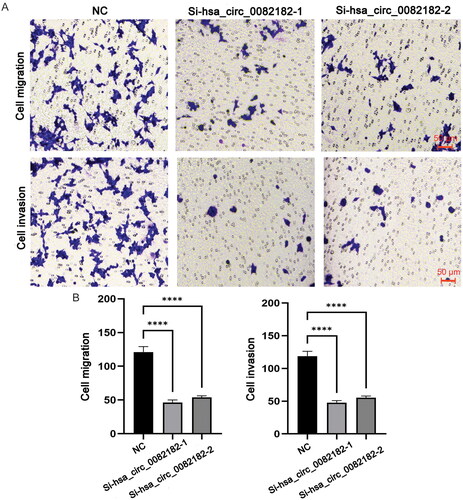
The qRT-PCR results showed that compared with paracancerous tissues, the expression levels of FGF1, hsa_circ_0082182 and hsa_circ_0016404 were up-regulated in cancer tissues, while the expression levels of hsa-miR-18b-5p and hsa-miR-1275 were down-regulated (). In addition, the qRT-PCR results also showed that the knockdown effect of target 2 was the best (), so Si-RNA2 was selected for subsequent experiments. The CCK8 results showed that the activity of cancer cells in the knockdown groups (Si-hsa_circ_0082182-1 group and Si-hsa_circ_0082182-2 group) was significantly lower than that in the NC group (). Plate clone proliferation experiment results showed that the cell proliferation of the knockdown groups was inhibited compared with the NC group (). Moreover, the transwell experiment results showed that the cell migration and invasion ability of knockdown groups were also inhibited compared with the NC group (). The above results indicates that knockdown the expression of hsa_circ_0082182 significantly inhibits the activity, proliferation, migration and invasion of TPC-1 cell. At the same time, it also implies that hsa_circ_0082182 plays an important role in the molecular regulation of PTC progression. Dual-Luciferase reporter assay presented that the luciferase activity was remarkably lower in cells co-transfected with hsa-miR-18b-5p mimics and hsa_circ_0082182 WT than those co-transfected with mimics-NC and hsa_circ_0082182 WT. However, the luciferase activity was not affected in hsa_circ_0082182-Mut groups (Figure S2A). In addition, the luciferase activity was remarkably lower in cells co-transfected with hsa-miR-18b-5p mimics and FGF1 3’UTR WT than those co-transfected with mimics-NC and FGF1 3’UTR WT. The luciferase activity was not affected in FGF1 3’UTR-Mut groups (Figure S2B). This result implies the interaction relationship between hsa-miR-18b-5p and hsa_circ_0082182 and FGF1.
Figure 10. The relative expression of FGF1 (a), hsa-miR-18b-5p (B), hsa-miR-1275 (C), hsa_circ_0082182 (D) and hsa_circ_0016404 (E) in cancer and paracancerous tissues were verified by qRT-PCR. *P < 0.05; ****P < 0.0001.
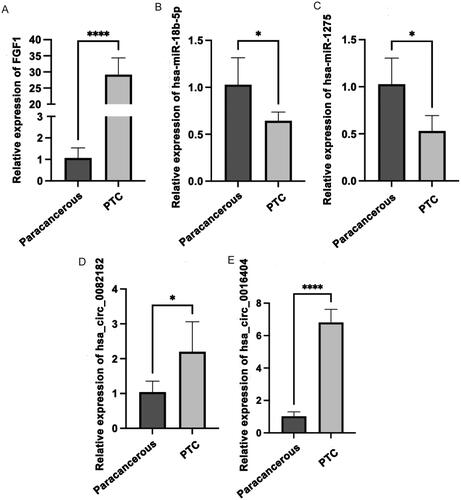
Figure 11. The activity and proliferation of TPC-1 cell after knockdown hsa_circ_0082182. (A) QRT-PCR was used to detect the expression of hsa_circ_0082182 to screen out effective interference targets in TPC-1 cell; (B) CCK8 detected the activity of cancer cells in NC, Si-hsa_circ_0082182-1 and Si-hsa_circ_0082182-2 groups at 0, 24, 48 and 72 h; (C) Plate clone experiment was used to detect the proliferation of cancer cells in NC, Si-hsa_circ_0082182-1 and Si-hsa_circ_0082182-2 groups; D: Histogram of cell proliferation detected by panel clone experiment. NC, normal control; **P < 0.01; ***P < 0.001; ****P < 0.0001.
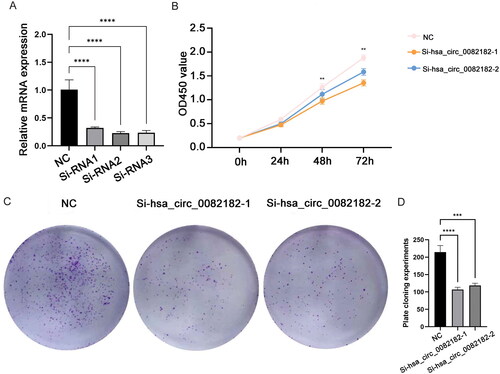
Figure 12. Transwell experiment was used to detect the migration and invasion of TPC-1 cell after knockdown hsa_circ_0082182. (A) Transwell experiment was used to detect the migration and invasion of TPC-1 cell after knockdown hsa_circ_0082182; B: Histogram of cell migration and invasion detected by transwell. NC, normal control; ****, Figure < 0.0001. Observation under 200× microscope.
4. Discussion
PTC is the most common histological type of differentiated thyroid malignancy [Citation19]. In recent decades, the number of TC detected worldwide has increased rapidly. Therefore, exploring the potential molecular mechanism of PTC is beneficial to the diagnosis and management of diseases. In this study, based on the degree, EPC, MCC and DMNC algorithms in CytoHubba plug-in, 8 hub immune-related DEmRNAs (BMP7, CTSB, CXCL14, FGF1, IL13RA1, LIFR, PDGFC and TGFBR3) were identified in PTC. The ceRNA sub-network was constructed based on 8 hub immune-related DEmRNAs, which also included 7 DEmiRNAs and 7 DEcircRNAs. In ceRNA sub-network, some relationship pairs were identified, such as hsa_circ_0082182-hsa-miR-18b-5p-FGF1, hsa_circ_0016404-hsa-miR-1275-FGF1, hsa_circ_0070100-hsa-miR-27b-3p-TGFBR3, and hsa_circ_0038718-hsa-miR-150-3p-CXCL14.
Hsa_circ_0082182 up-regulates NFIB level through sponge hsa-miR-326 to regulate the malignant progression of colorectal cancer [Citation20]. Hsa_circ_0082182 also activated the Wnt/β-catenin pathway through sponge hsa-miR-411 and hsa-miR-1205 to participate in the occurrence and metastasis of colorectal cancer [Citation21]. In this study, the qRT-PCR results showed that compared with paracancerous tissues, the expression levels of hsa_circ_0082182 was up-regulated in cancer tissues. Moreover, in vitro cell experiments suggested that knockdown of hsa_circ_0082182 expression significantly inhibited the activity, proliferation, migration and invasion of TPC-1 cells. The CCK8 results showed that the activity of cancer cell in the knockdown groups was significantly lower than that in the NC group. Plate clone proliferation experiment results showed that the cell proliferation of the knockdown groups was inhibited compared with the NC group. Moreover, the transwell experiment results showed that the cell migration and invasion ability of knockdown groups were also inhibited compared with the NC group. Up to now, no relevant research about hsa_circ_0016404 in the disease has been found. Hsa-miR-18b-5p may affect PTC by regulating NUSAP1 [Citation22]. Hsa-miR-1275 promotes proliferation and metastasis of non-small cell lung cancer cells by regulating LZTS3 expression [Citation23]. Compared with normal thyroid tissue, FGF1 was up-regulated in differentiated malignant tumor samples [Citation24]. FGF1 mediates innate immune activator induction of MMP9 expression, which plays a critical role in PTC cell invasion [Citation25]. CTSB is up-regulated in TC tissues and is associated with cancer cell migration, which may be a good prognostic marker for TC [Citation26]. The protein encoded by IL13RA1 is a subunit of IL13 receptor, which is up-regulated in PTC tissue, and may be a good gene to distinguish PTC and normal thyroid tissue [Citation27]. The expression of PDGFC was up-regulated in PTC tissues and correlated with lymphocyte infiltration level [Citation28]. In this study, hsa_circ_0082182-hsa-miR-18b-5p-FGF1/PDGFC axis and hsa_circ_0016404-hsa-miR-1275-FGF1/CTSB/IL13RA1 axis were identified. Hsa-miR-18b-5p, hsa-miR-1275, FGF1, PDGFC, CTSB and IL13RA1 also have potential diagnostic value. Therefore, it is speculated that hsa_circ_0082182-hsa-miR-18b-5p-FGF1/PDGFC axis and hsa_circ_0016404-hsa-miR-1275-FGF1/CTSB/IL13RA1 axis may play an important role in the occurrence, invasion and migration of PTC. Furthermore, dual-luciferase reporter assay also showed the interaction between hsa-miR-18b-5p and hsa_circ_0082182/FGF1.
Up to now, no relevant reports about hsa_circ_0070100 have been found. This study is the first to show that hsa_circ_0070100 is abnormally expressed in PTC, and hsa_circ_0070100 may play a potential regulatory role in the pathogenesis of PTC. CircRNA cRAPGEF5 is involved in inhibiting the growth and metastasis of renal cell carcinoma through sponge hsa-miR-27a-3p [Citation29]. Hsa-miR-27a-3p has been verified to be involved in the development of PTC [Citation30]. LINC01089 can block the malignant progression of TC by binding hsa-miR-27b-3p to increase the level of FBLN5 protein [Citation31]. TGFBR3 expression is down-regulated in PTC tissues and is associated with OS of patients [Citation32]. Herein, hsa_circ_0070100-hsa-miR-27a-3p/hsa-miR-27b-3p-TGFBR3 axis was identified. Furthermore, hsa-miR-27b-3p and TGFBR3 also have potential diagnostic value. The above results indicated that hsa_circ_0070100-hsa-miR-27a-3p/hsa-miR-27b-3p-TGFBR3 axis may play a regulatory role in the occurrence, development, migration and survival of PTC.
Hsa_circ_0060055 has been reported to promote the growth and invasion of glioblastoma by targeting hsa-miR-197-3p/API5 axis [Citation33]. The up-regulation of hsa_circ_0038718 expression in hepatocellular carcinoma is associated with poor prognosis, and can also regulate cancer progression through sponge hsa-miR-139-3p [Citation34]. It has been demonstrated that hsa_circ_0038718 can promote malignant progression of colon cancer cells through hsa-miR-195-5p/Axin2 signaling axis [Citation35]. It was found that down-regulation of hsa-miR-150-3p promoted the invasion of head and neck squamous cell carcinoma [Citation36]. CXCL14 was found to be up-regulated in PTC and associated with PTC lymph node metastasis [Citation37]. The BRAF V600E mutation (BRAF-MUT) has an aggressive phenotype in PTC. CXCL4 overexpression in BRAF V600E mutation PTC is associated with lymphocyte infiltration [Citation38]. In this study, hsa_circ_0060055/hsa_circ_0038718-hsa-miR-150-3p-CXCL14 axis was identified. Furthermore, hsa-miR-150-3p and CXCL14 also have potential diagnostic value. Therefore, based on the above studies, it is speculated that the hsa_circ_0060055/hsa_circ_0038718-hsa-miR-150-3p-CXCL14 axis may play an indispensable role in regulating the progression, invasion, lymphatic metastasis and survival of PTC.
Hsa-circ-0002917, also known as circ TBC1D4, may play a key role in gastrointestinal stromal tumors [Citation39]. Hsa_circ_ITCH sponge hsa-miR-22-3p up-regulates the expression of CBL and may regulate the proliferation, invasion and apoptosis of PTC cells [Citation11, Citation40]. Hsa-miR-125a-5p has been reported to be up-regulated in TC [Citation41]. A study has demonstrated that hsa-miR-125a-5p can affect the viability, migration and invasion ability of TC cells by targeting CD147 [Citation42]. A previous study found that BMP7 inhibited the growth of TC cells [Citation43]. BMP7 is down-regulated in TC and is associated with tumor differentiation. In addition, knockdown of BMP7 can promote the proliferation, migration and immune checkpoints expression of PTC cells [Citation44]. LIFR is down-regulated in gastric cancer and can regulate the proliferation and migration of gastric cancer cells through hsa_circ_ANO5-miR-21-5p-LIFR axis [Citation45]. LIFR can also regulate the mechanism of colorectal cancer angiogenesis through the ERK/IL-8 pathway [Citation46]. Herein, hsa_circ_0030427/hsa_circ_0002917-hsa-miR-22-3p-BMP7 axis and hsa_circ_0030427/hsa_circ_0002917-hsa-miR-125a-5p-LIFR axis were identified. In addition, hsa-miR-125a-5p, BMP7 and LIFR also have high diagnostic accuracy and may be potential novel diagnostic molecular markers for PTC. Therefore, it is hypothesized that hsa_circ_0030427/hsa_circ_0002917-hsa-miR-22-3p-BMP7 axis and hsa_circ_0030427/hsa_circ_0002917-hsa-miR-125a-5p-LIFR axis may play a regulatory role in the proliferation, invasion and apoptosis of PTC cells.
Cytokine-cytokine receptor interaction was the only one signaling pathway obtained in KEGG analysis in this study. Cytokines play an important role in immune regulation of diseases, and their immune regulation is affected by cytokines-receptors [Citation47]. A study shows that cytokine-cytokine receptor interaction is enriched in PTC sample and the signature constructed by 6 genes in the signaling pathway has a good predictive ability of prognosis [Citation48]. In KEGG analysis, IL13RA1, CXCL14, BMP7 and LIFR were enriched in cytokine-cytokine receptor interaction. Therefore, it is speculated that hsa_circ_0016404-hsa-miR-1275-IL13RA1, hsa_circ_0060055/hsa_circ_0038718-hsa-miR-150-3p-CXCL14 and hsa_circ_0030427/hsa_circ_0002917-hsa-miR-22-3p-BMP7 and hsa_circ_0030427/hsa_circ_0002917-hsa-miR-125a-5p-LIFR axes may participate in the immune mechanism of PTC patients by regulating cytokine-cytokine receptor interaction signalling pathway and then affect the progression, metastasis and migration of the disease.
Tregs play an important role in regulating the initiation and progression of PTC [Citation49]. HSC is the common ancestor of various immune cells with high self-renewal and multidirectional differentiation potential [Citation50]. HSC also has an important effect on thyroid function [Citation51,Citation52]. DC is abundant in PTC cancer tissues and is associated with disease-free survival of patients [Citation53]. Previous studies have found that the lymphocyte-to-monocyte ratio is associated with survival and recurrence in patients with PTC [Citation54,Citation55]. In this study, xCell analysis showed that the levels of immune cell infiltration (including Tregs, HSC, DC and Monocytes) were significantly different between the PTC and the control groups. Furthermore, Pearson correlation analysis showed that most of the differential immune cell infiltration was correlated with hub immune-related DEmRNAs. These results further suggest that hub immune-related mRNAs play an important role in the immune regulation of PTC.
However, this study also has a certain degree of limitations. It is necessary to conduct a large number of in vitro experiments on the relationship pairs in the ceRNA network to explore the circRNA-miRNA-mRNA interaction and function in PTC. For example, knockdown or overexpression experiments can be conducted to investigate the effects of molecules on PTC cell proliferation, migration, invasion, apoptosis, and cycle. In addition, dual-luciferase reporter assay can be performed to explore the circRNA-miRNA-mRNA targeting relationship in PTC. Complementing these studies will help to understand the underlying molecular mechanisms of PTC and contribute to the diagnosis, treatment and management of the disease.
5. Conclusion
This study identified several circRNA-miRNA-immune-related mRNA axes that may play important regulatory roles in PTC. Moreover, FGF1, PDGFC, CTSB, IL13RA1, TGFBR3, CXCL14, BMP7, LIFR, hsa-miR-125a-5p, hsa-miR-1275, hsa-miR-150-3p, hsa-miR-18b-5p and hsa-miR-27b-3p were also found to have good diagnostic accuracy and may be potential novel diagnostic markers for PTC. In addition, it was found that cytokine-cytokine receptor interaction signaling pathway, Tregs, HSC, DC and Monocytes may play a regulatory role in the occurrence, progression, and metastasis of PTC. In vitro cell experiments suggested that knockdown the expression of hsa_circ_0082182 significantly inhibited the activity, proliferation, migration and invasion of TPC-1 cells.
Author contributions statement
Conception and design: B. W. and X. J.; Administrative support: X. J.; Provision of study materials or patients: W. S., L. Y. and X. L.; Collection and assembly of data: B. W. L. Z. and S. Z.; Data analysis and interpretation: All authors; All authors reviewed the manuscript.
Ethics approval and consent to participate
This study was approved by the Research Ethics Committee of The second hospital of Hebei Medical University (2021-R334), and written informed consent was obtained from all patients.
Supplemental Material
Download Zip (3.5 MB)Disclosure statement
No potential conflict of interest was reported by the author(s).
Additional information
Funding
References
- Wang J, Zhanghuang C, Jin L, et al. Development and validation of a nomogram to predict cancer-specific survival in elderly patients with papillary thyroid carcinoma: a population-based study. BMC Geriatr. 2022;22(1):1. doi: 10.1186/s12877-022-03430-8.
- Lam AK. Papillary thyroid carcinoma: current position in epidemiology, genomics, and classification. Meth Molr Biol. 2022;2534:1–17.
- Wu Z, Han L, Li W, et al. Which is preferred for initial treatment of papillary thyroid cancer, total thyroidectomy or lobotomy? Cancer Med. 2021;10(5):1614–1622. doi: 10.1002/cam4.3743.
- Dong W, Horiuchi K, Tokumitsu H, et al. Time-varying pattern of mortality and recurrence from papillary thyroid cancer: lessons from a long-term follow-up. Thyroid. 2019;29(6):802–808. doi: 10.1089/thy.2018.0128.
- Chen L, Wang C, Sun H, et al. The bioinformatics toolbox for circRNA discovery and analysis. Brief Bioinform. 2021;22(2):1706–1728. doi: 10.1093/bib/bbaa001.
- Zang J, Lu D, Xu A. The interaction of circRNAs and RNA binding proteins: an important part of circRNA maintenance and function. J Neurosci Res. 2020;98(1):87–97. doi: 10.1002/jnr.24356.
- Saliminejad K, Khorram Khorshid HR, Soleymani Fard S, et al. An overview of microRNAs: biology, functions, therapeutics, and analysis methods. J Cell Physiol. 2019;234(5):5451–5465. doi: 10.1002/jcp.27486.
- Zhu G, Chang X, Kang Y, et al. CircRNA: a novel potential strategy to treat thyroid cancer . Int J Mol Med. 2021;48(5):201. doi: 10.3892/ijmm.2021.5034.
- Li C, Zhu L, Fu L, et al. CircRNA NRIP1 promotes papillary thyroid carcinoma progression by sponging mir-195-5p and modulating the P38 MAPK and JAK/STAT pathways. Diagn Pathol. 2021;16(1):93. doi: 10.1186/s13000-021-01153-9.
- Yao Y, Chen X, Yang H, et al. Hsa_circ_0058124 promotes papillary thyroid cancer tumorigenesis and invasiveness through the NOTCH3/GATAD2A axis. J Exp Clin Cancer Res. 2019;38(1):318.
- Wang M, Chen B, Ru Z, et al. CircRNA circ-ITCH suppresses papillary thyroid cancer progression through miR-22-3p/CBL/β-catenin pathway. Biochem Biophys Res Commun. 2018;504(1):283–288. doi: 10.1016/j.bbrc.2018.08.175.
- Hanahan D, Weinberg RA. Hallmarks of cancer: the next generation. Cell. 2011;144(5):646–674. doi: 10.1016/j.cell.2011.02.013.
- Na KJ, Choi H. Immune landscape of papillary thyroid cancer and immunotherapeutic implications. Endocr Relat Cancer. 2018;25(5):523–531. doi: 10.1530/ERC-17-0532.
- Zhao Y, Zhang C, Zhu Y, et al. TREM1 fosters an immunosuppressive tumor microenvironment in papillary thyroid cancer. Endocr Relat Cancer. 2022;29(2):71–86. doi: 10.1530/ERC-21-0297.
- Jin A, Zhou J, Yu P, et al. High expression of THBS1 leads to a poor prognosis in papillary thyroid cancer and suppresses the anti-tumor immune microenvironment. Technol Cancer Res Treat. 2022;21:15330338221085360. doi: 10.1177/15330338221085360.
- Wu Z, Liu P, Zhang G. Identification of circRNA-miRNA-immune-related mRNA regulatory network in gastric cancer. Front Oncol. 2022;12:816884. doi: 10.3389/fonc.2022.816884.
- Aran D, Hu Z, Butte AJ. xCell: digitally Portraying the Tissue Cellular Heterogeneity Landscape. Genome Biol. 2017;18(1):220.
- Šimundić AM. Measures of diagnostic accuracy: basic definitions. Ejifcc. 2009;19(4):203–211.
- Vasileiadis I, Boutzios G, Karalaki M, et al. Papillary thyroid carcinoma of the isthmus: total thyroidectomy or isthmusectomy? Am J Surg. 2018;216(1):135–139. doi: 10.1016/j.amjsurg.2017.09.008.
- Wang Z, Liu J, Yang T, et al. Circ_0082182 upregulates the NFIB level via sponging miR-326 to promote oxaliplatin resistance and malignant progression of colorectal cancer cells2022.
- Liu R, Deng P, Zhang Y, et al. Circ_0082182 promotes oncogenesis and metastasis of colorectal cancer in vitro and in vivo by sponging miR-411 and miR-1205 to activate the wnt/β-catenin pathway. World J Surg Oncol. 2021;19(1):51. doi: 10.1186/s12957-021-02164-y.
- Gao T, Zhao L, Zhang F, et al. Evaluate the diagnostic and prognostic value of NUSAP1 in papillary thyroid carcinoma and identify the relationship with genes, proteins, and immune factors. World J Surg Oncol. 2022;20(1):207. doi: 10.1186/s12957-022-02652-9.
- He J, Yu L, Wang CM, et al. MiR-1275 promotes non-small cell lung cancer cell proliferation and metastasis by regulating LZTS3 expression. Eur Rev Med Pharmacol Sci. 2022;26(7):2215.
- Eggo MC, Hopkins JM, Franklyn JA, et al. Expression of fibroblast growth factors in thyroid cancer. J Clin Endocrinol Metab. 1995;80(3):1006–1011. doi: 10.1210/jcem.80.3.7533768.
- Guan H, Guo Y, Liu L, et al. INAVA promotes aggressiveness of papillary thyroid cancer by upregulating MMP9 expression. Cell Biosci. 2018;8:26. doi: 10.1186/s13578-018-0224-4.
- Kim EK, Song MJ, Jang HH. Clinicopathologic analysis of cathepsin B as a prognostic marker of thyroid cancer. Int J Mol Sci. 2020;21(24):9537.
- Jarzab B, Wiench M, Fujarewicz K, et al. Gene expression profile of papillary thyroid cancer: sources of variability and diagnostic implications. Cancer Res. 2005;65(4):1587–1597. doi: 10.1158/0008-5472.CAN-04-3078.
- Bruland O, Fluge Ø, Akslen LA, et al. Inverse correlation between PDGFC expression and lymphocyte infiltration in human papillary thyroid carcinomas. BMC Cancer. 2009;9:425. doi: 10.1186/1471-2407-9-425.
- Chen Q, Liu T, Bao Y, et al. CircRNA cRAPGEF5 inhibits the growth and metastasis of renal cell carcinoma via the miR-27a-3p/TXNIP pathway. Cancer Lett. 2020;469:68–77. doi: 10.1016/j.canlet.2019.10.017.
- Ni T, Li Y, Guo D, et al. LncRNA DNAJC3-AS1 promotes the biological functions of papillary thyroid carcinoma via regulating the microRNA-27a-3p/CCBE1 axis. Cell Biol Int. 2023;47(3):539–547. doi: 10.1002/cbin.11946.
- Pan YQ, Huang KS, Chong TH, et al. LINC01089 blocks malignant progression of thyroid cancer by binding miR-27b-3p to enhance the FBLN5 protein level. Discov Oncol. 2022;13(1):114. doi: 10.1007/s12672-022-00580-4.
- Luo Y, Chen R, Ning Z, et al. Identification of a four-gene signature for determining the prognosis of papillary thyroid carcinoma by integrated bioinformatics analysis. Int J Gen Med. 2022;15:1147–1160. doi: 10.2147/IJGM.S346058.
- Yuan J, Liu Z, Liu J, et al. Circ_0060055 promotes the growth, invasion, and radioresistance of glioblastoma by targeting MiR-197-3p/API5 axis. Neurotox Res. 2022;40(5):1292–1303. doi: 10.1007/s12640-022-00548-w.
- Sun R, Li H, Li J, et al. CircRNA circ-0038718 promotes hepatocellular carcinoma progression through sponging miR-139-3p. Biochem Biophys Res Commun. 2020;533(4):845–852. doi: 10.1016/j.bbrc.2020.07.035.
- Gu H, Xu Z, Zhang J, et al. Circ_0038718 promotes colon cancer cell malignant progression via the miR-195-5p/Axin2 signaling axis and also effect wnt/β-catenin signal pathway. BMC Genomics. 2021;22(1):768. doi: 10.1186/s12864-021-07880-z.
- Koshizuka K, Hanazawa T, Kikkawa N, et al. Antitumor miR-150-5p and miR-150-3p inhibit cancer cell aggressiveness by targeting SPOCK1 in head and neck squamous cell carcinoma. Auris Nasus Larynx. 2018;45(4):854–865. doi: 10.1016/j.anl.2017.11.019.
- Oler G, Camacho CP, Hojaij FC, et al. Gene expression profiling of papillary thyroid carcinoma identifies transcripts correlated with BRAF mutational status and lymph node metastasis. Clin Cancer Res. 2008;14(15):4735–4742. doi: 10.1158/1078-0432.CCR-07-4372.
- Smallridge RC, Chindris AM, Asmann YW, et al. RNA sequencing identifies multiple fusion transcripts, differentially expressed genes, and reduced expression of immune function genes in BRAF (V600E) mutant vs BRAF wild-type papillary thyroid carcinoma. J Clin Endocrinol Metab. 2014;99(2):E338–47. doi: 10.1210/jc.2013-2792.
- Chunyan Z, Yanpeng H, Changshun X, et al. Potential value of circular RNA circTBC1D4 in gastrointestinal stromal tumors. J Immunol Res. 2022;2022:9019097.
- Guo Y, Zheng H, Yin J, et al. Rs4911154 of circ-ITCH aggravated tumor malignancy of thyroid nodules via the circ-ITCH/miR-22-3p/CBL axis. Sci Rep. 2021;11(1):18491. doi: 10.1038/s41598-021-97471-5.
- Dettmer MS, Perren A, Moch H, et al. MicroRNA profile of poorly differentiated thyroid carcinomas: new diagnostic and prognostic insights. J Mol Endocrinol. 2014;52(2):181–189. doi: 10.1530/JME-13-0266.
- Huang P, Mao LF, Zhang ZP, et al. Down-regulated miR-125a-5p promotes the reprogramming of glucose metabolism and cell malignancy by increasing levels of CD147 in thyroid cancer. Thyroid. 2018;28(5):613–623. doi: 10.1089/thy.2017.0401.
- Franzén A, Heldin NE. BMP-7-induced cell cycle arrest of anaplastic thyroid carcinoma cells via p21(CIP1) and p27(KIP1). Biochem Biophys Res Commun. 2001;285(3):773–81. doi: 10.1006/bbrc.2001.5212.
- Li CW, Shi X, Ma B, et al. A 4 gene-based immune signature predicts dedifferentiation and immune exhaustion in thyroid cancer. J Clin Endocrinol Metab. 2021;106(8):e3208–e20. doi: 10.1210/clinem/dgab132.
- Guan E, Liu H, Xu N. Lidocaine suppresses gastric cancer development through circ_ANO5/miR-21-5p/LIFR axis. Dig Dis Sci. 2022;67(6):2244–2256. doi: 10.1007/s10620-021-07055-6.
- Wu HX, Cheng X, Jing XQ, et al. LIFR promotes tumor angiogenesis by up-regulating IL-8 levels in colorectal cancer. Biochim Biophys Acta Mol Basis Dis. 2018;1864(9 Pt B):2769–2784. doi: 10.1016/j.bbadis.2018.05.004.
- Spangler JB, Moraga I, Mendoza JL, et al. Insights into cytokine-receptor interactions from cytokine engineering. Annu Rev Immunol. 2015;33:139–167. doi: 10.1146/annurev-immunol-032713-120211.
- Wang T, Shi J, Li L, et al. Single-cell transcriptome analysis reveals inter-tumor heterogeneity in bilateral papillary thyroid carcinoma. Front Immunol. 2022;13:840811. doi: 10.3389/fimmu.2022.840811.
- Zhao N, Liu X, Wu C, et al. Changes in treg numbers and activity in papillary thyroid carcinoma with and without Hashimoto’s thyroiditis. J Int Med Res. 2020;48(4):300060520919222. doi: 10.1177/0300060520919222.
- Haas S, Trumpp A, Milsom MD. Causes and consequences of hematopoietic stem cell heterogeneity. Cell Stem Cell. 2018;22(5):627–638. doi: 10.1016/j.stem.2018.04.003.
- Gaide Chevronnay HP, Janssens V, Van Der Smissen P, et al. Hematopoietic stem cells transplantation can normalize thyroid function in a cystinosis mouse model. Endocrinology. 2016;157(4):1363–1371. doi: 10.1210/en.2015-1762.
- Lee TY, Lee S, Bae JS, et al. Distinct clinical manifestations of thyroid cancer after hematopoietic stem cell transplantation. Ann Surg Oncol. 2019;26(11):3586–3592. doi: 10.1245/s10434-019-07442-4.
- Hilly O, Rath-Wolfson L, Koren R, et al. CD1a-positive dendritic cell density predicts disease-free survival in papillary thyroid carcinoma. Pathol Res Pract. 2015;211(9):652–656. doi: 10.1016/j.prp.2015.05.009.
- Song L, Zhu J, Li Z, et al. The prognostic value of the lymphocyte-to-monocyte ratio for high-risk papillary thyroid carcinoma. Cancer Manag Res. 2019;11:8451–8462. doi: 10.2147/CMAR.S219163.
- Yokota M, Katoh H, Nishimiya H, et al. Lymphocyte-monocyte ratio significantly predicts recurrence in papillary thyroid cancer. J Surg Res. 2020;246:535–543. doi: 10.1016/j.jss.2019.09.034.