
Abstract
Background
Carcinoembryonic antigen (CEA) monitoring facilitates the detection of recurrence in patients with colorectal cancer (CRC) after resection. False-positive CEA has been reported in CRC patients with certain comorbidities or smokers. However, limited information is currently available on the frequency of and changes in falsely elevated CEA levels in patients without these conditions.
Materials and methods
We retrospectively examined CRC patients who underwent surgical resection at our hospital between 2001 and 2017, had no recurrence for at least five years, and were free of known factors that may increase CEA. Postoperative CEA levels were retrieved until 2 years before the last contact. For comparison, we similarly selected patients who developed recurrence after resection of CRC during the same period, and CEA levels at initial presentation, at nadir, and at the time of recurrence were reviewed. The patterns of elevated CEA (>5 ng/ml) were classified as transient, repeated, or persistent based on longitudinal changes. The relationships between CEA and carbohydrate antigen 19-9, transaminases, creatinine, and C-reactive protein were examined.
Results
CEA elevation occurred in 90 (20%) out of 446 eligible patients without recurrence at least once during the mean postoperative period of 50.5 months, whereas CEA was >5 ng/ml in 117 (53%) of 221 patients when they developed recurrence. Twenty-seven patients without recurrence showed a transient elevation in CEA, 45 repeated elevations, and 18 a persistent elevation; the frequency of a high preoperative CEA level increased in this order. The majority (98%) of false elevations ranged between 5 and 15 ng/ml. CEA was not associated with other laboratory data.
Conclusions
Unexplained CEA elevations were observed in 20% of recurrence-free CRC patients after surgery, and were classified into three patterns based on longitudinal changes. A more detailed understanding of patient-specific fluctuations in CEA will prevent unnecessary imaging studies and reduce medical costs.
KEY MESSAGES
Limited information is currently available on the frequency of and changes in falsely elevated carcinoembryonic antigen (CEA) levels after surgery for colorectal cancer. Unexplained postoperative CEA elevations were detected in 20% of colorectal cancer patients. The patterns of these elevations were classified into transient, repeated, and persistent.
Introduction
The early detection of recurrence in colorectal cancer (CRC) patients after surgery with curative intent is of importance. Serum carcinoembryonic antigen (CEA) is the most prevalently used and relatively low-cost tumor marker for the management of CRC [Citation1,Citation2]. Many guidelines recommend the measurement of CEA during the postoperative follow-up to detect recurrence in CRC patients [Citation3–9]. However, abnormal CEA levels have been reported in other types of cancer [Citation10–12]. Furthermore, elevated CEA has been detected in non-malignant diseases, such as chronic kidney disease, chronic obstructive pulmonary disease, liver cirrhosis, pancreatitis, and inflammatory bowel diseases [Citation10–13]. Serum CEA levels may also be elevated in smokers [Citation14]. Therefore, the value of CEA needs to be evaluated in consideration of these conditions.
False-positive CEA elevations have been reported in CRC patients after surgery who are otherwise heathy without evidence of recurrence [Citation15,Citation16]. However, limited information is currently available on changes in false-positive CEA elevations over time. Moreover, there have only been a few case reports of CEA elevations in summer after complete cancer resection [Citation17,Citation18]. Therefore, we herein attempted to elucidate the frequency of and longitudinal changes in unexplained elevations in serum CEA levels in CRC patients after curative resection.
Materials and methods
Patient selection and data collection
We retrospectively reviewed patients who underwent curative resection with lymphadenectomy for sporadic CRC and were diagnosed with histologically-confirmed adenocarcinoma of stage 0–IV at our department between 2001 and 2017. We selected patients from this cohort who were followed up without evidence of recurrence for at least five years after surgery as the ‘Non-recurrence group’. We excluded patients who developed synchronous and/or metachronous malignancies (including another CRC) during the follow-up, those with inflammatory bowel disease, chronic kidney disease, chronic hepatic disease, diabetes mellitus, autoimmune disease, chronic obstructive pulmonary disease or cardiovascular disease on medication, and current or ex-smokers at the diagnosis of CRC. For comparison, CRC patients who underwent curative surgery during the same period and developed recurrence were selected as the ‘Recurrence group’. The excision criteria were same as the recurrence-free patients. In addition, patients diagnosed with recurrence within four weeks or between 5 and 7 years after CRC surgery were excluded.
Data were collected through our database for the Non-recurrence group and included sex, age, the body mass index (BMI), the Eastern Cooperative Oncology Group Performance Status (ECOG PS), serum CEA, carbohydrate antigen (CA) 19-9, creatinine, aspartate aminotransferase (AST), alanine aminotransferase (ALT), and C-reactive protein (CRP) before and after surgery. The primary tumor location, TNM stage [Citation19], and perioperative treatments were also retrieved from our database. At our hospital, the upper limits of the normal ranges (ULN) for CEA, CA 19-9, AST, and CRP were 5 ng/ml, 37 U/ml, 30 U/l, and 0.3 mg/dl, respectively. The ULN of ALT was 42 U/l for males and 23 U/l for females. The reference range for creatinine was 0.65–1.07 mg/dl for men and 0.46–0.79 mg/dl for women. We analyzed raw data and their relationships for five years after surgery or up to two years before the last follow-up, whichever was shorter, considering the time-lag between occult cancer development and clinical detection. The relative ratios of CEA to the preoperative value and to the nadir value were calculated for all postoperative CEA readings. Laboratory data collected within four weeks after CRC surgery were not analyzed.
We analyzed serum CEA levels at initial presentation, at nadir, and at the time of recurrence in the Recurrence group. Clinicopathological variables were collected similarly to the Non-recurrence group, except for serum CA 19-9, creatinine, AST, ALT, and CRP.
According to the patterns of CEA elevations over time, we further classified patients of the Non-recurrence group into the following three groups based on a CEA threshold of 5 ng/ml: (1) a transient elevation (defined as a series of elevated CEA levels of >5 ng/ml for <24 months), (2) repeated elevations (multiple series of elevated CEA levels of >5 ng/ml for <24 months), and (3) a persistent elevation (persistently elevated CEA levels of >5 ng/ml for >24 months). In groups 1 and 2, we further divided patients into elevations in summer, elevations in non-summer, and elevations not related to season, with summer indicating the time period between June and September, and non-summer that between October and May, as defined in a previous study on seasonal variations in prostate-specific antigen (PSA) [Citation20].
The study protocol was approved by the local ethics committees at the University of Tokyo (reference: 3252-15) and also meets the standards of the Declaration of Helsinki in its revised version of 1975 and its later amendments. All patients gave a general consent for their data being stored in our database and being used for research purposes. The opportunity to opt-out was also offered to the patients.
Follow-up
Our postoperative follow-up strategy was based on the Japanese Society for Cancer of the Colon and Rectum Guidelines for the Treatment of Colorectal Cancer [Citation9]. Adjuvant chemotherapy was recommended for high-risk stage II and more advanced stage CRC cases; however, its implementation was also dependent on patients’ preferences and/or at doctors’ discretion. Moreover, actual chemotherapy regimens and schedules were selected according to informed consent based on shared decision-making. Serum tumor markers, including CEA and CA 19-9, were basically measured every 3 months but were checked at most once per month. Patients underwent computed tomography (CT) scans every six to twelve months. When serum tumor marker levels increased in an accelerated manner or patients developed symptoms suggesting recurrence, CT scans and other imaging modalities, such as positron emission tomography and magnetic resonance imaging, were additionally performed.
Statistics
The relationship between qualitative variables was established using the χ2 test. Receiver operating characteristic (ROC) curve analysis was used to evaluate the discriminating capabilities of surrogate measures of CEA to differentiate recurrence from non-recurrence. Continuous variables were compared by the unpaired t-test. The relationships between CEA and other laboratory variables were tested using Pearson’s product-moment correlation coefficient (r). The statistical software used for these analyses was JMP 16.2.0 (SAS Institute Inc., Cary, NC, USA). Differences with a p-value <0.05 were considered to be significant.
Results
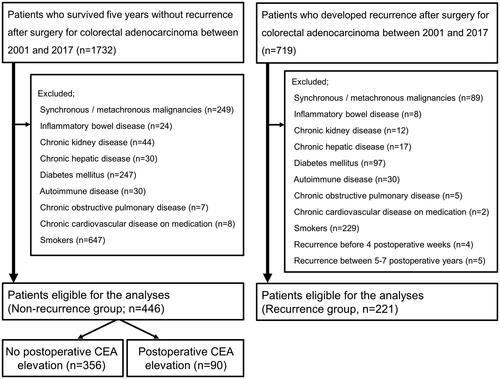
During the study period, 1732 patients underwent surgical resection for CRC and survived for at least five years without relapse. Seven hundred and nineteen patients developed recurrence after CRC surgery during the same period. We identified 446 patients without relapse and 221 patients with recurrence who were eligible for analyses in the present study ().
Figure 1. Study flow chart.
The Non-recurrence group comprised 312 women (70%) with a mean age of 63.1 years old. High preoperative CEA was observed in 22% of patients. The rectum was the predominant primary tumor location (191 patients, 43%). Stage 0/I was the most frequent (39%), and 135 patients (30%) received adjuvant chemotherapy. Serum CEA was measured 18.4 times on average during the mean study period of 50.5 months. The Recurrence group comprised 157 women (71%) with a mean age of 62.8 years old. Preoperative CEA was elevated in 59% of patients. Stage III was the most frequent (47%), and 128 patients (58%) received adjuvant chemotherapy. Recurrence was diagnosed at 13.8 months after CRC surgery on average. The baseline characteristics between patients with and without recurrence are shown in .
Table 1. Comparative profile of patients according to recurrence.
Ninety patients (20%) had CEA elevations documented at least once after curative surgery in the Non-recurrence group. summarizes the comparative baseline data of patients without recurrence according to postoperative CEA elevations. Patients with postoperative CEA elevations were predominantly male and older, and had higher frequencies of elevated preoperative CEA and CA 19-9 levels than patients without CEA elevations after surgery. Notably, false-positive elevations of CEA were found in a half of patients aged ≥80 years. The patient group with postoperative elevations of CEA was also characterized by a longer follow-up with more intensive CEA surveillance after surgery. Other background variables were similar between the two patient groups.
Table 2. Profile of patients without recurrence according to postoperative CEA elevation.
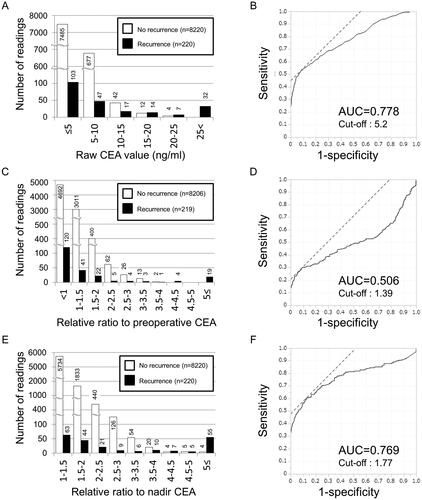
shows the comparative distribution of postoperative CEA value in the Non-recurrence and Recurrence groups. Among 735 abnormal CEA readings in patients without recurrence, the highest value was 22.5 ng/ml; 677 (92%) of elevated CEA readings were between 5 and 10 ng/ml, and 42 (6%) were between 10 and 15 ng/ml. In contrast, serum CEA was elevated in 117 patients (53%) of the Recurrence group at the time of recurrence; the highest value was 1025.4 ng/ml. An ROC curve was drawn to determine the optimal cut-off value for raw CEA value to discriminate recurrence from non-recurrence. The cut-off value for the highest sensitivity and specificity was 5.2 ng/ml with an area under the curve (AUC) of 0.778 (). Next, the distribution of relative CEA ratio to preoperative value is shown in . Here, we excluded patients who did not receive CEA testing before emergency surgery for primary CRC. The highest ratio was 3.68 in the Non-recurrence group and 87.42 in the Recurrence group. The AUC under the ROC curve for this measure was 0.506 (). Furthermore, the distribution of relative CEA ratio to the nadir was shown in . The highest ratio was 7.11 in the Non-recurrence group and 151.31 in the Recurrence group. The AUC under the ROC curve for the third measure was 0.769 ().
Figure 2. Evaluation of candidate measures using CEA values for discriminating recurrence from non-recurrence. (A) Distribution of raw CEA levels during the postoperative period. The number of readings for each CEA range was shown according to recurrence. One patient who did not take a CEA test at the time of recurrence was excluded. White bar indicates non-recurrence, and black bar indicates recurrence. (B) Receiver operating characteristic (ROC) curve for the relationship between postoperative CEA value and recurrence. AUC: area under the curve. (C) Distribution of postoperative CEA ratio to the preoperative value. The number of readings for each range of the relative ratio was shown according to recurrence. Patients who did not take a CEA test before colorectal surgery were excluded. White bar indicates non-recurrence, and black bar indicates recurrence. (D) ROC curve for the relationship between postoperative CEA ratio to the preoperative value and recurrence. (E) Distribution of postoperative CEA ratio to the nadir. The number of readings for each range of the relative ratio was shown according to recurrence. One patient who did not take a CEA test at the time of recurrence was excluded. White bar indicates non-recurrence, and black bar indicates recurrence. (F) ROC curve for the relationship between postoperative CEA ratio to the nadir and recurrence.
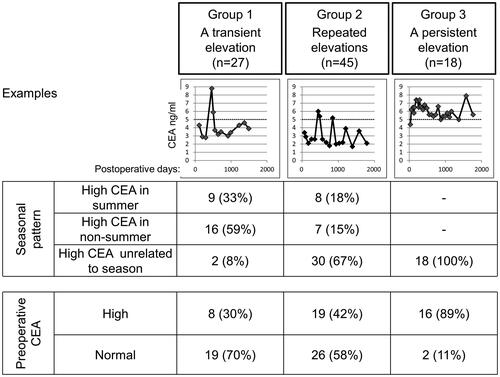
summarizes the patterns of serum CEA elevations. Group 1 (a transient elevation), group 2 (repeated elevations), and group 3 (a persistent elevation) comprised 27, 45, and 18 patients, respectively. Preoperative CEA was high in 30% of group 1, 42% of group 2, and 89% of group 3, but was only high in 53 (15%) out of 356 patients with normal CEA levels in all postoperative readings. In group 1, nine patients had high postoperative CEA in summer and 16 in non-summer. In group 2, eight patients had high postoperative CEA in summer and seven in non-summer; however, the majority (30 patients) had repeatedly high postoperative CEA independent of season.
Figure 3. Typical patterns of false-positive elevations of CEA after colorectal cancer surgery. Examples of longitudinal changes in CEA are shown. The relationships between changes in CEA and seasons are tabulated. The relationships between the patterns of CEA elevations and preoperative CEA levels are also shown.
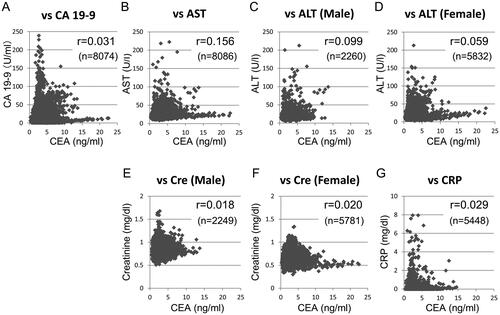
shows the relationships between CEA and other laboratory data after surgery in eligible patients. Serum CEA and CA 19-9 levels were independent in postoperative blood tests (r = 0.031). Moreover, CEA levels did not correlate with AST, ALT, creatinine, or CRP levels, with calculated coefficients ranging between 0.018 and 0.156.
Figure 4. Scatter plot analyses of serum CEA and other blood test data in colorectal cancer patients without recurrence. Serum CEA was plotted against (A) CA 19-9, (B) AST, (C) ALT in men, (D) ALT in women, (E) creatinine in men, (F) creatinine in women, and (G) CRP. The coefficient (r) and total number of blood tests (n) are shown in each graph. There are some outlying data that were not displayed in the graphs.
Discussion
Unexpected elevations in serum tumor markers are an unwanted outcome in clinical practice after curatively-intended cancer surgery. There is a paucity of studies on false-positive serum CEA during the postoperative follow-up in CRC patients. Litvak et al. reported that among 728 stage I–III CRC patients with postoperative CEA >5 ng/ml, false-positive CEA elevations were detected in 358 (49%) [Citation15]. However, this study was not designed to exclude known non-malignant conditions associated with false-positive CEA [Citation15]. In addition, they did not systematically investigate changes over time after surgery [Citation15]. To the best of our knowledge, the present study is the first to examine changes in CEA after surgery for CRC and the longitudinal relationships between CEA and other key laboratory data over time using a sizable number of otherwise healthy patients. We detected unexplained CEA elevations during postoperative surveillance in 20% of CRC cases.
In the present study, we evaluated three candidate measures based on serum CEA levels for discriminating non-recurrence from recurrence, namely, (1) raw CEA value, (2) relative CEA ratio to the preoperative level, and (3) relative CEA ratio to the nadir. The ROC curve analyses demonstrated that the AUC was the highest using raw CEA value (0.778). The ratio to the nadir CEA also yielded a high AUC (0.769). However, the CEA nadir may be always subject to change during the follow-up period; in fact, the nadir occurred many years after CRC surgery in several patients without recurrence (data not shown). Therefore, raw CEA level was considered the most useful to segregate CRC patients into recurrence and non-recurrence in clinical practice.
In our cohort, the majority of false-positive CEA ranged between 5 and 15 ng/ml. These results were similar to the findings reported by Litvak et al. showing that peak CEA ranged between 5.1 and 10 ng/ml in 91.6% and between 10.1 and 15 ng/ml in 5.9% of recurrence-free CRC patients with false-positive CEA levels [Citation15]. In their study, the false-positive rate of CEA decreased when its value was higher [Citation15]. Therefore, they indicated that a single increase in CEA to between 5 and 10 ng/ml should not necessarily prompt additional image studies, but needs to be closely followed instead and reconsidered [Citation15,Citation16], with which we agree.
Previous studies examined fluctuations in various tumor markers in cancer-free patients. For example, epidemiological studies clearly showed an elevation in PSA in summer in prostate cancer patients [Citation20,Citation21]. The most plausible explanation is that physical activity during summer may be associated with a transient increase in PSA [Citation22]. On the other hand, ultraviolet radiation activates the vitamin D pathway, which may protect against prostate cancer [Citation23]. In contrast, seasonal changes in serum CEA were only anecdotally demonstrated in a few case reports. Yoshida et al. reported repeated surges in CEA after surgical resection for colon cancer [Citation18]. Sakuma et al. found repeated increases in CEA in summer after surgical resection in a patient with CEA-expressing bronchioloalveolar carcinoma [Citation17]. Similar to PSA, there is a possible explanation for these findings. Heat may increase the expression of CEA based on the findings of hyperthermia in a human colon adenocarcinoma cell line [Citation24]. On the other hand, vitamin D has also been suggested to play an anti-tumor role in CRC because a study of the geographical distribution of cancer showed that CRC deaths were low in the south regions of the United States where people were exposed to great amounts of sunlight [Citation25]. In the present study, seasonal elevations in CEA were observed in 9% of patients (40 out of 446) without recurrence. These patients were outnumbered by those with high CEA unrelated to season. Therefore, seasonal variations in CEA may be a chance finding. The mechanisms responsible for false-positive CEA have not yet been elucidated and need to be investigated in more detail using other modalities.
A CEA surge may occur during adjuvant 5-fluorouracil-based chemotherapy or immunologic therapy [Citation26]. However, CEA elevations after adjuvant chemotherapy were not rare in the present study (). Moreover, as shown in , postoperative CEA elevations were not associated with the implementation of chemotherapy.
SARS-CoV-2 infection has attracted much attention as another cause of temporary CEA elevation because the virus may directly affect both alveolar and gastrointestinal epithelial cells [Citation27,Citation28]. In fact, a recent study from China demonstrated that serum CEA was >5 ng/ml in 23% of COVID-19 patients [Citation29]. However, we collected most results of laboratory tests performed before the pandemic, and all six patients with elevated CEA in 2020 were not infected with COVID-19 (data not shown).
Besides the conditions employed as exclusion criteria in the present study, there are several other factors associated with changes in tumor markers. For example, obese subjects have lower tumor marker levels than non-obese subjects [Citation30–32], which may be attributed to a dilutional effect. In contrast, Park et al. showed that a low skeletal muscle mass was closely associated with high CEA in a population-based study [Citation33]. In our cohort, BMI was similar between patients with and without postoperative CEA elevations. As shown in and by a previous report [Citation34], elderly patients were likely to have a higher CEA than younger patients; however, we were unable to restrict patients based on age due to its broad range in the present cohort.
There are other limitations that need to be addressed. The timing of laboratory tests and practice patterns varied among patients due to the retrospective nature of the analysis. Since patients who smoked were excluded, the number of male patients was small. In addition, information on smoking and drinking habits was based on patients’ self-reports. Comorbidities for exclusion or chronic inflammatory disease may have developed during the postoperative periods among patients included in the present study. Although many factors were listed as the exclusion criteria, we were not able to assess colorectal adenomas and other digestive premalignant lesions as other possible causes for false elevations of CEA. We set a window of data retrieval from four postoperative weeks to 2 years before the last contact, but there was a small possibility of latent recurrence and/or the development of another primary cancer before the cut-off time for data collection in the Non-recurrence group. On the other hand, data before the diagnosis of recurrence in the Recurrence group were not incorporated into the analyses for similar reasons. Furthermore, since this was a retrospective analysis, it was not possible to evaluate postoperative minimal residual disease by circulating tumor DNA or other metrics. There were missing data measured in conjunction with CEA monitoring because the national health insurance system in Japan limits the number of blood test items in clinical practice. Moreover, reference creatinine levels in healthy adults vary not only with sex but also with age [Citation35]. Age-related fluctuations in the reference range for creatinine may have affected the results obtained.
Conclusions
In conclusion, we herein characterized the incidence and patterns of CEA elevations in the follow-up period in CRC patients without known factors that increase serum CEA levels. In addition to the knowledge that false-positive CEA readings ranging between 5 and 15 ng/ml are common, information on patient-specific fluctuations in tumor markers may prevent unnecessary imaging studies, save patients from anxiety as well as radiation exposure, and reduce medical costs. The present results warrant further study using different cohorts.
Author contributions
Hiroaki Nozawa and Soishiro Ishihara built study design. Hiroaki Nozawa and Yumi Yokota contributed to data collection, and all authors were involved in the analyses of the data. All authors were involved in the surgical treatment and follow-up of patients. Hiroaki Nozawa wrote the manuscript. Yumi Yokota, Shigenobu Emoto, Yuicihiro Yokoyama, Kazuhito Sasaki, Koji Murono, Shinya Abe, Hirofumi Sonoda, Takahide Shinagawa, and Soshiro Ishihara reviewed and revised the manuscript. All authors participated in the final approval of the manuscript.
Acknowledgments
The authors would like to thank Medical English Service (Kyoto, Japan) for editing the manuscript.
Disclosure statement
No potential conflict of interest was reported by the author(s).
Data availability statement
The datasets generated during and/or analyzed during the current study are available from the corresponding author upon reasonable request.
Additional information
Funding
References
- Park YA, Lee KY, Kim NK, et al. Prognostic effect of perioperative change of serum carcinoembryonic antigen level: a useful tool for detection of systemic recurrence in rectal cancer. Ann Surg Oncol. 2006;13(5):1–10. doi: 10.1245/ASO.2006.03.090.
- Takagawa R, Fujii S, Ohta M, et al. Preoperative serum carcinoembryonic antigen level as a predictive factor of recurrence after curative resection of colorectal cancer. Ann Surg Oncol. 2008;15(12):3433–3439. doi: 10.1245/s10434-008-0168-8.
- NCCN. Clinical Practice Guidelines in Oncology (NCCN Guidelines®) Colon Cancer Version 2.2023. [Internet]. Available from: https://www.nccn.org/professionals/physician_gls/pdf/colon.pdf
- NCCN. Clinical Practice Guidelines in Oncology (NCCN Guidelines®) Rectal Cancer Version 3.2023. [Internet]. Available from: https://www.nccn.org/professionals/physician_gls/pdf/rectal.pdf
- Argilés G, Tabernero J, Labianca R, et al. Localised colon cancer: ESMO clinical practice guidelines for diagnosis, treatment and follow-up. Ann Oncol. 2020;31(10):1291–1305. doi: 10.1016/j.annonc.2020.06.022.
- Glynne-Jones R, Wyrwicz L, Tiret E, et al. Rectal cancer: ESMO clinical practice guidelines for diagnosis, treatment and follow-up. Ann Oncol. 2017;28(suppl_4):iv22–iv40. doi: 10.1093/annonc/mdx224.
- Vogel JD, Felder SI, Bhama AR, et al. The American Society of Colon and Rectal Surgeons clinical practice guidelines for the management of colon cancer. Dis Colon Rectum. 2022;65(2):148–177. doi: 10.1097/DCR.0000000000002323.
- You YN, Hardiman KM, Bafford A, et al. The American Society of Colon and Rectal Surgeons clinical practice guidelines for the management of rectal cancer. Dis Colon Rectum. 2020;63(9):1191–1222. doi: 10.1097/DCR.0000000000001762.
- Hashiguchi Y, Muro K, Saito Y, et al. Japanese Society for Cancer of the Colon and Rectum (JSCCR) guidelines 2019 for the treatment of colorectal cancer. Int J Clin Oncol. 2020;25(1):1–42. doi: 10.1007/s10147-019-01485-z.
- MacSween JM, Warner NL, Bankhurst AD, et al. Carcinoembryonic antigen in whole serum. Br J Cancer. 1972;26(5):356–360. doi: 10.1038/bjc.1972.46.
- Reynoso G, Chu TM, Holyoke D, et al. Carcinoembryonic antigen in patients with different cancers. JAMA. 1972;220(3):361–365. doi: 10.1001/jama.1972.03200030021005.
- Hao C, Zhang G, Zhang L. Serum CEA levels in 49 different types of cancer and noncancer diseases. Prog Mol Biol Transl Sci. 2019;162:213–227.
- Khoo SK, Hunt PS, Mackay IR. Studies of carcinoembryonic antigen activity of whole and extracted serum in ulcerative colitis. Gut. 1973;14(7):545–548. doi: 10.1136/gut.14.7.545.
- Stevens DP, Mackay IR, Busselton Population Studies Group. Increased carcinoembryonic antigen in heavy cigarette smokers. Lancet. 1973;2(7840):1238–1239.
- Litvak A, Cercek A, Segal N, et al. False-positive elevations of carcinoembryonic antigen in patients with a history of resected colorectal cancer. J Natl Compr Canc Netw. 2014;12(6):907–913. doi: 10.6004/jnccn.2014.0085.
- Barton MK. False elevations of carcinoembryonic antigen levels are common in patients under surveillance for colorectal cancer recurrence. CA Cancer J Clin. 2014;64(6):365–366. doi: 10.3322/caac.21247.
- Sakuma T, Iwata Y, Ueda Y, et al. Annual periodic increases in serum carcinoembryonic antigen concurrent with ground-glass opacity in the lung: report of a case. Surg Today. 2005;35(10):883–885. doi: 10.1007/s00595-005-3010-y.
- Yoshida A, Sekiya M, Naito M. A case of high serum carcinoembryonic antigen (CEA) level in summer season. Jpn J Med Tech. 2014;63:305–310.
- Brierley JD, Gospodarowicz MK, Wittekind CH, editors. TNM classification of malignant tumors. 8th ed. Oxford: Wiley-Blackwell; 2016.
- Epstein MM, Andrén O, Kasperzyk JL, et al. Seasonal variation in expression of markers in the vitamin D pathway in prostate tissue. Cancer Causes Control. 2012;23(8):1359–1366. doi: 10.1007/s10552-012-0016-9.
- Connolly D, van Leeuwen PJ, Bailie J, et al. Daily, monthly and seasonal variation in PSA levels and the association with weather parameters. Prostate Cancer Prostatic Dis. 2011;14(1):58–62. doi: 10.1038/pcan.2010.37.
- Oremek GM, Seiffert UB. Physical activity releases prostate-specific antigen (PSA) from the prostate gland into blood and increases serum PSA concentrations. Clin Chem. 1996;42(5):691–695. doi: 10.1093/clinchem/42.5.691.
- Giovannucci E. The epidemiology of vitamin D and cancer incidence and mortality: a review (United States). Cancer Causes Control. 2005;16(2):83–95. doi: 10.1007/s10552-004-1661-4.
- Wong JY, Mivechi NF, Paxton RJ, et al. The effects of hyperthermia on tumor carcinoembryonic antigen expression. Int J Radiat Oncol Biol Phys. 1989;17(4):803–808. doi: 10.1016/0360-3016(89)90070-9.
- Garland CF, Garland FC. Do sunlight and vitamin D reduce the likelihood of colon cancer? Int J Epidemiol. 2006;35(2):217–220. doi: 10.1093/ije/dyi229.
- Fakih MG, Padmanabhan A. CEA monitoring in colorectal cancer. What you should know. Oncology. 2006;20(6):579–587; discussion 588, 594, 596.
- Chen Q, Kong H, Qi X, et al. Carcinoembryonic antigen: a potential biomarker to evaluate the severity and prognosis of COVID-19. Front Med. 2020;7:579543. doi: 10.3389/fmed.2020.579543.
- Yang L, Tu L. Implications of gastrointestinal manifestations of COVID-19. Lancet Gastroenterol Hepatol. 2020;5(7):629–630. doi: 10.1016/S2468-1253(20)30132-1.
- Yu J, Yang Z, Zhou X, et al. Prognostic value of carcinoembryonic antigen on outcome in patients with coronavirus disease 2019. J Infect. 2020;81(2):e170–e172. doi: 10.1016/j.jinf.2020.06.018.
- Bañez LL, Hamilton RJ, Partin AW, et al. Obesity-related plasma hemodilution and PSA concentration among men with prostate cancer. JAMA. 2007;298(19):2275–2280. doi: 10.1001/jama.298.19.2275.
- Chang IH, Ahn SH, Han JH, et al. The clinical significance in healthy men of the association between obesity related plasma hemodilution and tumor marker concentration. J Urol. 2009;181(2):567–573; discussion 572–573. doi: 10.1016/j.juro.2008.10.030.
- Park JS, Choi GS, Jang YS, et al. Influence of obesity on the serum carcinoembryonic antigen value in patients with colorectal cancer. Cancer Epidemiol Biomarkers Prev. 2010;19(10):2461–2468. doi: 10.1158/1055-9965.EPI-10-0569.
- Park CH, Lizarraga AD, Lee YT, et al. Increased carcinoembryonic antigen (CEA) level is highly associated with low skeletal muscle mass in asymptomatic adults: a population-based study. J Clin Med. 2022;11(17):5009. doi: 10.3390/jcm11175009.
- Touitou Y, Proust J, Klinger E, et al. Cumulative effects of age and pathology on plasma carcinoembryonic antigen in an unselected elderly population. Eur J Cancer Clin Oncol. 1984;20(3):369–374. doi: 10.1016/0277-5379(84)90083-x.
- Bjornsson TD. Use of serum creatinine concentrations to determine renal function. Clin Pharmacokinet. 1979;4(3):200–222. doi: 10.2165/00003088-197904030-00003.