
Abstract
Background
Hantaan virus (HTNV) infection can cause severe hemorrhagic fever with renal syndrome (HFRS). Inflammatory monocytes (iMOs) are involved in early antiviral responses. Previous studies have found that blood iMOs numbers increase in the acute phase of HFRS. Here, we further identified the phenotypic characteristics of iMOs in HFRS and explored whether phenotypic changes in iMOs were associated with HFRS severity.
Materials and Methods
Blood samples from 85 HFRS patients were used for phenotypic analysis of iMOs by flow cytometry. Plasma HTNV load was determined using RT-PCR. THP-1 cells overexpressing CD226 were used to investigate the effects of CD226 on HLA-DR/DP/DQ and CD80 expression. A mouse model was used to test macrophage phenotype following HTNV infection.
Results
The proportion of CD226- iMOs in the acute phase of HFRS was 66.83 (35.05-81.72) %, which was significantly higher than that in the convalescent phase (5.32 (1.36-13.52) %) and normal controls (7.39 (1.15-18.11) %) (p < 0.0001). In the acute phase, the proportion of CD226- iMOs increased more in patients with more severe HFRS and correlated positively with HTNV load and negatively with platelet count. Notably, CD226- iMOs expressed lower levels of HLA-DR/DP/DQ and CD80 than CD226+ iMOs, and overexpression CD226 could enhance the expression of HLA-DR/DP/DQ and CD80. In a mouse model, HTNV also induced the expansion of CD226- macrophages, with decreased expression of I-A/I-E and CD80.
Conclusions
CD226- iMOs increased during HTNV infection and the decrease in CD226 hampered the expression of HLA-DR/DP/DQ and CD80, which may promote the immune escape of HTNV and exacerbate clinical symptoms.
1. Introduction
Hemorrhagic fever with renal syndrome (HFRS) is an acute infectious disease caused by hantavirus infection, with a mortality rate as high as 15%, which seriously threatens human health [Citation1]. Approximately 60,000–100,000 HFRS cases are reported worldwide each year, and the epidemic affects more than 70 countries. Among the Hantaviruses, Hantaan virus (HTNV), Seoul virus (SEOV), Dobrava virus (DOBV), and Puumala virus (PUUV) are mainly circulating in Eurasia. HTNV is a common pathogenic species that causes severe HFRS in China. Since the 1950s, China has reported over 1.56 million HFRS cases with a fatality rate of nearly 3.0%, accounting for 90% of the total reported cases worldwide [Citation2,Citation3]. Recently, pet rats induced a multistate outbreak of SEOV in the United States [Citation4]. Patients with HFRS are characterized by fever, thrombocytopenia, and even life-threatening shock and acute kidney injury [Citation5–7]. However, no specific therapy is currently available for HFRS because of the limited understanding of its pathogenesis [Citation8]. Therefore, further exploration of the mechanism by which HTNV infection leads to severe HFRS is required.
In our previous study, we found that the higher the plasma HTNV load in the early phase of HFRS, the more severe the disease [Citation9], which indicates that controlling the HTNV load at a lower level in the early stage of HFRS could help alleviate disease severity. Patients with mild/moderate HFRS during the early phase showed stronger HTNV-specific CD8+ and CD4+ T cell responses with enhanced cytotoxicity, while patients with severe or critical severity tended to have weak T cell responses [Citation10–12], implying that the earlier control of HTNV infection could relieve clinical symptoms of HFRS. In addition, compared with non-pathogenic hantaviruses, pathogenic hantaviruses such as HTNV can inhibit IFN-β production in vascular endothelial cells at an early stage, suggesting that early viral inhibition could alleviate HFRS disease [Citation13,Citation14]. Innate immune responses are the first line of host defence against viral infection and can clear or control the virus at a low level early in infection. Monocytes, important members of the innate immune system, are mainly distributed in the blood and participate in early antiviral immune responses. After viral infection, abnormal monocyte phenotypes are closely associated with the occurrence of clinical diseases [Citation15–17]. The change in blood monocyte phenotypes in HFRS patients during the acute phase may affect the early control of HTNV infection and then affect the condition of HFRS patients.
Human monocytes are defined by the International Union of Immunology as three subsets: classical (CD14++CD16-), intermediate (CD14++CD16+), and non-classical (CD14+CD16++) monocytes [Citation18]. CD14++CD16- and CD14++CD16+ monocyte subsets with significant pro-inflammatory effects are also known as inflammatory monocytes (iMOs), which have a phenotype similar to that of mouse Ly6Chi monocytes, CD14+CD16++ monocyte subsets crawling along the vessel wall, also known as patrolling monocytes (pMos), which resemble mouse Ly6Cdim monocytes [Citation19–21]. A previous study found that iMOs increased in the acute phase of HFRS, which may be involved in the pathogenesis of HFRS [Citation22,Citation23]. Here, we further analyzed whether the phenotype of blood iMOs is altered in patients with HFRS and is associated with disease severity, which may provide a basis for elucidating the role of monocyte responses in the pathogenesis of HFRS.
CD226 is a transmembrane glycoprotein that regulates the activation and cytotoxicity of T and NK cells, as well as the agglutination and activation of platelets [Citation24–26]. Notably, CD226 is highly expressed on the surface of iMOs and barely expressed on pMos under physiological conditions [Citation27], hinting that CD226 may confer unique functions to iMOs. During mouse cytomegalovirus (MCMV) infection, iMOs inhibit viral replication by acting through CD226 to increase intracellular inducible nitric oxide synthase production and release of pro-inflammatory cytokines, such as IL-6 and IL-12 [Citation28], suggesting that CD226 could enhance the antiviral ability of iMOs. Currently, the role of CD226 in iMOs has been poorly investigated in other infectious diseases. We examined whether the expression of CD226 on the surface of iMOs was involved in the progression of HFRS.
In this study, we found that the proportion of blood CD226- iMOs increased in the acute phase of HFRS. Importantly, the proportion of CD226- iMOs was higher in patients with more severe HFRS, correlated positively with plasma HTNV load and correlated negatively with platelet count. Notably, blood CD226- iMOs expressed lower levels of HLA-DR/DP/DQ and CD80 than CD226+ iMOs, and overexpression CD226 could enhance the expression of HLA-DR/DP/DQ and CD80. In a mouse model, HTNV infection also induced the expansion of spleen CD226- macrophages with decreased expression of I-A/I-E and CD80, further revealing the potential link between HTNV infection and the expansion of CD226- iMOs/macrophages with lower antigen presentation potential. This study provides new targets for the early control of HTNV replication and alleviation of clinical symptoms in patients with HFRS.
2. Materials and methods
2.1. Patients
All HFRS patients enrolled in this study were recruited from Tangdu Hospital of the Fourth Military Medical University (Xi’an, China) and Xi’an Eighth Hospital from 2018 to 2020. The clinical diagnosis of HFRS was confirmed serologically by the detection of specific IgM and IgG antibodies against the HTNV-nucleocapsid protein. According to the diagnostic criteria from the Prevention and Treatment Strategy of HFRS promulgated by the Ministry of Health in the People’s Republic of China, patients were classified into four clinical types (mild, moderate, severe, and critical) [Citation12,Citation29,Citation30]. Mild HFRS was defined as mild renal failure without an obvious oliguric stage and moderate as obvious symptoms of uremia, effusion (bulbar conjunctiva), haemorrhage (skin and mucous membrane), and renal failure with a typical oliguric stage. Patients with severe uremia, effusion (bulbar conjunctiva and either peritoneum or pleura), haemorrhage (skin and mucous membrane), and renal failure with oliguria (urine output, 50–500 mL/day) for ≤ 5 days or anuria (urine output <50 mL/day) for ≤ 2 days were defined as severe HFRS. Critical patients were considered to have ≥ 1 of the following symptoms: refractory shock, visceral haemorrhage, heart failure, pulmonary oedema, brain oedema, severe secondary infection, and severe renal failure with oliguria (urine output, 50–500 mL/day) for > 5 days, anuria (urine output, < 50 mL/day) for > 2 days, or a blood urea nitrogen level of > 42.84 mmol/L. According to clinical observations, HFRS is defined in five sequential stages: febrile, hypotensive, oliguric, diuretic, and convalescent. These stages are usually classified as the acute phase (febrile, hypotensive, and oliguric stages) or convalescent (Conv) phase (diuretic and convalescent stages) [Citation12,Citation31].
This study excluded patients with kidney diseases, cardiovascular diseases, autoimmune diseases, viral hepatitis, or other liver diseases. Patients who had received whole blood transfusions and transfusions of any blood components or blood products prior to sample collection were also excluded. Detailed characteristics of the enrolled patients are summarized in . A control group of 25 healthy volunteers with anti-HTNV negative or no HTNV risk factors was also enrolled as normal controls (NC).
Table 1. Clinical characteristics of the enrolled HFRS subjects.
2.2. Plasma and clinical data collection
Peripheral blood samples were collected during the hospitalization of patients with HFRS. The plasma of each patient was collected by centrifugation at 3,000 rpm for 20 min. The separated plasma was stored at −70 °C until use. Multiple thawings were avoided. Once defrosted, the plasma was recentrifuged at 2,500 rpm for 15 min prior to analysis. Complete blood counts and renal function tests were performed in all patients as part of routine clinical care.
2.3. Determination of plasma HTNV load
The TaqMan RT-PCR assay was performed to determine the HTNV load as previously described, using a C1000 thermal cycler (Bio-Rad Laboratories) [Citation9]. Briefly, HTNV viral RNA was extracted from the plasma samples of HFRS patients, and a real-time RT-PCR assay was conducted. The primers and probe were designed based on sequence alignment of the S segment of the HTNV standard strain 76–118 (NC_005218).
2.4. Analysis of iMOs by flow cytometry
Peripheral blood mononuclear cells (PBMCs) from HFRS patients and normal controls were isolated using standard Ficoll-Hypaque (Sigma-Aldrich, MO) density gradient centrifugation. PBMCs (1 × 10⁶) were subsequently stained with 5 μl FITC-labeled anti-human CD14 monoclonal antibody (mAb) (clone M5E2; BioLegend), 5 μl APC- or PE-labeled anti-human CD226 mAb (clone 11A8; BioLegend), 5 μl Percp/Cy5.5-labeled anti-human HLA-DR/DP/DQ mAb (clone Tü39; BioLegend), and 5 μl Brilliant Violet 785-labled anti-human CD80 mAb (clone 2D10; Biolegend) for 15 min at room temperature, washed, and analyzed using an ACEA NovoExpress system (Agilent Technologies, USA). Monocytes were gated based on their forward and side scatter characteristics and further divided into CD14++CD226- and CD14++CD226+ inflammatory monocytes (iMOs). The expression levels of HLA-DR/DP/DQ and CD80 on CD226- and CD226+ iMOs were evaluated using the mean fluorescence intensity (MFI). Matched isotype controls were used as negative controls.
For the percentage and phenotype analysis of mouse spleen CD226- and CD226+ macrophages after HTNV challenge, Alexa Fluor 488-labeled anti-mouse CD11b (clone M1/70; BioLegend), PE/Cy7-labeled anti-mouse I-A/I-E (clone M5/114.15.2; BioLegend), PE-labeled anti-mouse F4/80 (clone BM8; BioLegend), APC-labeled anti-mouse CD226 (clone 10E5; BioLegend), and Pacific blue-labelled anti-mouse CD80 (clone 16-10A1; BioLegend) mAbs were used.
2.5. CD226 overexpression in THP cells
THP-1 cells (ProcellCL-0233) were purchased from Procell Life Science&Technology Co., Ltd. The CD226 expression lentivirus vector GV513 (LV-CD226) was constructed by Genechem (Shanghai, China). Briefly, 1 × 10⁵ cells/ml were seeded in 24-well plates, and LV-CD226 or control virus CON335 was added at a multiplicity of infection (MOI) of 30 in complete RPMI 1640 for 16h at 37 °C. Then centrifuge at 200 g for 2 min, the supernatant was removed and the culture was continued in complete medium for 72h. Stable transfected cell lines were obtained using 2.00 μg/ml puromycin. The expression levels of HLA-DR/DP/DQ and CD80 in THP-1, CON335 transfected THP-1 and LV-CD226 transfected THP-1 were detected by flow cytometry using PE/Cy7-labeled anti-human HLA-DR/DP/DQ mAb (clone Tü39; BioLegend) and Brilliant Violet 785-labelled anti-human CD80 mAb (clone 2D10; BioLegend).
2.6. Infection of CD226-overexpressing THP-1 cells with HTNV
Previous studies have shown that HTNV can effectively infect macrophages derived from THP-1 cells [Citation32,Citation33]. Therefore, we induced THP-1 cells to differentiate into macrophages using phorbol 12-myristate 13-acetate (PMA). The CD226-overexpressing THP-1 cells were adjusted to a concentration of 5 × 10⁵ cells/ml in RPMI 1640 medium supplemented with 10% fetal bovine serum and 1% penicillin-streptomycin, and were stimulated with 100 ng/ml PMA in 6-well plates for 48 h, leading to the induction of THP-1 cells into macrophages. After that, the cells were rested in a PMA-free medium for 24 h. Subsequently, they were infected with HTNV or inactivated HTNV (MOI = 0.2) for 24 h. Then, the expression levels of CD226, HLA-DR/DP/DQ, and CD80 on the cell surface were detected using flow cytometry.
2.7. HTNV challenge
C57BL/6J mice were challenged with HTNV. A total of 5 × 10⁵ plaque-forming units of HTNV in 50 μl of medium was inoculated intraperitoneally. The mice in the control group received identical amounts of PBS. At each time point (3 days and 6 days), mice were euthanized to test the phenotypic changes in splenic macrophages. For immunological detection, mouse spleens were harvested, single cells were obtained by grinding the spleens, and flow cytometry was performed after red blood cell lysis. For virological analysis, spleen tissue samples were collected and immediately frozen at −80 °C. Subsequently, RNA was extracted from the samples for the detection of HTNV RNA load using real-time PCR [Citation34].
2.8. Statistical analysis
Statistical analysis was performed using GraphPad Prism software version 7 (GraphPad, La Jolla, CA, USA). The Kruskal–Wallis test was used to compare the three groups. The proportion of blood CD226- iMOs is presented as the median with the corresponding interquartile range (IQR). Pearson’s correlation test was used for correlation analysis. A paired t-test was used to analyze paired differences. p-Values (two-tailed) below 0.05 (p ≤ 0.05) were considered statistically significant.
3. Results
3.1. The proportion of CD226- iMOs dramatically increased in the acute phase of HFRS
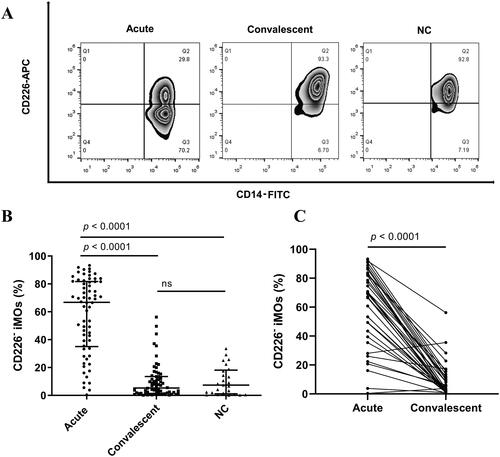
A total of 132 PBMCs from 85 patients with HFRS and 25 PBMCs from 25 healthy donors were examined in this study. Information on all enrolled HFRS subjects is summarized in . The representative gating populations of CD226- iMOs and CD226+ iMOs are shown in . The proportion of blood CD226- iMOs [66.83 (35.05–81.72) %] was significantly increased in the acute phase of HFRS patients compared with the proportion in the convalescent phase [5.32 (1.36–13.52) %] and normal controls [7.39 (1.15–18.11) %] (p < 0.0001, ). No significant difference was observed between the convalescent-phase patients and normal controls. Dynamic changes in the proportion of CD226- iMOs in the same individuals also showed the same tendency ().
Figure 1. The proportion of blood CD226- inflammatory monocyte (iMO) increased in patients with hemorrhagic fever with renal syndrome (HFRS). (A) Representative flow cytometric plots of the proportion of blood CD226- iMOs in the acute and convalescent phases of HFRS patients and normal controls (NC). (B) Comparison of the proportion of blood CD226- iMOs among the acute and convalescent phases of HFRS patients and NC. (C) Changes in the proportion of blood CD226- iMOs of the same individuals with HFRS. The difference between the three groups was determined by the Kruskal-Wallis test, and the black lines represent the medians with the corresponding interquartile range. The difference between the acute phase and convalescent phase of the same individuals was determined by Parried t-test. ns means no significant difference.
3.2. The proportion of blood CD226- iMOs correlated positively with the disease severity of HFRS
We subsequently analyzed whether the proportion of CD226- iMOs was associated with the disease severity. The proportion of patients in the critical/severe group was significantly higher than that in the moderate/mild group and normal controls in the acute phase of HFRS (critical/severe vs. moderate/mild, p = 0.0070; critical/severe vs. normal controls, p < 0.0001, ). The proportion in the moderate/mild group was also higher than that in the normal control group (p = 0.0143, ). In the convalescent phase, no significant differences were found between the different disease severity groups and normal controls (). The dynamic changes in the CD226- iMO proportion at each stage showed that the changes in critical and severe patients were more evident than those in mild and moderate patients, and the proportion returned to normal in patients at the diuretic and convalescent stages ().
Figure 2. The proportion of blood CD226- iMOs correlated positively with the disease severity of HFRS. (A) Comparison of the proportion of blood CD226- iMOs among critical/severe and moderate/mild patients in the acute phase and NC. (B) Comparison of the proportion of blood CD226- iMOs among critical/severe and moderate/mild patients in convalescent phase and NC. (C) Dynamic changes in the proportion of blood CD226- iMOs in patients with different disease severities from the fever stage to the convalescent stage. Correlation of the proportion of blood CD226- iMOs with (D) plasma HTNV viral load, (E) white blood count and (F) platelet count. The viral load, clinical parameters, and proportion of blood CD226- iMOs were analyzed from samples drawn on the same day. WBC: white blood count, PLT: platelet count. The difference among the three groups was determined by the Kruskal-Wallis test, and the black lines represent the medians with the corresponding interquartile range. The marks in C represent the median values of the proportion of CD226- iMOs. The Pearson correlation test was used for correlation analysis. The R denotes Pearson’s correlation coefficient. ns means no significant difference.
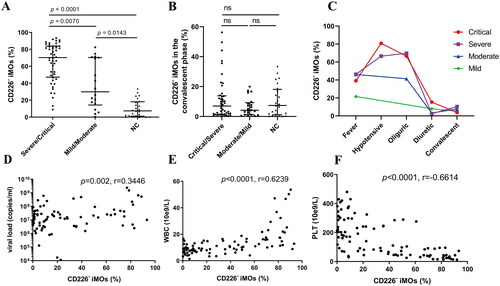
The relationships between the proportion of CD226- iMOs, HTNV load, and clinical parameters were analyzed, which could reflect the disease severity of HFRS. The HTNV load, clinical parameters, and proportion of CD226- iMOs were obtained from the samples drawn on the same day. The proportion of CD226- iMOs in HFRS patients showed a positive correlation with HTNV load (r = 0.3466, p = 0.0020, ) and white blood count (WBC) (r = 0.6239, p < 0.0001, ) and a negative correlation with platelet count (PLT) (r = −0.6641, p < 0.0001, ). In addition, there was a correlation between the proportion of CD226- iMOs and other platelet-related parameters, such as platelet distribution width, mean platelet volume, platelet-larger cell ratio, and platelet hematocrit (). Serum creatinine and albumin levels also exhibited a correlation with the proportion of CD226- iMOs in HFRS patients (Supplementary Figure 1(E and F)).
3.3. Blood CD226- iMOs exhibited lower antigen presenting potential
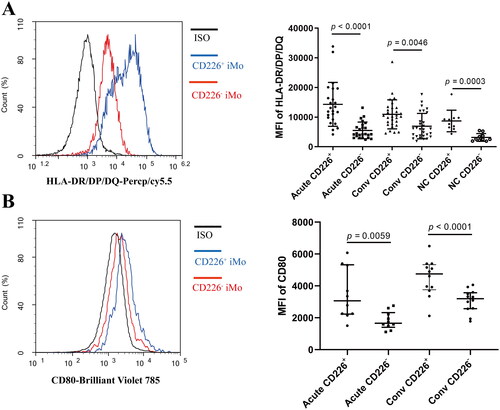
The antigen-presenting function is one of the important mechanisms by which monocytes/macrophages exert antiviral effects [Citation35]. Since the proportion of CD226- iMOs correlated negatively with HTNV load, we further analyzed whether the expression levels of antigen presentation-related molecules changed in the CD226- iMOs. Indeed, the expression level of HLA-DR/DP/DQ in CD226- iMOs was significantly lower than that in CD226+ iMOs in HFRS patients and normal controls (Acute CD226- vs. Acute CD226+, p < 0.0001; Conv CD226- vs. Conv CD226+, p = 0.0046; NC CD226- vs. NC CD226+, p = 0.0003, ). The expression level of the costimulatory molecule CD80 in CD226- iMOs was also significantly lower than that in CD226+ iMOs (Acute CD226- vs. Acute CD226+, p = 0.0059; Conv CD226- vs. Conv CD226+, p < 0.0001, ).
Figure 3. Blood CD226- iMOs exhibited lower antigen presenting potential. (A) Comparison of the expression levels of HLA-DR/DP/DQ between blood CD226+ and CD226- iMOs in the acute or convalescent phase of HFRS patients or NC. (B) Comparison of the expression levels of CD80 between blood CD226+ and CD226- iMOs in the acute or convalescent phase of HFRS patients. The differences between the two groups were analyzed by Parried t-test.
3.4. Overexpression of CD226 in THP-1 cells enhanced HLA-DR/DP/DQ and CD80 expression
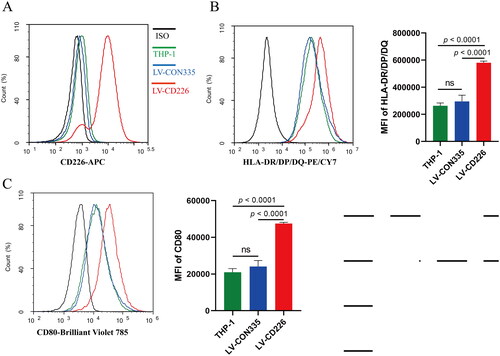
THP-1 is a human monocytic cell line with little CD226 expression; therefore, we constructed CD226 overexpressing THP-1 cells and examined the effect of CD226 on the expression of antigen presentation-related molecules in THP-1 cells. Following puromycin selection, THP-1 cells stably expressing CD226 were obtained (). Overexpression of CD226 significantly enhanced the expression levels of HLA-DR/DP/DQ (p < 0.0001, ) and CD80 (p < 0.0001, ) on the THP-1 cell surface, suggesting that CD226 could enhance the expression of HLA-DR/DP/DQ and CD80 in monocytes.
Figure 4. Overexpression of CD226 in THP-1 cells enhanced HLA-DR/DP/DQ and CD80 expression. (A) The successful construction of THP-1 cells overexpressing CD226. (B) Overexpression of CD226 enhanced the expression levels of HLA-DR/DP/DQ on THP-1 cells. (C) Overexpression of CD226 enhanced the expression levels of CD80 on THP-1 cells. LV-CD226 represents CD226 expression lentivirus vectors, CON335 represents the control virus. The difference between the three groups was tested by one-way ANOVA. ns means no significant difference.
To further validate the impairment of antigen presentation function in macrophages induced by HTNV infection, we infected CD226-overexpressing THP-1-derived macrophages with inactivated HTNV (mock) or HTNV. The results showed that HTNV infection resulted in a reduction of surface expression levels of CD226, HLA-DR/DP/DQ, and CD80 on CD226-overexpressing THP-1-derived macrophages, in comparison to those of inactivated HTNV or medium group (). This further confirmed that HTNV infection resulted in a weakened antigen presentation function of the macrophages.
3.5. HTNV challenge induced expansion of spleen CD226- macrophages with lower antigen presenting potential in mice
Because blood monocytes can enter the spleen to differentiate into macrophages, where they are involved in antigen presentation [Citation36], we developed a mouse model challenged with HTNV to investigate whether mouse spleen macrophages possess similar phenotypic changes after HTNV infection. Spleen F4/80+ macrophages also included CD226- and CD226+ populations, and the proportion of CD226- macrophages changed after HTNV infection (). The proportion of CD226- macrophages in the spleen of mice was significantly increased after three days of HTNV challenge and slightly decreased on the sixth day of the challenge, but still higher than that of the group without challenge (0 day vs. 3 days, p = 0.0019; 0 day vs. 6 days, p = 0.0079, ). Consistent with what has been found in human monocytes, mouse spleen CD226- macrophages also showed decreased expression of MHC-II molecule I-A/I-E (p = 0.0133 for 0 day; p = 0.0214 for 3 days; p = 0.0309 for 6 day, ) and costimulatory molecule CD80 (p = 0.0289 for 3 days; p = 0.0005 for 6 day, ) on cell surfaces, indicating that splenic CD226- macrophages also have lower antigen-presenting potential than CD226+ macrophages.
Figure 5. Hantaan virus (HTNV) challenge induced expansion of spleen CD226- macrophages with lower antigen presenting potential in mice. (A) Representative flow cytometric plots of the proportion of spleen CD226- macrophages in mice challenged with HTNV for different periods (0, 3 and 6 days). (B) Dynamic changes in the proportion of spleen CD226- macrophages in mice challenged with HTNV. Comparison of the expression levels of (C) I-A/I-E and (D) CD80 between the spleen CD226+ and CD226- macrophages. The differences between the two groups were analyzed by paired t-test. ns means no significant difference.
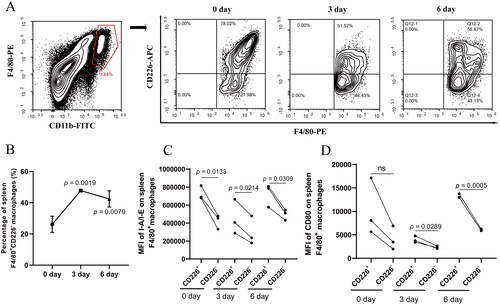
We also examined the RNA load of HTNV in the spleen tissues of mice. The results showed that the relative expression levels of HTNV S segment in the spleen significantly increased on the 3rd and 6th days after HTNV infection, with the highest levels observed on day 3 post-infection (0 day vs. 3 days, p = 0.0086; 0 day vs. 6 days, p = 0.0397, ). Additionally, on the third day, the proportion of CD226- macrophages in the spleen was found to be the highest (), providing further evidence that HTNV infection leads to the expansion of spleen CD226- macrophages.
4. Discussion
Hantaviruses have evolved multiple mechanisms to evade recognition and clearance by the immune system. Gn proteins of Hantavirus can inhibit RIG-I/TBK1-directed IRF3 phosphorylation and IFN-β induction [Citation14] and also induce mitophagy to facilitate mitochondrial antiviral signalling protein degradation, which delays host type I interferon responses [Citation37]. Transcriptional responses also indicate delayed activation of type I interferon responses in pathogenic hantavirus infections [Citation38]. In addition, hantaviruses strongly inhibit TRAIL-mediated extrinsic apoptosis induction in infected cells by downregulating death receptor 5 (DR5) cell surface expression and inhibiting granzyme B activity [Citation39,Citation40]. Both delayed type I interferon responses and reduced kill sensitivity may lead to high levels of plasma HTNV viral load and more severe clinical symptoms [Citation9]. Here, we found that the proportion of blood CD226- iMOs in the acute phase was significantly increased in patients with more severe HFRS and was positively correlated with plasma HTNV load. The increased proportion of blood CD226- iMOs with lower expression of HLA-R/DP/DQ and CD80 during HTNV infection may promote immune escape of HTNV by reducing the antigen-presenting function of iMOs.
Blood iMOs migrate to peripheral tissues, where they differentiate into macrophages, and then present viral peptides for recognition by CD4+ T cells through the MHC-II molecules HLA-DR/DP/DQ in humans or I-A/I-E in mice, and provide a second signal CD80/86 to activate CD4+ T cells, which amplify antiviral immune responses [Citation35,Citation41,Citation42]. During PUUV infection, iMOs redistribution from blood to tissues in patients with HFRS and monocytes remaining in circulation show impaired ability to respond to TLR stimulation, which may influence the severity of HFRS [Citation23, Citation43]. To examine changes in the macrophage phenotype following HTNV infection, we infected CD226-overexpressing THP-1-derived macrophages with inactivated HTNV (mock) or HTNV and constructed a mouse HTNV challenge model. The results of the cell experiment showed that HTNV infection resulted in a reduction of surface expression levels of CD226, HLA-DR/DP/DQ, and CD80 on CD226-overexpressing THP-1-derived macrophages. In mice challenged with HTNV, the proportion of CD226- spleen macrophages also increased and showed decreased expression of I-A/I-E and CD80, which is similar to what has been found in human CD226- iMOs, further revealing the impaired antigen-presenting function of CD226- iMOs and CD226- macrophages during HTNV infection.
Mouse CD11b+F4/80low small peritoneal macrophages (SPMs), but not CD11bhiF4/80hi large peritoneal macrophages (LPMs) strongly express CD226. SPMs can function as antigen-presenting cells and activate naïve CD4+ T cells, whereas LPMs cannot activate naïve CD4+ T cells. CD226 deletion inhibits the activation of naïve CD4+ T cells by SPMs [Citation42]. These results indicated that CD226 plays a key role in antigen presentation by macrophages. Here, we demonstrated that CD226 could enhance the expression of HLA-R/DP/DQ and CD80 in vitro, which may explain why macrophages with high CD226 expression can activate naïve CD4+ T cells. Further exploration of the mechanism by which CD226 regulates HLA-R/DP/DQ and CD80 expression has the potential to elucidate the conditions necessary for activating naïve CD4+ T cells.
Viral infection is an important extrinsic factor that causes changes in CD226 expression. Normal B cells do not express CD226, but EBV infection induces CD226 expression in B cells; MCMV infection in mice could increase CD226 expression on the surface of Ly6Chi monocytes [Citation28,Citation44]. A previous study demonstrated that the E3 ubiquitin ligase CBL-B can ubiquitinate CD226 and promote proteasome-dependent degradation of CD226 to reduce the surface expression of CD226 [Citation45]. Considering that HTNV could trigger proteasome-dependent degradation of DR5 by enhancing ubiquitination of DR5 [Citation39], it is possible that HTNV infection could reduce the expression of CD226 on iMOs and macrophages by promoting proteasome-dependent degradation of CD226. However, the exact mechanism by which HTNV infection leads to decreased CD226 expression in iMOs/macrophages remains to be explored.
5. Conclusions
The increased proportion of blood CD226- iMOs with lower expression of HLA-R/DP/DQ and CD80 was positively correlated with HFRS severity. CD226 enhanced the expression of HLA-R/DP/DQ and CD80, indicating that the antigen-presenting function of blood CD226- iMOs may be impaired in HFRS patients during the acute phase and may provide novel insights into the mechanism of HTNV immune escape.
Ethical approval
This study was conducted in accordance with the principles of the Declaration of Helsinki. Written informed consent was obtained from all participants. The research involving human materials was also approved by the Ethical Review Board of the Fourth Military Medical University (KY20183312-1). Animal experiments were approved by the Institutional Animal Care and Use Committee of the Fourth Military Medical University (20200469).
Author contributions
Conceptualization: KT, BJ, LC (Lihua Chen), and YM.; Data curation, CZ, RZ, and YZ; Formal analysis, KT, YH, LC (Linfeng Cheng), and YZ (Yusi Zhang); Funding acquisition, KT, CZ, YZ (Yun Zhang) and YM; Investigation, KT, YH, LC (Linfeng Cheng), and YZ (Yusi Zhang); Methodology, KT, YH, LC (Linfeng Cheng), and YM; Resources, JL, QQ, XZ, and XJ; Software, KT and YH; Supervision, LC (Lihua Chen) and YM; Validation, YH and YZ; Visualization, KT and YH; Writing – original draft, KT; Writing – review & editing, LC (Lihua Chen) and YM. All the authors have read and agreed to the published version of the manuscript.
Supplemental Material
Download Zip (6.4 MB)Disclosure statement
The authors report no conflict of interest.
Data availability statement
The data that support the findings of this study are available from the corresponding authors upon reasonable request.
Additional information
Funding
References
- Avsic-Zupanc T, Saksida A, Korva M. Hantavirus infections. Clin Microbiol Infect. 2019;21S:1–12. doi: 10.1111/1469-0691.12291.
- Shen L, Sun M, Wei X, et al. Spatiotemporal association of rapid urbanization and water-body distribution on hemorrhagic fever with renal syndrome: a case study in the city of Xi’an, China. PLoS Negl Trop Dis. 2022;16(1):e0010094. doi: 10.1371/journal.pntd.0010094.
- Tian H, Tie WF, Li H, et al. Orthohantaviruses infections in humans and rodents in Baoji, China. PLoS Negl Trop Dis. 2020;14(10):e0008778. doi: 10.1371/journal.pntd.0008778.
- Knust B, Brown S, de St Maurice A, et al. Seoul virus infection and spread in United States home-based ratteries: rat and human testing results from a multistate outbreak investigation. J Infect Dis. 2020;222(8):1311–1319. doi: 10.1093/infdis/jiaa307.
- Vaheri A, Strandin T, Hepojoki J, et al. Uncovering the mysteries of hantavirus infections. Nat Rev Microbiol. 2013;11(8):539–550. doi: 10.1038/nrmicro3066.
- Outinen TK, Mäkelä S, Pörsti I, et al. Severity biomarkers in puumala hantavirus infection. Viruses. 2021;14(1):45. doi: 10.3390/v14010045.
- De Smet MAJ, Bogaert S, Schauwvlieghe A, et al. Case report: hemorrhagic fever with renal syndrome presenting as hemophagocytic lymphohistiocytosis. Front Med (Lausanne). 2022;9:1096900. doi: 10.3389/fmed.2022.1096900.
- Hooper J, Paolino KM, Mills K, et al. A phase 2a randomized, Double-Blind, Dose-Optimizing study to evaluate the immunogenicity and safety of a bivalent DNA vaccine for hemorrhagic fever with renal syndrome delivered by intramuscular electroporation. Vaccines. 2020;8(3):377. doi: 10.3390/vaccines8030377.
- Yi J, Xu Z, Zhuang R, et al. Hantaan virus RNA load in patients having hemorrhagic fever with renal syndrome: correlation with disease severity. J Infect Dis. 2013;207(9):1457–1461. doi: 10.1093/infdis/jis475.
- Wang M, Wang J, Zhu Y, et al. Cellular immune response to Hantaan virus nucleocapsid protein in the acute phase of hemorrhagic fever with renal syndrome: correlation with disease severity. J Infect Dis. 2009;199(2):188–195. doi: 10.1086/595834.
- Ma Y, Wang J, Yuan B, et al. HLA-A2 and B35 restricted Hantaan virus nucleoprotein CD8+ T-cell epitope-specific immune response correlates with milder disease in hemorrhagic fever with renal syndrome. PLoS Negl Trop Dis. 2013;7(2):e2076. doi: 10.1371/journal.pntd.0002076.
- Ma Y, Yuan B, Zhuang R, et al. Hantaan virus infection induces both Th1 and ThGranzyme B + cell immune responses that associated with viral control and clinical outcome in humans. PLoS Pathog. 2015;11(4):e1004788. doi: 10.1371/journal.ppat.1004788.
- Au RY, Jedlicka AE, Li W, et al. Seoul virus suppresses NF-kappaB-mediated inflammatory responses of antigen presenting cells from Norway rats. Virology. 2010;400(1):115–127. doi: 10.1016/j.virol.2010.01.027.
- Matthys VS, Cimica V, Dalrymple NA, et al. Hantavirus GnT elements mediate TRAF3 binding and inhibit RIG-I/TBK1-directed beta interferon transcription by blocking IRF3 phosphorylation. J Virol. 2014;88(4):2246–2259. doi: 10.1128/JVI.02647-13.
- Wong KL, Yeap WH, Tai JJ, et al. The three human monocyte subsets: implications for health and disease. Immunol Res. 2012;53(1-3):41–57. doi: 10.1007/s12026-012-8297-3.
- Knoll R, Schultze JL, Schulte-Schrepping J. Monocytes and macrophages in COVID-19. Front Immunol. 2021;12:720109. doi: 10.3389/fimmu.2021.720109.
- Sampath P, Moideen K, Ranganathan UD, et al. Monocyte subsets: phenotypes and function in tuberculosis infection. Front Immunol. 2018;9:1726. doi: 10.3389/fimmu.2018.01726.
- Ziegler-Heitbrock L, Ancuta P, Crowe S, et al. Nomenclature of monocytes and dendritic cells in blood. Blood. 2010;116(16):e74-80–e80. doi: 10.1182/blood-2010-02-258558.
- Cros J, Cagnard N, Woollard K, et al. Human CD14dim monocytes patrol and sense nucleic acids and viruses via TLR7 and TLR8 receptors. Immunity. 2010;33(3):375–386. doi: 10.1016/j.immuni.2010.08.012.
- Schmidl C, Renner K, Peter K, et al. Transcription and enhancer profiling in human monocyte subsets. Blood. 2014;123(17):e90-99–e99. doi: 10.1182/blood-2013-02-484188.
- Auffray C, Fogg D, Garfa M, et al. Monitoring of blood vessels and tissues by a population of monocytes with patrolling behavior. Science. 2007;317(5838):666–670. doi: 10.1126/science.1142883.
- Tang K, Zhang C, Zhang Y, et al. Elevated plasma soluble CD14 levels correlate with the monocyte response status during hantaan virus infection in humans. Viral Immunol. 2015;28(8):442–447. doi: 10.1089/vim.2015.0040.
- Vangeti S, Strandin T, Liu S, et al. Monocyte subset redistribution from blood to kidneys in patients with Puumala virus caused hemorrhagic fever with renal syndrome. PLoS Pathog. 2021;17(3):e1009400. doi: 10.1371/journal.ppat.1009400.
- Martinet L, Ferrari De Andrade L, Guillerey C, et al. DNAM-1 expression marks an alternative program of NK cell maturation. Cell Rep. 2015;11(1):85–97. doi: 10.1016/j.celrep.2015.03.006.
- Scott JL, Dunn SM, Jin B, et al. Characterization of a novel membrane glycoprotein involved in platelet activation. J Biol Chem. 1989;264(23):13475–13482. doi: 10.1016/S0021-9258(18)80021-7.
- Bi JC. CD226: a potent driver of antitumor immunity that needs to be maintained. Cell Mol Immunol. 2022;19(9):969–970. doi: 10.1038/s41423-020-00633-0.
- Vo AV, Takenaka E, Shibuya A, et al. Expression of DNAM-1 (CD226) on inflammatory monocytes. Mol Immunol. 2016;69:70–76. doi: 10.1016/j.molimm.2015.11.009.
- Lenac Rovis T, Kucan Brlic P, Kaynan N, et al. Inflammatory monocytes and NK cells play a crucial role in DNAM-1-dependent control of cytomegalovirus infection. J Exp Med. 2016;213(9):1835–1850. doi: 10.1084/jem.20151899.
- Liu B, Ma Y, Zhang Y, et al. CD8low CD100- T cells identify a novel CD8 T cell subset associated with viral control during human hantaan virus infection. J Virol. 2015;89(23):11834–11844. doi: 10.1128/JVI.01610-15.
- Tang K, Zhang Y, Zhang C, et al. Hantaan virus-induced elevation of plasma osteoprotegerin and its clinical implications in hemorrhagic fever with renal syndrome. Int J Infect Dis. 2023;126:14–21. doi: 10.1016/j.ijid.2022.11.005.
- Tang K, Zhang C, Zhang Y, et al. Elevated plasma interleukin 34 levels correlate with disease severity-reflecting parameters of patients with haemorrhagic fever with renal syndrome. Infect Dis. 2019;51(11-12):847–853. doi: 10.1080/23744235.2019.1672887.
- Li Z, Shen Y, Song Y, et al. ER stress-related molecules induced by Hantaan virus infection in differentiated THP-1 cells. Cell Stress Chaperones. 2021;26(1):41–50. doi: 10.1007/s12192-020-01150-9.
- Ye W, Lei Y, Yu M, et al. NLRP3 inflammasome is responsible for Hantavirus inducing interleukin-1beta in THP-1 cells. Int J Mol Med. 2015;35(6):1633–1640. doi: 10.3892/ijmm.2015.2162.
- Xu-Yang Z, Pei-Yu B, Chuan-Tao Y, et al. Interferon-induced transmembrane protein 3 inhibits hantaan virus infection, and its single nucleotide polymorphism rs12252 influences the severity of hemorrhagic fever with renal syndrome. Front Immunol. 2016;7:535.
- Jakubzick CV, Randolph GJ, Henson PM. Monocyte differentiation and antigen-presenting functions. Nat Rev Immunol. 2017;17(6):349–362. doi: 10.1038/nri.2017.28.
- Hoffman D, Tevet Y, Trzebanski S, et al. A non-classical monocyte-derived macrophage subset provides a splenic replication niche for intracellular Salmonella. Immunity. 2021;54(12):2712–2723 e2716. doi: 10.1016/j.immuni.2021.10.015.
- Wang K, Ma H, Liu H, et al. The glycoprotein and nucleocapsid protein of hantaviruses manipulate autophagy flux to restrain host innate immune responses. Cell Rep. 2019;27(7):2075–2091.e5. e2075. doi: 10.1016/j.celrep.2019.04.061.
- Brocato RL, Altamura LA, Carey BD, et al. Comparison of transcriptional responses between pathogenic and nonpathogenic hantavirus infections in Syrian hamsters using NanoString. PLoS Negl Trop Dis. 2021;15(8):e0009592. doi: 10.1371/journal.pntd.0009592.
- Sola-Riera C, Gupta S, Maleki KT, et al. Hantavirus inhibits TRAIL-mediated killing of infected cells by downregulating death receptor 5. Cell Rep. 2019;28(8):2124–2139 e2126. doi: 10.1016/j.celrep.2019.07.066.
- Sola-Riera C, Gupta S, Ljunggren HG, et al. Orthohantaviruses belonging to three phylogroups all inhibit apoptosis in infected target cells. Sci Rep. 2019;9(1):834. doi: 10.1038/s41598-018-37446-1.
- Nakano H, Lin KL, Yanagita M, et al. Blood-derived inflammatory dendritic cells in lymph nodes stimulate acute T helper type 1 immune responses. Nat Immunol. 2009;10(4):394–402. doi: 10.1038/ni.1707.
- Takenaka E, Van Vo A, Yamashita-Kanemaru Y, et al. Selective DNAM-1 expression on small peritoneal macrophages contributes to CD4(+) T cell costimulation. Sci Rep. 2018;8(1):15180. doi: 10.1038/s41598-018-33437-4.
- Scholz S, Baharom F, Rankin G, et al. Human hantavirus infection elicits pronounced redistribution of mononuclear phagocytes in peripheral blood and airways. PLoS Pathog. 2017;13(6):e1006462. doi: 10.1371/journal.ppat.1006462.
- Grossman L, Chang C, Dai J, et al. Epstein-Barr virus induces adhesion receptor CD226 (DNAM-1) expression during primary B-cell transformation into lymphoblastoid cell lines. Msphere. 2017;2(6):e00305. 00317. doi: 10.1128/mSphere.00305-17.
- Braun M, Aguilera AR, Sundarrajan A, et al. CD155 on tumor cells drives resistance to immunotherapy by inducing the degradation of the activating receptor CD226 in CD8(+) T cells. Immunity. 2020;53(4):805–823 e815. doi: 10.1016/j.immuni.2020.09.010.