
 ?Mathematical formulae have been encoded as MathML and are displayed in this HTML version using MathJax in order to improve their display. Uncheck the box to turn MathJax off. This feature requires Javascript. Click on a formula to zoom.
Abstract
Objective
The identification of spinal tuberculosis subphenotypes is an integral component of precision medicine. However, we lack proper study models to identify subphenotypes in patients with spinal tuberculosis. Here we identified possible subphenotypes of spinal tuberculosis and compared their clinical results.
Methods
A total of 422 patients with spinal tuberculosis who received surgical treatment were enrolled. Clustering analysis was performed using the K-means clustering algorithm and the routinely available clinical data collected from patients within 24 h after admission. Finally, the differences in clinical characteristics, surgical efficacy, and postoperative complications among the subphenotypes were compared.
Results
Two subphenotypes of spinal tuberculosis were identified. Laboratory examination results revealed that the levels of more than one inflammatory index in cluster 2 were higher than those in cluster 1. In terms of disease severity, Cluster 2 showed a higher Oswestry Disability Index (ODI), a higher visual analysis scale (VAS) score, and a lower Japanese Orthopedic Association (JOA) score. In addition, in terms of postoperative outcomes, cluster 2 patients were more prone to complications, especially wound infections, and had a longer hospital stay.
Conclusion
K-means clustering analysis based on conventional available clinical data can rapidly identify two subtypes of spinal tuberculosis with different clinical results. We believe this finding will help clinicians to rapidly and easily identify the subtypes of spinal tuberculosis at the bedside and become the cornerstone of individualized treatment strategies.
1. Introduction
Tuberculosis is still a global public health problem and poses a serious threat to human health [Citation1]. Spinal tuberculosis accounts for around 50% of all bone and joint tuberculosis. It is one of the most severe and common extrapulmonary tuberculosis. As the disease progresses, bones are often severely damaged, causing scoliosis, affecting neural function, and severely affecting the quality of life of patients [Citation2,Citation3]. Unfortunately, a one-size fits all management and treatment approach is still implemented in clinical practice, which ignores the heterogeneity of spinal tuberculosis patients [Citation4]. Inadequate treatment and management are one of the reasons for poor prognosis [Citation5]. In addition, phenotypic heterogeneity is a major obstacle to tuberculosis management and personalized treatment. Completely understanding the inherent heterogeneity of tuberculosis is essential to formulate efficient intervention strategies [Citation6]. Because the pathogenesis of spinal tuberculosis has not been elucidated, it is difficult to explain and predict the characteristics of patients with spinal tuberculosis.
Machine learning algorithms are widely used in clinical practice [Citation7,Citation8], especially in the diagnosis of tuberculosis [Citation9]. Machine learning has shown strong effectiveness, as evidenced by the study conducted by Orjuela-Cañón et al. which indicates that ML algorithms can serve as effective diagnostic tools for tuberculosis, especially in settings with limited healthcare infrastructure [Citation10]. Aguiar FS et al. have also developed models based on artificial neural networks for classifying hospitalized patients and risk allocation in environments with high tuberculosis prevalence [Citation11]. And cluster analysis is a typical unsupervised machine learning method, which can effectively, accurately, and reasonably identify phenotypic heterogeneity according to the characteristics of patients’ diseases and classify heterogeneous queues [Citation12]. Among these, the K-means clustering analysis is a good clustering method and is widely used in clinical practice [Citation13,Citation14]. For instance, Koo et al. successfully identified five phenotypes of pulmonary tuberculosis through K-means cluster analysis. Patients with these five phenotypes had significant differences in their symptoms and microbiological and radiological examination results. Thus this analysis provides a hierarchical medical method and has become the cornerstone of individualized treatment strategies [Citation15]. In addition, K-means clustering analysis has been successfully applied to identify the subphenotypes of spinal tumors, sepsis, and other diseases [Citation16,Citation17]. However, no useful classification tool has been developed to identify the heterogeneity of spinal tuberculosis. Therefore, we proposed a K-means clustering method based on which only the routine available clinical data collected by patients within 24 h after admission can be used to identify subphenotypes of spinal tuberculosis. Finally, we compared the differences between the clusters in terms of clinical characteristics, surgical efficacy, and postoperative complications, and verified the accuracy of clustering.
2. Materials and methods
2.1. Patient
We reviewed and analyzed the perioperative clinical data of patients who received surgical treatment for spinal tuberculosis in the First Affiliated Hospital of Guangxi Medical University from June 2012 to June 2021. Inclusion criteria were [Citation1] Clinical symptoms consistent with spinal tuberculosis: These encompass chronic back pain, progressive spinal deformity, weight loss, fatigue, and nocturnal sweating, etc [Citation2]. Radiological manifestations consistent with spinal tuberculosis: These encompass vertebral body osteolysis, and the formation of abscesses, etc [Citation3]. Lesions confirmed through percutaneous biopsy or postoperative pathological examination, showing pathological features of spinal tuberculosis such as caseous necrosis and granuloma, and further validated through culture to establish the presence of Mycobacterium tuberculosis [Citation4], complete clinical data [Citation5], no surgical history affecting the spine. The exclusion criteria were [Citation1] pathological diagnosis after the operation is unclear [Citation2], complicated with tumour or other immune-related diseases [Citation3], incomplete clinical information, and [Citation4] history of surgery affecting the spine. A total of 422 patients were included in the study (253 males and 169 females). In addition, the general information of patients, preoperative laboratory examination results, surgical conditions, postoperative complications, etc., were collected from the electronic medical record system. The study was approved by the Ethics Committee of the First Affiliated Hospital of Guangxi Medical University.
2.2. Data collection
General information about the patient collected included age, gender, body mass index (BMI), Oswestry Disability Index (ODI), Japanese Orthopedic Association (JOA) scores, and visual analog scale (VAS). Using the clinical data of patients, ODI, JOA, and VAS scores were jointly evaluated by two senior specialists for each patient. Patient’s laboratory test results, including C-reactive protein (CRP), erythrocyte sedimentation rate (ESR), white blood cells (WBC), haemoglobin, platelets, neutrophils, lymphocytes, monocytes, total protein (TP), albumin, monocyte count to lymphocyte count ratio (MLR), platelet count to monocyte count ratio (PMR), platelet count to lymphocyte count ratio (PLR), neutrophil count to lymphocyte count ratio (NLR), platelet count to neutrophil count ratio (PNR), C-reactive protein to albumin ratio (CAR), and Systemic Immune-Inflammation Index (SII) were collected. SII was calculated using the following formula: (neutrophil count × platelet count)/lymphocyte count [Citation18]. Patients’ surgical data, including operation time (OT), bleeding volume (BV), blood transfusion, postoperative drainage volume (PDV), length of hospital stay (LOS) and postoperative complications, were collected. Postoperative complications were defined as surgical wound infections or systemic infections, internal fixation failures, thrombosis, respiratory failure, cerebrospinal fluid leakage, and other surgery-related diseases.
2.3. Cluster analysis
We performed the K-means cluster analysis based on the preoperative age, gender, BMI, WBC, haemoglobin, platelets, neutrophils, lymphocytes, monocytes, TP, albumin, ESR, MLR, PMR, PLR, NLR, PNR, SII and CAR of patients with spinal tuberculosis. K-means clustering can classify the data of unknown labels into different groups according to data characteristics. It is a clustering algorithm based on division, where each group of data is also called a “cluster,” and the center point of each cluster is called a “centroid.” The sample points close to the cluster centroid can be divided into the same cluster by calculating the Euclidean distance between the sample point and the cluster centroid [Citation19]. The similarity between the two samples is measured by the Euclidean distance between them. As the distance between the two samples increases, it decreases the similarity between them [Citation20]. Firstly, we used the Scale function in the “factoextra” package to standardize the data [Citation21], and calculate the Hopkins statistics using the get cluster density function to evaluate the clustering trend of the dataset. Then perform K-means clustering analysis with the following specific steps [Citation1]: K initial centroids are randomly selected, then calculate the distance from each sample point to the initial centroids and assign it to the nearest initial centroid. This will generate K clusters [Citation2]. For each cluster, calculate the average distance of all sample points assigned to that cluster as the new centroid [Citation3]. Repeat this process until the centroid positions remain unchanged. Finally, use the silhouette coefficient (SC) to find the optimal number of clusters (K value) [Citation19,Citation20]. The specific formula for calculating SC is as follows:
In this formula, a(i) represents the average distance between the sample point and all other points in the same cluster, while b(i) represents the average distance between the sample point and all points in the next nearest cluster. For each cluster, the intra-cluster difference is small, while the inter-cluster difference is large, which is what the K-means clustering algorithm pursues, and SC is the key indicator to describe the intra-cluster and inter-cluster differences. From the formula, we can see that the value range of SC is (−1, 1). When SC approaches 1, the clustering effect is better; The closer it is to −1, the worse the clustering effect [Citation22]. This process is achieved through the “Fpc” package. All processes are performed using the R software (version 4.2.1)
2.4. Statistical analysis
SPSS (IBM version 26.0) and R statistical software (version 4.2.1) were used for statistical analysis. A t-test or Mann–Whitney U test was used for continuous variables, and the chi-square test or Fisher’s exact test was used for categorical variables. Pearson’s test was used for correlation analysis of normally distributed data, whereas Spearman’s test was used for non-normally distributed data. For normally distributed continuous variables are expressed as mean ± standard deviation (SD). For non-normally distributed continuous variables are expressed as the median (percentiles). A p < 0.05 was defined as a statistical difference.
3. Result
3.1. Cluster analysis results
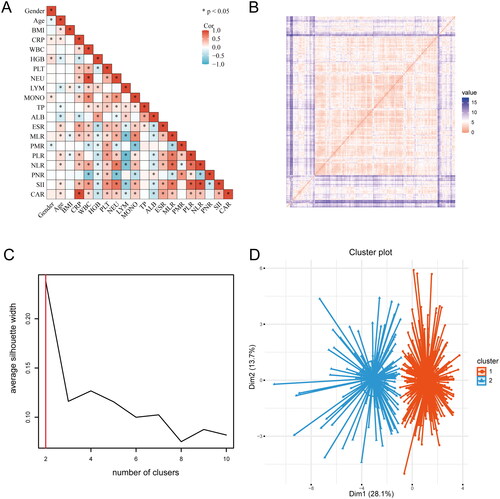
To understand the correlation between variables, a correlation matrix () was built to identify relationships between the variables, indicating that most variables have correlations between them. The cluster analysis results revealed the value of Hopkins statistics (0.815) and ordered dissimilarity matrix, which indicated that the dataset was significantly clusterable (). SC is a key indicator to describe the difference between inside and outside clusters. Through comparison, we found that when the clustering with K = 2 was found to have a higher Silhoutte score of 0.24, and the clustering effect was the best (). Therefore, 422 patients with spinal tuberculosis were finally clustered into clusters 1 and 2 ().
Figure 1. The process of K-means cluster analysis. (A) The correlation matrix. (B) The ordered dissimilarity matrix. (C) Optimal clustering number of the K-means clustering algorithm was determined by Silhouette coefficient (SC). (D) Scatter plots of patients’clinical data. Scatter points on the graph represent each patient, and the K-means clustering algorithm divides patients into two clusters.
3.2. Studying patients’ characteristics by K-means clustering
A comparative analysis of preoperative variables between clusters revealed that the age of cluster 1 was lower than that of cluster 2 (p = 0.001). Haemoglobin, lymphocytes, albumin, PMR and PNR of cluster 1 were higher than those of cluster 2 (all p < 0.01). However, the CRP, WBC, platelets, neutrophils, monocytes, and ESR indexes of cluster 2 were higher than those of cluster 1 (all p < 0.001). In addition, the MLR, PLR, NLR, CAR, and SII indexes of cluster 2 were higher than those of cluster 1 (all p < 0.001). There was no significant difference in gender, BMI, and TP between the two clusters (all p > 0.05) (). The difference in preoperative variables between the two groups was well displayed on the radar chart ().
Figure 2. The radar chart of preoperative variables of spinal tuberculosis patients in two clusters. The K-means clustering algorithm normalized preoperative variables were compared between two clusters. Spoke lengths represent the average of each variable after the K-means clustering algorithm is normalized. Significance levels are presented with asterisks. **p-value < 0.01, ***p-value < 0.001.
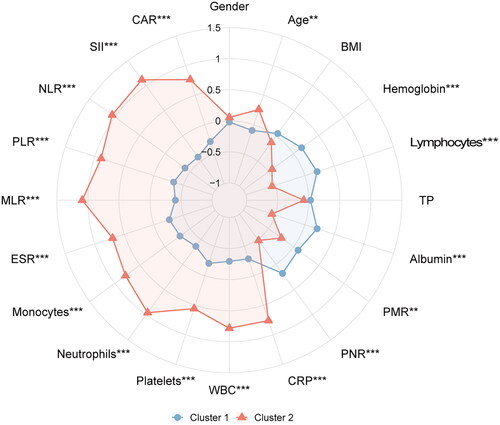
Table 1. Baseline characteristics of the study patients by clusters.
3.3. Comparison of disease severity among clusters
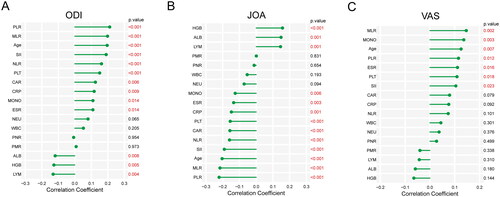
A comparison and analysis of the scores of ODI, JOA, and VAS among clusters revealed found that the scores of ODI and VAS in cluster 2 were significantly higher than those in cluster 1 (p < 0.001 and p < 0.05), whereas the scores of JOA in cluster 1 were significantly higher than those in cluster 2 (p < 0.001) (). It showed that cluster 2 had a higher disease severity. Correlation analysis revealed that multiple indicators were related to the severity of the disease. Among them, PLR, MLR, age, and SII had a strong positive correlation with ODI and VAS scores, and a strong negative correlation with JOA scores (all p < 0.05), indicating that age, PLR, MLR, and SII were positively related to the severity of the disease ().
Figure 3. Comparison of disease severity between two clusters of spinal tuberculosis patients. (A) The differences in ODI scores between two clusters. (B) The differences in JOA scores between two clusters. (C) The differences in VAS scores between two clusters. *p-value < 0.05, ***p-value < 0.001.
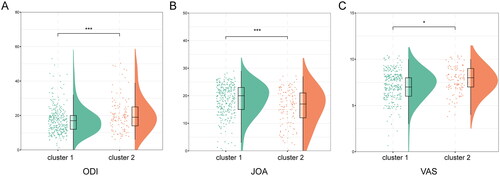
Figure 4. Correlation analysis between preoperative variables and disease severity. (A) Correlation between ODI score and preoperative variables. (B) Correlation between JOA score and preoperative variables. (C) Correlation between VAS score and preoperative variables.
3.4. Comparison of surgical and postoperative variables among clusters
A comparison and analysis of the differences in surgical and postoperative variables between clusters revealed that the incidence of postoperative complications in cluster 2 was higher than that in cluster 1 (p < 0.05). Further analysis revealed that cluster 2 had a higher incidence of surgical wound infections than cluster 1 (p < 0.05). In addition, the hospitalization time of cluster 2 was longer than that of cluster 1 (p < 0.05) ().
Table 2. Postoperative conditions of two clusters of patients.
The operative and postoperative variables, such as operation time, bleeding volume, blood transfusion, drainage volume, pulmonary infection, pleural effusion, gastrointestinal reaction, thrombosis, respiratory failure, and other complications, were similar among the clusters (p > 0.05) (). The radar map showed the differences in surgical and postoperative variables among clusters ().
Figure 5. The radar chart of postoperative variables of spinal tuberculosis patients in two clusters. The K-means clustering algorithm normalized postoperative variables and were compared between two clusters. Spoke lengths represent the average of each variable after the K-means clustering algorithm is normalized. Significance levels are presented with asterisks. *p-value < 0.05, **p-value < 0.01.
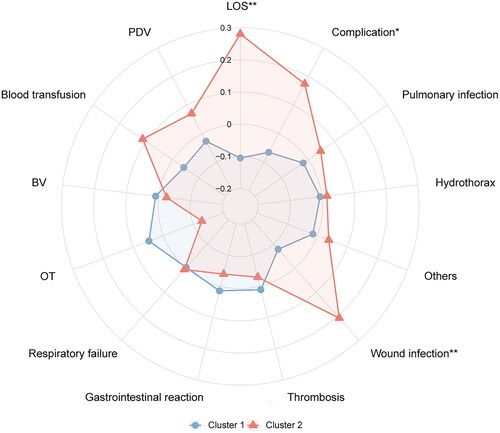
Table 3. Postoperative conditions of two clusters of patients.
4. Discussion
Identification of different subphenotypes is a key component of personalized medicine. Identification of different subphenotypes of spinal tuberculosis will lead to better risk stratification and treatment decisions. However, one of the biggest challenges of subphenotype identification is how to translate research into clinical practice [Citation14]. Therefore, we only used the patient’s age, gender, BMI, and 16 routinely available preoperative laboratory examination results as factors to ensure that the study adhered to clinical practice guidelines and had higher clinical significance. In addition, we could accurately identify the subphenotypes of spinal tuberculosis through K-means cluster analysis.
Clustering analysis is typical unsupervised learning, which can reveal the inherent properties of samples and the laws of their relationships. It is widely used in different fields, including clinical medicine and bioinformatics, one of which is used for disease classification [Citation23]. Among several clustering analysis methods, K-means clustering is one of the commonly used clustering analysis algorithms [Citation24] because it can maximize the separation of clusters and provide the largest range [Citation25] for identifying different groups of patients. It has been successfully used to identify subtypes of sepsis [Citation26], pulmonary tuberculosis [Citation15], and cervical spondylotic myelopathy [Citation27]. Therefore, we selected the K-means cluster analysis and successfully identified two phenotypes based on the conventional available natural characteristics of patients with spinal tuberculosis rather than prior knowledge, which enabled us to further study these characteristics and highlight those related to medical research assumptions. This method provides a more meaningful description and the distinction between patient groups in the queue [Citation28]. Comparative analysis revealed that cluster 2 had higher disease severity. In the postoperative outcome, the incidence of complications in cluster 2 was significantly higher than that in cluster 1, especially wound infections and a longer hospital stay. In conclusion, this finding could be used as a significant reference for the prognosis stratification of patients with spinal tuberculosis in clinical practice.
ESR and CRP are commonly used indicators to evaluate the infection degree of inflammatory diseases [Citation29]. A multicenter retrospective cohort study reported that the elderly and the increased ESR after treatment were the key factors for poor surgical prognosis of patients with spinal tuberculosis [Citation30]. A study reported MLR as an inflammatory marker of tuberculosis, which is related to its severity [Citation31]. Similarly, Chen et al. showed that MLR is an independent factor for the severity of spinal tuberculosis [Citation32]. Monocytes can promote the release of inflammatory mediators after pathogen invasion. They transform into macrophages to participate in immune responses [Citation33]. Research has shown that a low lymphocyte count is intricately related to inflammation [Citation34], which could cause an MLR imbalance in inflammatory diseases. In addition, PLR and SII are important markers of inflammation which are significantly expressed in several diseases and are intricately related to the prognosis of diseases [Citation35–37]. Albumin and haemoglobin are important nutrients for the human body [Citation38]. Chen et al. reported that albumin is an important predictor of surgical site infection in patients with spinal tuberculosis. A lower albumin value is related to a higher risk of surgical site infections [Citation39]. In the two sub-phenotypes identified, the level of age, CRP, ESR, monocytes, MLR, PLR, and SII in cluster 2 was significantly higher than that in cluster 1, whereas haemoglobin, lymphocytes and albumin were significantly lower than that in cluster 1. To summarize, patients in Cluster 2 had more serious diseases and worse prognoses than those in Cluster 1.
We used a classification method based on routinely available clinical data to further understand the subphenotypes of spinal tuberculosis. This can evaluate the severity of spinal tuberculosis and the differences in prognosis or treatment in clinical practice. However, this method for classifying patients with spinal tuberculosis requires additional external validation before its clinical implementation.
This study had several limitations: firstly, k-means is a widely used algorithm in different fields. However, it has some disadvantages such as being sensitive to outliers, hard-working with categorical variables, initialization issues, and election of number of the clusters, among others. Secondly, although we strive to minimize the potential impact of collinearity by standardizing the data. However, collinearity is still an issue that cannot be ignored, which may have an impact on the distance measurement between variables, thereby affecting the clustering results of the K-means algorithm. Thirdly, the sample size of this study was small and it was a single-center, retrospective study, which could have resulted in inevitable selection bias. In the future, the sample size should be increased and further verified by a multicenter, prospective study. In addition, the surgeon’s preferences and experience could affect the results of the study.
Conclusion
K-means clustering analysis based on conventional available clinical data can rapidly identify two subtypes of spinal tuberculosis with different clinical results. We believe this finding will help clinicians rapidly and easily identify the subtypes of spinal tuberculosis at the bedside. Thus, it has the potential to become the cornerstone of individualized treatment strategies.
Ethics approval
This study was approved by The Ethics Committee of the First Affiliated Hospital of Guangxi Medical University.
Author contribution
SW, YY, and XZ designed the study. CH, SF, CZ and JZ analyzed the data. BZ, LL, SW and ZM processed the digital visualization. SW wrote and revised the manuscript. CL and XZ revised the manuscript. All authors read and approved the final manuscript. All co-authors participated in the laboratory operation. All authors read and approved the final manuscript.
Consent form
Informed consent was obtained from all participants and/or their legal guardians.
Acknowledgment
We are grateful to Dr. Xinli Zhan (Spine and Osteopathy Ward, The First Affiliated Hospital of Guangxi Medical University) for his kindly assistance in all stages of the present study.
Disclosure statement
The authors declare that they have no conflicts of interest.
Data availability statement
The original contributions presented in the study are included in the article. Further inquiries can be directed to the corresponding author.
Additional information
Funding
References
- Chakaya J, Khan M, Ntoumi F, et al. Global tuberculosis report 2020 – reflections on the global TB burden, treatment and prevention efforts. Int J Infect Dis. 2021;113(Suppl 1):1–10. doi: 10.1016/j.ijid.2021.02.107.
- Garcia-Rodriguez JF, Alvarez-Diaz H, Lorenzo-Garcia MV, et al. Extrapulmonary tuberculosis: epidemiology and risk factors. Enferm Infecc Microbiol Clin. 2011;29(7):502–509. doi: 10.1016/j.eimc.2011.03.005.
- Khanna K, Sabharwal S. Spinal tuberculosis: a comprehensive review for the modern spine surgeon. Spine J. 2019;19(11):1858–1870. doi: 10.1016/j.spinee.2019.05.002.
- Zhuang QK, Li W, Chen Y, et al. Application of oblique lateral interbody fusion in treatment of lumbar spinal tuberculosis in adults. Orthop Surg. 2021;13(4):1299–1308. doi: 10.1111/os.12955.
- Srinivasa R, Furtado SV, Kunikullaya KU, et al. Surgical management of spinal tuberculosis – a retrospective observational study from a tertiary care center in Karnataka. Asian J Neurosurg. 2021;16(4):695–700. doi: 10.4103/ajns.AJNS_78_21.
- Cadena AM, Fortune SM, Flynn JL. Heterogeneity in tuberculosis. Nat Rev Immunol. 2017;17(11):691–702. doi: 10.1038/nri.2017.69.
- Maddali MV, Churpek M, Pham T, et al. Validation and utility of ARDS subphenotypes identified by machine-learning models using clinical data: an observational, multicohort, retrospective analysis. Lancet Respir Med. 2022;10(4):367–377. doi: 10.1016/S2213-2600(21)00461-6.
- Kobayashi M, Huttin O, Magnusson M, et al. Machine learning-derived echocardiographic phenotypes predict heart failure incidence in asymptomatic individuals. JACC Cardiovasc Imaging. 2022;15(2):193–208. doi: 10.1016/j.jcmg.2021.07.004.
- Orjuela-Canon AD, Camargo Mendoza JE, Awad Garcia CE, et al. Tuberculosis diagnosis support analysis for precarious health information systems. Comput Methods Programs Biomed. 2018;157:11–17. doi: 10.1016/j.cmpb.2018.01.009.
- Orjuela-Canon AD, Jutinico AL, Awad C, et al. Machine learning in the loop for tuberculosis diagnosis support. Front Public Health. 2022;10:876949. doi: 10.3389/fpubh.2022.876949.
- Aguiar FS, Torres RC, Pinto JV, et al. Development of two artificial neural network models to support the diagnosis of pulmonary tuberculosis in hospitalized patients in Rio De Janeiro, Brazil. Med Biol Eng Comput. 2016;54(11):1751–1759. doi: 10.1007/s11517-016-1465-1.
- Wang Z, Tang Z, Zhu Y, et al. AD risk score for the early phases of disease based on unsupervised machine learning. Alzheimers Dement. 2020;16(11):1524–1533. doi: 10.1002/alz.12140.
- Sanchez-Pinto LN, Luo Y, Churpek MM. Big data and data science in critical care. Chest. 2018;154(5):1239–1248. doi: 10.1016/j.chest.2018.04.037.
- Reddy K, Sinha P, O’Kane CM, et al. Subphenotypes in critical care: translation into clinical practice. Lancet Respir Med. 2020;8(6):631–643. doi: 10.1016/S2213-2600(20)30124-7.
- Koo HK, Min J, Kim HW, et al. Cluster analysis categorizes five phenotypes of pulmonary tuberculosis. Sci Rep. 2022;12(1):10084. doi: 10.1038/s41598-022-13526-1.
- Massaad E, Bridge CP, Kiapour A, et al. Evaluating frailty, mortality, and complications associated with metastatic spine tumor surgery using machine learning-derived body composition analysis. J Neurosurg Spine. 2022;37(2): 263-273..
- Chaudhary K, Vaid A, Duffy A, et al. Utilization of deep learning for subphenotype identification in sepsis-associated acute kidney injury. Clin J Am Soc Nephrol. 2020;15(11):1557–1565. doi: 10.2215/CJN.09330819.
- Kaller R, Arbanasi EM, Muresan AV, et al. The predictive value of systemic inflammatory markers, the prognostic nutritional index, and measured vessels’ diameters in arteriovenous fistula maturation failure. Life. 2022;12(9):1447. doi: 10.3390/life12091447.
- Nedyalkova M, Madurga S, Simeonov V. Combinatorial K-Means clustering as a machine learning tool applied to diabetes mellitus type 2. Int J Environ Res Public Health. 2021;18(4):1919. doi: 10.3390/ijerph18041919.
- Rollan-Martinez-Herrera M, Kerexeta-Sarriegi J, Gil-Anton J, et al. K-Means clustering for shock classification in pediatric intensive care units. Diagnostics. 2022;12(8):1932. doi: 10.3390/diagnostics12081932.
- Wu S, Liu S, Chen N, et al. Genome-wide identification of immune-related alternative splicing and splicing regulators involved in abdominal aortic aneurysm. Front Genet. 2022;13:816035. doi: 10.3389/fgene.2022.816035.
- Sun X, Zhou C, Zhu J, et al. Identification of clinical heterogeneity and construction of a novel subtype predictive model in patients with ankylosing spondylitis: an unsupervised machine learning study. Int Immunopharmacol. 2023;117:109879. doi: 10.1016/j.intimp.2023.109879.
- Benito-Leon J, Del Castillo MD, Estirado A, et al. Using unsupervised machine learning to identify age- and sex-independent severity subgroups among patients with COVID-19: an observational longitudinal study. J Med Internet Res. 2021;23(5):e25988. doi: 10.2196/25988.
- Bakker DS, de Graaf M, Nierkens S, et al. Unraveling heterogeneity in pediatric atopic dermatitis: identification of serum biomarker based patient clusters. J Allergy Clin Immunol. 2022;149(1):125–134. doi: 10.1016/j.jaci.2021.06.029.
- Hu C, Li L, Huang W, et al. Interpretable machine learning for early prediction of prognosis in sepsis: a discovery and validation study. Infect Dis Ther. 2022;11(3):1117–1132. doi: 10.1007/s40121-022-00628-6.
- Hu C, Li Y, Wang F, et al. Application of machine learning for clinical subphenotype identification in sepsis. Infect Dis Ther. 2022;11(5):1949–1964. doi: 10.1007/s40121-022-00684-y.
- Zhou C, Huang S, Liang T, et al. Machine learning-based clustering in cervical spondylotic myelopathy patients to identify heterogeneous clinical characteristics. Front Surg. 2022;9:935656. doi: 10.3389/fsurg.2022.935656.
- Sweatt AJ, Hedlin HK, Balasubramanian V, et al. Discovery of distinct immune phenotypes using machine learning in pulmonary arterial hypertension. Circ Res. 2019;124(6):904–919. doi: 10.1161/CIRCRESAHA.118.313911.
- Bray C, Bell LN, Liang H, et al. Erythrocyte sedimentation rate and C-reactive protein measurements and their relevance in clinical medicine. WMJ. 2016;115(6):317–321.
- Kim JH, Ahn JY, Jeong SJ, et al. Prognostic factors for unfavourable outcomes of patients with spinal tuberculosis in a country with an intermediate tuberculosis burden: a multicentre cohort study. Bone Joint J. 2019;101-B(12):1542–1549. doi: 10.1302/0301-620X.101B12.BJJ-2019-0558.R1.
- Buttle TS, Hummerstone CY, Billahalli T, et al. The monocyte-to-lymphocyte ratio: sex-specific differences in the tuberculosis disease spectrum, diagnostic indices and defining normal ranges. PLoS One. 2021;16(8):e0247745. doi: 10.1371/journal.pone.0247745.
- Chen L, Liu C, Liang T, et al. Monocyte-to-Lymphocyte ratio was an independent factor of the severity of spinal tuberculosis. Oxid Med Cell Longev. 2022;2022:7340330.
- Refai A, Gritli S, Barbouche MR, et al. Mycobacterium tuberculosis virulent factor ESAT-6 drives macrophage differentiation toward the pro-inflammatory M1 phenotype and subsequently switches it to the anti-inflammatory M2 phenotype. Front Cell Infect Microbiol. 2018;8:327. doi: 10.3389/fcimb.2018.00327.
- Gravani F, Papadaki I, Antypa E, et al. Subclinical atherosclerosis and impaired bone health in patients with primary Sjogren’s syndrome: prevalence, clinical and laboratory associations. Arthritis Res Ther. 2015;17(1):99. doi: 10.1186/s13075-015-0613-6.
- Zhou J, Song S, Zhang Y, et al. OCT-Based biomarkers are associated with systemic inflammation in patients with treatment-naive diabetic macular edema. Ophthalmol Ther. 2022;11(6):2153–2167. doi: 10.1007/s40123-022-00576-x.
- Dogdus M, Dindas F, Yenercag M, et al. The role of systemic immune inflammation index for predicting saphenous vein graft disease in patients with coronary artery bypass grafting. Angiology. 2023;74(6):579–586. doi: 10.1177/00033197221129356.
- Ghobadi H, Mohammadshahi J, Javaheri N, et al. Role of leukocytes and systemic inflammation indexes (NLR, PLR, MLP, dNLR, NLPR, AISI, SIR-I, and SII) on admission predicts in-hospital mortality in non-elderly and elderly COVID-19 patients. Front Med. 2022;9:916453. doi: 10.3389/fmed.2022.916453.
- He Z, Zhou K, Tang K, et al. Perioperative hypoalbuminemia is a risk factor for wound complications following posterior lumbar interbody fusion. J Orthop Surg Res. 2020;15(1):538. doi: 10.1186/s13018-020-02051-4.
- Chen L, Liu C, Ye Z, et al. Predicting surgical site infection risk after spinal tuberculosis surgery: development and validation of a nomogram. Surg Infect. 2022;23(6):564–575. doi: 10.1089/sur.2022.042.