
Abstract
Background
Cancer-associated fibroblasts (CAFs) are the most important components of the tumor microenvironment (TME). CAFs are heterogeneous and involved in tumor tumorigenesis and drug resistance, contributing to TME remodeling and predicting clinical outcomes as prognostic factors. However, the effect of CAFs the TME and the prognosis of patients with breast cancer (BC) is not fully understood. This study investigated the correlation between CAFs-activating biomarkers immune cell infiltration and survival in patients with breast cancer.
Methods
RNA sequencing data and survival information for patients with breast cancer were downloaded from The Cancer Genome Atlas (TCGA) using R software. We then analyzed the correlation between CAFs-expressing biomarkers and immune cells using the clusterProfiler package, and evaluated the prognostic role of appealing genes using the Survminer package. Immunohistochemical (IHC) staining was used to determine the expression levels of TNC in 160 breast cancer samples pathologically diagnosed as invasive ductal carcinoma that were not otherwise specified (IDC-NOS).
Results
Data analysis showed that CAFs-expressing genes was higher than in normal tissues (p < 0.05). Pathway enrichment revealed that the overexpression of CAFs-related genes was mainly enriched in the focal adhesion and phosphoinositol-3 kinase-serine/threonine kinase (PI3K-AKT) signaling pathways. Immune infiltration analysis suggested that high expression of CAFs-related genes was significantly positively correlated with the infiltration of naive B cells and resting dendritic cells and inversely correlated with macrophages cell infiltration. In addition, high TNC expression in tumor cells was associated with the most adverse clinicopathological features and reduced metastasis-free survival (MFS) (hazard ratio (HR) 0.574, 95% confidence interval (CI) 0.404-0.815, p = 0.035).
Conclusions
This study found that CAFs may participate in immunosuppression and regulate tumor cell proliferation and invasion. High TNC expression is associated with several adverse clinicopathological features, and high TNC expression in tumor cells has been identified as an independent prognostic factor for IDC-NOS.
KEY MESSAGES
Fibroblasts in breast cancer are activated and usually upregulated CAFs-related genes, including tenascin C (TNC) which participate in immunosuppression through the focal adhesion and PI3K-AKT signaling pathways.
TNC expression in the CAFs and tumor cells, and was associated with most adverse clinicopathological features of breast cancer.
High TNC expression in CAFs or tumor cells resulted in significantly worse MFS, and as an independent prognostic factor.
1. Introduction
Breast cancer is the most common cancer worldwide, with the highest morbidity and mortality rates among women [Citation1]. It is a highly heterogeneous disease that can be classified into different molecular subtypes based on estrogen receptor (ER), progesterone receptor (PR), human epidermal growth factor receptor-2 (HER-2) status, Ki67 expression, and gene expression profiles. Clinicopathological parameters are usually used for risk stratification prior to treatment decisions, including patient age, tumor size, histological grade, ER/PR/HER-2 status, lymphatic invasion, and axillary lymph node involvement. However, therapeutic decisions and clinical prognostic evaluation are still challenging because of the limitations of risk stratification based on only on clinical and pathologic parameters, and more effective prognostic biomarkers need to be developed.
The importance of the tumor microenvironment (TME), including inflammatory responses in the tumor stroma, in cancer progression and survival is being increasingly recognized [Citation2]. Over the past decades, researchers have demonstrated that TME plays an important role in the development and occurrence of breast cancer (BC) [Citation3]. Cancer-associated fibroblasts (CAFs) are key components of the TME and display remarkably heterogeneous and phenotype-plasticity-activated fibroblasts. High expression of several genes, such as platelet-derived growth factor receptor-alpha (PDGFRA), platelet-derived growth factor receptor-beta (PDGFRB), fibroblast activated protein (FAP), integrin beta 1 (ITGB1), fibroblast-specific protein 1 (FSP1, also called S100A4), podoplanin (PDPN), alpha-smooth muscle actin (α-SMA), caveolin 1 (CAV1), and vimentin (VIM), has been found in activated fibroblasts and can be served as biomarkers to better characterize activated CAFs, but not or only lightly expressed in normal fibroblasts [Citation4–6]. Activated CAFs most commonly manifests functionally by accelerating tumor proliferation, angiogenesis, tumor immunity, metastasis, and drug resistance in many types of cancers, especially BC [Citation5,Citation7]. Specifically, CAFs enhance the metastatic potential for BC cells through epithelial-mesenchymal transition (EMT) induced by paracrine transforming growth factor-beta 1 (TGF-β1) [Citation8]. It has been shown that CAFs can regulate ER-α phosphorylation and mitogen-activated protein kinase (MAPK) activity to directly induce tamoxifen resistance in breast cancer cells [Citation9]. In invasive breast cancer, CAFs promote tumor growth and angiogenesis by increasing the secretion of stromal cell-derived factor 1/chemokine ligand 12 (SDF-1/CXCL12) [Citation10]. Overall, activated CAFs can influence TME remodeling and tumor cell invasion by secreting multiple chemokines, cytokines, and growth factors and regulating the extracellular matrix (ECM) composition, leading to tumor progression [Citation11].
With the discovery and clinical application of tumor immunotherapy, cancer patients have benefited from immune checkpoint inhibitors (ICIs), and the crosstalk between CAFs and immune cells has gained prominence. Several studies have shown that CAFs also play an important role in immune regulation [Citation12,Citation13]. Ӧhlund et al. [Citation14] first discovered and identified two completely opposite subsets of CAFs with distinctly different fuctions: myofibroblastic CAFs (myCAFs) and inflammatory CAFs (iCAFs). MyCAFs have high α-SMA expression, but iCAFs secrete more IL-6 which may participate in immune suppression by stimulating the STAT3 signaling pathway. Subsequently, four different CAFs subpopulations were identified in BC based on CD29, FAP, αSMA, PDGFRβ, FSP1, and CAV1 expression levels. Compared with CAF-S4 (CD29Hi FAPNeg FSP1Low-Med αSMAHi CAV1Neg-Low PDGFRβLow-Med), CAF-S1(CD29Med FAPHi FSP1Low-Hi αSMAHi CAV1Low PDGFRβMed-Hi) accumulation T lymphocyte differentiation into CD25 + FOXP3 + through B7H3, CD73, and dipeptidy peptidase 4 (DPP4) contributes to immunosuppression in triple negative breast cancer (TNBC) [Citation5]. These findings indicate that reciprocally tight regulation between CAFs and tumor cells re-shapes the immune microenvironment in BC, and CAFs-expressing genes might be useful biomarkers to characterized immune cell infiltration in the TME and response to ICIs and predict clinical outcomes in BC patients. Therefore, this study aimed to determine the relationship among CAFs-expressing markers, immune cell infiltration, and clinical prognosis.
2. Materials and methods
2.1. Data collection
RNA-seq data and clinical survival information for patients with breast cancer (BRCA) were downloaded from The Cancer Genome Atlas database (TCGA, https://cancergenome.nih.gov/) using the TCGAbiolinks package in R software [Citation15,Citation16]. CAF-related genes including collagen type I alpha 1 (COL1A1), actin alpha 2 (ACTA2), tenascin-c (TNC), Thy-1 membrane glycoprotein (THY1), PDGFRA, PDGFRB, FAP, ITGB1, S100A4, CAV1, DPP4, and PDPN were obtained from previous studies [Citation5,Citation17]. The database UALCAN was used to analyze the correlation between mRNA transcriptional levels of CAF-related genes in BRCA.
2.2. Functional exploration of CAFs-related genes
The functions of CAFs-related genes were analyzed using Gene Ontology (GO) analyses, including biological process (BP), molecular function (MF), and cellular components (CC). Kyoto Encyclopedia of Genes and Genomes (KEGG) analysis was used to identify the significant pathways for gene of enrichment. The “clusterProfiler” package [Citation8] was used to conduct the GO, KEGG analysis.
2.3. Correlation analysis between CAFs-related genes and immune cells
First, three CAF’immune-related genes (PDGFRA, PDGFRB, and TNC) were identified by examining the intersection of CAF and immune cell genes (data from The Immunology Database and Analysis Portal (ImmPort)). Next, the correlation between PDGFRA, PDGFRB, and TNC expression and immune infiltration cells was explored using Pearson’s rank correlation analysis in the R software using the ssGSEA algorithm. The resulting associations were visualized using the chart technique in the “ggplot2” package.
2.4. Patients
Formalin-fixed, paraffin-embedded tumor tissues were collected from 160 patients diagnosed with invasive ductal carcinoma, not otherwise specified (IDC-NOS) after surgery at the First Affiliated Hospital of Jinan University between January 2013 and December 2018. This study was performed in accordance with the guidelines of the 1975 Declaration of Helsinki and was approved by the Medical Ethics Committee of the first Affiliated Hospital of Jinan University (approval number: KY-2021-008).
2.5. Immunohistochemical (IHC) assay
The samples were then sectioned into 3 μm slides. Antigen retrieval was performed in Tris/EDTA buffer using microwave treatment (MWT) for 23 min. Endogenous peroxidase was blocked with 3% hydrogen peroxidase for 25 min and washed with PBS (Servicebio, G0002-2L, 1:2000). Protein blocking was performed using QuickBlock™ Blocking Buffer for Immunol Staining (Beyotime, P0260) for 30 min. The samples were further incubated with specific Tenascin C (Abcam, ab108930, 1:500) antibodies at 4 °C overnight and with a secondary antibody (ZSGB-BIO) at room temperature for 1 h. Protein expression was detected using DAB (Dako) following the manufacturers’ instructions.
IHC results for TNC were evaluated utilizing the intensity score combined with staining intensity and area. The intensity scores ranged from 0 to 9. Positive expression in the entire tumor was observed under a low-magnification microscope. After statistical analysis, the median was taken as the cut-off point: less than the median for low expression and greater than the median for high expression. Two or more senior pathologists interpreted IHC results.
2.6. Statistical analysis
The survival package was used for Kaplan-Meier overall survival analysis, and the log-rank test was used for comparison. Hazard ratio (HR) were calculated using univariate Cox regression analysis. The chi-square test was used to compare the clinical features. The Pearson method was used for correlation analysis. The t-test was performed for differential gene expression in normal and tumor tissues. Statistical analyses were performed using R software (Version 3.5.3, https://www.r-project.org) and SPSS version 19.0 software (SPSS, Inc., Chicago, IL, USA). Unless otherwise specified, statistical significance was set at p < 0.05.
3. Results
3.1. Differentially expressed CAFs-related genes
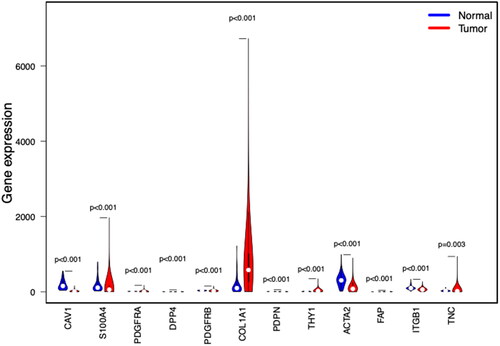
We analyzed the expression of CAFs-related genes in the TCGA-BRCA cohort. PDGFRA, DPP4, PDPN, THY1, FAP, S100A4, DPP4, PDGFRB and TNC were higher in breast cancer than in normal breast tissue ().
Figure 1. Expression of CAF-related genes in breast cancer tissues and normal tissues. Compared with normal breast tissue, THY1, PDPN, FAP, S100A4, DPP4, PDGFRA, PDGFRB, and TNC were higher in breast cancer.
3.2. Functional analysis of CAFs-related genes
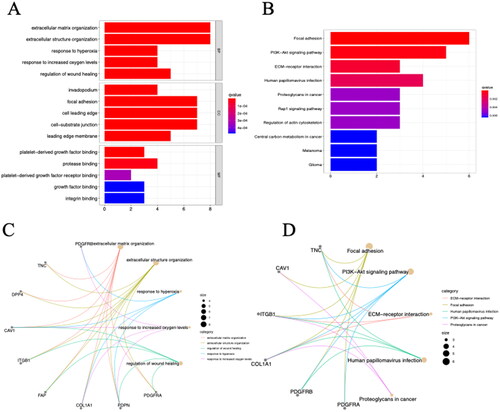
To evaluate the biological functions of these CAFs-related genes, analyses were performed using GO enrichment and KEGG pathways. GO analysis revealed that () changes in BP were mainly enriched in the extracellular matrix organization, extracellular structure organization, and response to hyperoxia; changes in MF were mainly enriched in the invadopodium, focal adhesion, cell leading edge, and cell-substrate junction; and CC was mainly enriched in platelet-derived growth factor (PDGF) binding, platelet-derived growth factor receptor (PDGFR) binding, and protease binding. KEGG pathway analysis revealed that CAFs-related genes were mainly enriched in focal adhesion, phosphoinositide-3-kinase-serine/threonine-specific protein (PI3K-AKT) signaling pathway, human papillomavirus infection, and EMC-receptor interaction ().
Figure 2. The results of GO and KEGG analysis of CAF-related genes. The bar plot (A) and circos plot (C) showed the top five GO terms; the bar plot (B), bubble plot and circos plot (D) showed the top five KEGG pathway terms BP biological process.
3.3. Correlation of PDGFRA, PDGFRB, and TNC with immune cells in BC
CAFs are the most abundant components of the TME. It is well known that various immune cells in TME, such as tumor-infiltrating lymphocytes (TILs), macrophages, natural killer cells, and fibroblasts, play an important role in tumor immunity. We further analyzed the correlation between CAFs activation markers and immune cell infiltration in TCGA-BRCA. First, CAFs’ immune-related genes (PDGFRA, PDGFRB, and TNC) were identified by comparing them with immune-infiltrating cell genes (Supplementary Figure 1). We used ssGSEA to reveal the infiltration of the PDGFRA, PDGFRB, TNC, and immune cell subpopulations. The correlation results for PDGFRA, PDGFRB, and TNC are shown in .
Figure 3. The relationship between PDGFRA and immune infiltrates. The correlation between PDGFRA expression and B cell memory (A), B cells naive (B), DCs resting (C), macrophages M0 (D), macrophages M1(E), macrophages M2 (F), mast cells activated (G), mast cells resting (H), monocytes (I), plasma cells (J), T cells CD4 memory resting (K) infiltration. R < 0, negative correlation, R = 0, no correlation, R > 0, positive correlation.
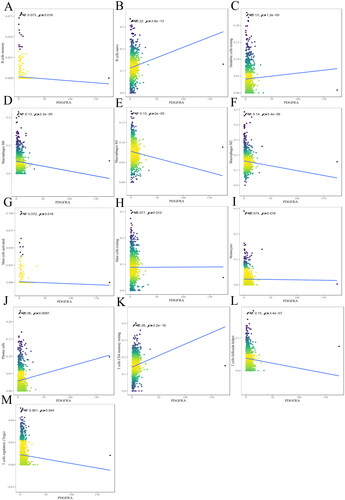
Figure 4. The relationship between PDGFRB and immune infiltrates. The correlation between PDGFRB expression and B cell memory (A), B cells naive (B), DCs activated (C), DCs resting (D), eosinophils (E), macrophages M1 (F), mast cells activated (G), mast cells resting (H), T cells CD4 memory activated (I), T cells CD4 memory resting (J), T cells CD8 (K), T cells follicular helper (L) infiltration. R < 0, negative correlation, R = 0, no correlation, R > 0, positive correlation.
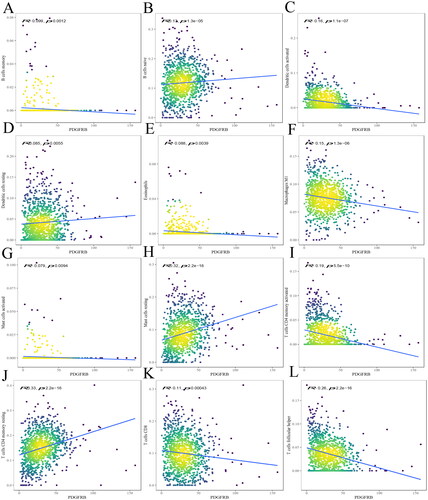
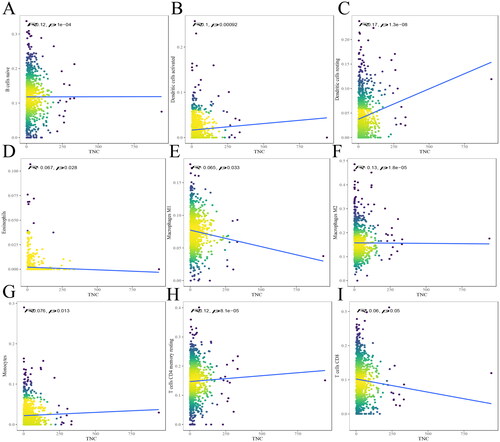
Figure 5. The relationship between TNC and immune infiltrates. The correlation between TNC expression and B cells naive (A), DCs activated (B), DCs resting (C), eosinophils (D), macrophages M1 (E), macrophages M2 (F), monocytes (G), T cells CD4 memory resting (H), T cells CD8 (I) infiltration. R < 0, negative correlation, R = 0, no correlation, R > 0, positive correlation.
The results indicated that PDGFRA was negatively correlated with B cell memory (R= −0.073, p = 0.016) (), macrophages M0 (R= −0.13, p = 2.2e-05) (), macrophages M1 (R= −0.13, P = 2e-05) (), macrophages M2 (R= −0.14, P = 5.4e-06) (), mast cells activated (R= −0.072, p = 0.018) (), T cells follicular helper (R= −0.15, P = 3.4e-07) (), T cells regulatory (R= −0.061, p = 0.044) (), and positively correlated with B cells naive (R = 0.22, P = 3.8e-13) (), dendritic cells (DCs) resting (R = 0.13, p = 1.2e-05) (), mast cells resting (R = 0.077, p = 0.012) (), monocytes (R = 0.074, p = 0.016) (), plasma cells (R = 0.08, p = 0.0087) (), and T cells CD4 memory resting (R = 0.28, P < 2.2e-16) ().
The results indicated that PDGFRB was negatively correlated with B cell memory (R= −0.099, p = 0.0012) (), DCs activated (R= −0.16, p = 1.1e-07) (), eosinophils (R= −0.088, p = 0.0039) (), macrophages M1 (R= −0.15, p = 1.3e-06) (), mast cells activated (R= −0.079, p = 0.0094) (), T cells CD4 memory activated (R= −0.19, P = 5.5e-10) (), T cells CD8 (R= −0.11, p = 0.00043) (), T cells follicular helper (R= −0.26, p = 2.2e-16) (), and positively correlated with B cells naive (R = 0.13, p = 1.3e-05) (), DCs resting (R = 0.085, p = 0.0055) (), mast cells resting (R = 0.32, P < 2.2e-16) (), and T cells CD4 memory resting (R = 0.33, P < 2.2e-16) ().
The results indicated that TNC was positively correlated with B cells naive (R = 0.12, P = 1e-04) (), DCs activated (R = 0.1, p = 0.00092) (), DCs resting (R = 0.17, p = 1.3e-08) (), monocytes (R = 0.076, p = 0.013) (), T cells CD4 memory resting (R = 0.12, P < 8.1e-05) (), and negatively correlated with eosinophils (R= −0.067, p = 0.028) (), macrophages M1 (R= −0.065, p = 0.033) (), macrophages M2 (R= −0.13, p = 1.8e-05) (), and T cells CD8 (R= −0.06, p = 0.05) ().
3.4. Survival results of PDGFRA, PDGFRB, TNC in the TCGA-BRCA
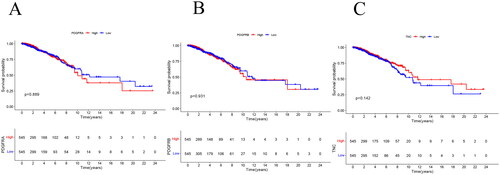
These three CAFs genes are associated with immune infiltration, and we further analyzed their impact on the prognosis of patients with breast cancer. Kaplan–Meier analysis showed that the expression levels of PDGFRA, PDGFRB, and TNC expression levels did not significant affect in the overall survival (OS) of patients with breast cancer ().
Figure 6. Kaplan–Meier Plots comparing the OS between the high and low groups of PDGFRA (a), PDGFRB (B), TNC (C) in the TCGA-BRCA cohort. p Values from log-rank tests.
3.5. Correlation of TNC expression with clinical-pathological characteristics
Previous studies have shown that PDGFRA and PDGFRB expression is correlated with certain aggressive parameters of invasive breast carcinomas, positive axillary lymph node status [Citation18], tumor size [Citation19], and shorter survival [Citation20]. Therefore, we further confirmed the association between TNC and the clinicopathological features of patients with IDC-NOS and performed an IHC analysis of TNC expression in paraffin sections. The baseline clinicopathological characteristics of the patients (n = 160) are summarized in Supplementary Table 1. Most patients (56.9%) were ≤50 years old and had small tumor of size 50 mm (52.5%), a grade III tumor (54.5%) and negative lymph nodes (56.3%). More than half had ER-negative (50.6%) tumors, PR-negative tumors (51.9%), and HER-2-negative tumors (71.9%). Overall, 23.1% of the patients developed distant metastasis, and 13.2% died after receiving the standard NCCN guidelines.
The relationship between TNC expression and clinicopathological characteristics is presented in and Supplementary Table 2. Immunohistochemistry revealed that TNC was expressed not only in CAFs but also in tumor cells (). First, we examined the TNC in CAFs. High TNC expression was significantly associated with ER-negative status (p = 0.004), PR-negative status (p = 0.002), TNBC subtype (p < 0.001), and Ki67 high expression (p = 0.002). Other variables such as age, HER-2 status, histological grade, lymph node involvement, T stage, and clinical stage were significantly associated with the expression level of TNC. Next, we analyzed the expression in tumor cells. High TNC expression in tumor cells was significantly associated with HER-2 positive status (p = 0.001), HER-2+ subtype (p < 0.001), and involved lymph nodes (p = 0.026).
Figure 7. Representative images of immunohistochemistry staining IDC-NOS patients tissues showing the expression of TNC. (A) TNC low expression in the CAF; (B) TNC high expression in the CAF; (C) TNC low expression in the tumor cells; (D) TNC high expression in the tumor cells. Magnification ×100, and ×400; the solid black line indicates the scale bar, 100 μm.
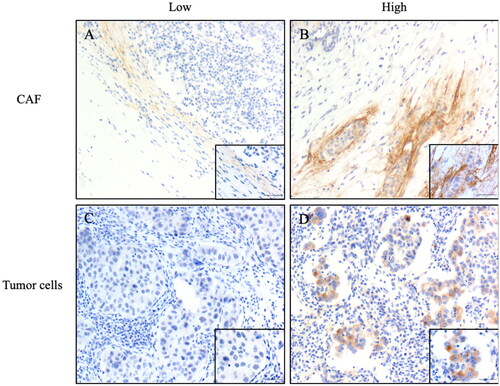
Table 1. Correlation between TNC expression and clinicopathological characteristics of IDC-NOS patients(n = 160).
3.6. Correlation of TNC levels with metastasis-free survival (MFS) and OS of IDC-NOS patients
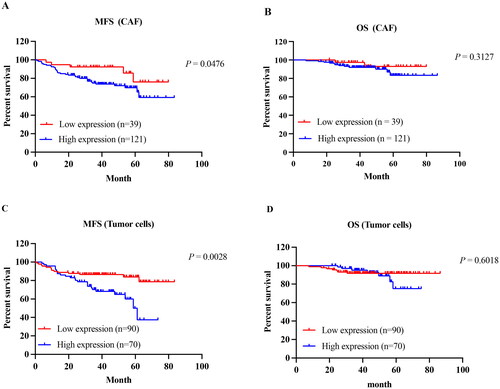
We systematically analyzed the influence of TNC expressions on MFS and OS. According to the Kaplan–Meier curves, CAFs with high TNC expression had a significantly worse MFS than did those with low expression (p = 0.0476, ). Interestingly, we further evaluated TNC expression in tumor cells and found was that patients with high expression had significantly worse MFS compared with low expression (p = 0.0028, ). However, TNC expression in CAF and tumor cells had no significant effect on the OS of patients with breast cancer ().
Figure 8. Kaplan–Meier curves of the MFS in IDC-NOS by the TNC expression. MFS survival curve of TNC expression in CAF (A) and tumor cells (C); OS survival curve of TNC expression in CAF (B) and tumor cells (D).MFS: metastasis-free survival; OS: overall survival.
To investigate the prognostic significance of TNC expression, we conducted univariate and multivariate analysis to explore the relationship among TNC protein expression, clinicopathological characteristics, and MFS (). Univariate survival analysis revealed that TNC protein expression in tumor cells together with ER/PR status, HER-2 over-expression statuses, blood vessel invasion, lymph node metastasis, T stage, and clinical stage were significantly associated with the MFS in patients with IDC-NOS. By adopting the above seven variables as covariates for multivariate Cox regression analysis, the TNC expression in tumor cells was associated with reduced DFS (HR 0.574, 95%, confidence interval (CI) 0.404–0.815, p = 0.035), independent of ER status (HR 0.48, 95% CI 0.237–0.972, p = 0.042), blood vessel invasion (HR 2.266, 95% CI 1.176–4.364, p = 0.014), and T stage (HR 2.888, 95% CI 2.005–4.158, p < 0.001).
Table 2. Relationship between clinicopathological characteristics and disease-free survival in patients with ICD-NOS patients.
4. Discussion
CAFs are a group of activated fibroblasts with significant heterogeneity [Citation17]. Most CAFs are thought to result from the activation of local tissue-resident fibroblasts [Citation21]. While normal fibroblasts suppress tumor formation, CAFs enhance malignant phenotypes, notably cancer cell proliferation, invasion, neo-angiogenesis, inflammation, and ECM remodeling [Citation22,Citation23]. Notably, remodeling of the ECM and cancer cell phenotype by CAFs plays an increasingly prominent role in tumor progression and therapeutic response.
In this study, we found that high PDGFRA, PDGFRB, and TNC expression recruited the naive B cells, resting dendritic cells, and resting T cell CD4 memory. Therefore, we speculate that activated CAFs (PDGFRAHi PDGFRBHi TNCHi) may inhibit the ability of DCs to present tumor antigens, reduce B cell activation, and induce functional exhaustion of CD4+ memory T cells [Citation24]. This notion was also demonstrated in a transplantable model of lung carcinoma in which CAFs-secreted tryptophan 2,3-dioxygenase (TDO2) was shown to inhibit DC differentiation and function, whereas the inhibition of TDO2 improved DCs function and T cell responses, thereby reducing cancer metastasis [Citation25]. Remarkably, IL-6 secreted by CAFs can upregulate and activate STAT3 and produce indoleamine 2,3-dioxygenase (IDO) in DCs, leading to immunosuppressive effects on T-cell responses [Citation26]. Costa et al. [Citation5] showed that the myofibroblasts subset called CAFs-S1 plays a key role in immunosuppression by attracting T lymphocytes, increasing the survival of CD4 + CD25+ T lymphocytes, and promoting their differentiation into CD25 + FOXP3+ cells. A recent study showed that CD25 + FOXP3+ T cells promote immunosuppression by inducing ROS-generating monocytic myeloid-derived suppressor cells (MDSCs) in lung squamous cell carcinoma (LSCC) [Citation27]. In addition, CAFs not only lead to immunosuppression but can also lead to a decrease in tumor-infiltrating lymphocytes by remodeling the ECM. High levels of fibrosis have been suggested to interact with TILs in TNBC [Citation28]. Dense networks of CAFs-secreted collagen fibers in tumor nests have been shown to constitute a physical barrier that prevents T cells from reaching the tumor bed [29]. Recent studies have shown that TNC promotes breast cancer progression through TLR4 binding to CXCL12 by preventing CD8+ TILs infiltration [Citation30], indicating that CAFs shape the tumor immunosuppressive microenvironment that would hampers the response to immunotherapy.
Considering that CAFs may exert suppressive effects on immune cells, we further characterized the pathways involved in CAFs-related genes. Although consistent with previous findings, KEGG analysis showed that BP was mainly enriched in an extracellular matrix and structure organization, which may remodel the tumor stroma [Citation31]. MF was mainly enriched in invadopodium, whereas focal adhesion, cell leading edge, and CC were enriched in platelet-derived growth factor binding. We next found that this gene was enriched in the focal adhesion and PI3K-AKT signaling pathways using KEGG. Focal adhesion kinase (FAK) is overexpressed in many human cancer cell lines and promotes tumor cell growth by controlling cell adhesion, migration, proliferation, and survival [Citation32]. The adhesion of cancer cells to the ECM can promote cell survival and reduce apoptosis by activating ERK and PI3K signaling [Citation33]. These data suggest that stromal fibroblast activation can be reduced by targeting FAK in cancer cells [Citation34]. Furthermore, Li et al. [Citation35] found that CAF-derived CXCL5 is involved in the expression of PD-L1 on the tumor cell surface in a PI3K/AKT-dependent manner. It has also been found in glioma that TNC can activate PI3K-AKT signaling to make tumor cells resist apoptosis [Citation36].
Significantly, we conducted an IHC analysis of 160 breast cancer samples and found that the expression of TNC in CAFs was the highest in TNBC subtypes and was correlated with ER/PR negativity. Previous studies have shown that CAFs regulate ER transcriptional activity or ER-α hyperphosphorylation through autocrine or paracrine cytokines-induced tamoxifen resistance [Citation9]. Thus, the tumor stroma can collaborate with or comply with autocrine or paracrine-mediated growth factor or ER crosstalk pathways in breast cancer cells. TNC derived from myofibroblasts may contribute to the remodeling of the stroma and increase in the stiffness via the integrin αvβ1/TGF-β signaling axis of breast cancer [Citation37]. TNBC is often accompanied by significant interstitial fibrosis. Previous studies have revealed that iCAFs inhibit the function of cytotoxic T cells resulting in an immunosuppressive environment in TNBC [Citation28]. Our study showed that high TNC expression in CAFs or in tumor cells resulted in significantly worse MFS. TNC expression in tumor cells is associated with adverse clinicopathological features, such as lymph node metastasis and is an independent prognostic factor in breast cancer. First, TNC from the ECM at the invasive front support local invasion and migration away from the bulk tumor mass. Second, cancer cell-derived TNC enhanced stemness of breast cancer cells by enhancing the expression of leucine-rich repeat G protein-coupled receptor 5 (LGR5) and Musashi homolog 1 (MSI1), further promoting the metastatic niche of breast cancer cells to colonize the lung [Citation38]. Furthermore, the increased expression of stromal cell proteins is often associated with metastasis and poor prognosis in patients with cancer [Citation39]. Co-evolution between CAFs and tumor cells has long been observed. CAFs often remodel the ECM and tumor EMT phenotypes, and the cytokines tumor cells produce further induce CAFs activation.
However, several questions remain unanswered. First, our analysis only provided associations based on data mining: this speculation should be further confirmed. Further experimental studies and the application of additional innovative techniques, such as single-cell RNA-seq or mass cytometry, are required to investigate how fibrotic processes shape the TME.
5. Conclusion
In conclusion, our study identified TNC in tumor cells as an independent prognostic indicator, revealing the highest TNC expression in TNBC. CAFs may be associated with poor prognosis in patients with breast cancer through the activation of focal adhesion and PI3K-AKT signaling pathways and exert immunosuppressive functions in the TME.
Author contributions
TH and CL contributed to concept and design, TH, CL and YZ contributed to drafting of the paper, CL, YZ and BYL performed bioinformatics analysis, ZJZ and DZ collected patient data and analyzed data, YZL and LW were in charge of critical revision of this manuscript. All authors read the final manuscript and agreed to be accountable for all aspects of the work.
Supplemental Material
Download ()Disclosure statement
No potential conflict of interest was reported by the author(s).
Data availability statement
Publicly available datasets were analyzed in this study. Data can be found here: https://portal.gdc.cancer.gov/. All of the authors are responsible for the data.
Additional information
Funding
References
- Sung H, Ferlay J, Siegel RL, et al. Global cancer statistics 2020: GLOBOCAN estimates of incidence and mortality worldwide for 36 cancers in 185 countries. CA Cancer J Clin. 2021;71(3):1–14. doi: 10.3322/caac.21660.
- Hanley CJ, Thomas GJ. Targeting cancer associated fibroblasts to enhance immunotherapy: emerging strategies and future perspectives. Oncotarget. 2021;12(14):1427–1433. doi: 10.18632/oncotarget.27936.
- Quail DF, Joyce JA. Microenvironmental regulation of tumor progression and metastasis. Nat Med. 2013;19(11):1423–1437. doi: 10.1038/nm.3394.
- Mhaidly R, Mechta-Grigoriou F. Fibroblast heterogeneity in tumor micro-environment: role in immunosuppression and new therapies. Semin Immunol. 2020;48:101417. doi: 10.1016/j.smim.2020.101417.
- Costa A, Kieffer Y, Scholer-Dahirel A, et al. Fibroblast heterogeneity and immunosuppressive environment in human breast cancer. Cancer Cell. 2018;33(3):463–479 e10. doi: 10.1016/j.ccell.2018.01.011.
- Musa M. Single-cell analysis on stromal fibroblasts in the microenvironment of solid tumours. Adv Med Sci. 2020;65(1):163–169. doi: 10.1016/j.advms.2019.12.001.
- Lappano R, Rigiracciolo DC, Belfiore A, et al. Cancer associated fibroblasts: role in breast cancer and potential as therapeutic targets. Expert Opin Ther Targets. 2020;24(6):559–572. doi: 10.1080/14728222.2020.1751819.
- Yu G, Wang L-G, Han Y, et al. clusterProfiler: an R package for comparing biological themes among gene clusters. OMICS. 2012;16(5):284–287. doi: 10.1089/omi.2011.0118.
- Shekhar MPV, Santner S, Carolin KA, et al. Direct involvement of breast tumor fibroblasts in the modulation of tamoxifen sensitivity. Am J Pathol. 2007;170(5):1546–1560. doi: 10.2353/ajpath.2007.061004.
- Orimo A, Gupta PB, Sgroi DC, et al. Stromal fibroblasts present in invasive human breast carcinomas promote tumor growth and angiogenesis through elevated SDF-1/CXCL12 secretion. Cell. 2005;121(3):335–348. doi: 10.1016/j.cell.2005.02.034.
- Park D, Sahai E, Rullan A. SnapShot: cancer-associated fibroblasts. Cell. 2020;181(2):486–486.e1. doi: 10.1016/j.cell.2020.03.013.
- De Jaeghere EA, Denys HG, De Wever O. Fibroblasts fuel immune escape in the tumor microenvironment. Trends Cancer. 2019;5(11):704–723. doi: 10.1016/j.trecan.2019.09.009.
- Kieffer Y, Hocine HR, Gentric G, et al. Single-cell analysis reveals fibroblast clusters linked to immunotherapy resistance in cancer. Cancer Discov. 2020;10(9):1330–1351. doi: 10.1158/2159-8290.CD-19-1384.
- Öhlund D, Handly-Santana A, Biffi G, et al. Distinct populations of inflammatory fibroblasts and myofibroblasts in pancreatic cancer. J Exp Med. 2017;214(3):579–596. doi: 10.1084/jem.20162024.
- Mounir M, Lucchetta M, Silva TC, et al. New functionalities in the TCGAbiolinks package for the study and integration of cancer data from GDC and GTEx. PLOS Comput Biol. 2019;15(3):e1006701. doi: 10.1371/journal.pcbi.1006701.
- Silva TC, Colaprico A, Olsen C, et al. TCGA workflow: analyze cancer genomics and epigenomics data using bioconductor packages. F1000Res. 2016;5:1542. doi: 10.12688/f1000research.8923.1.
- Zheng S, Zou Y, Tang Y, et al. Landscape of cancer-associated fibroblasts identifies the secreted biglycan as a protumor and immunosuppressive factor in triple-negative breast cancer. Oncoimmunology. 2022;11(1):e2020984-2. doi: 10.1080/2162402X.2021.2020984.
- Carvalho I, Milanezi F, Martins A, et al. Overexpression of platelet-derived growth factor receptor alpha in breast cancer is associated with tumour progression. Breast Cancer Res. 2005;7(5):R788–95. doi: 10.1186/bcr1304.
- Paulsson J, Rydén L, Strell C, et al. High expression of stromal PDGFRbeta is associated with reduced benefit of tamoxifen in breast cancer. J Pathol Clin Res. 2017;3(1):38–43. doi: 10.1002/cjp2.56.
- Frings O, Augsten M, Tobin NP, et al. Prognostic significance in breast cancer of a gene signature capturing stromal PDGF signaling. Am J Pathol. 2013;182(6):2037–2047. doi: 10.1016/j.ajpath.2013.02.018.
- Sahai E, Astsaturov I, Cukierman E, et al. A framework for advancing our understanding of cancer-associated fibroblasts. Nat Rev Cancer. 2020;20(3):174–186. doi: 10.1038/s41568-019-0238-1.
- Gascard P, Tlsty TD. Carcinoma-associated fibroblasts: orchestrating the composition of malignancy. Genes Dev. 2016;30(9):1002–1019. doi: 10.1101/gad.279737.116.
- Gentric G, Mieulet V, Mechta-Grigoriou F. Heterogeneity in cancer metabolism: new concepts in an old field. Antioxid Redox Signal. 2017;26(9):462–485. doi: 10.1089/ars.2016.6750.
- Lakins MA, Ghorani E, Munir H, et al. Cancer-associated fibroblasts induce antigen-specific deletion of CD8 + T cells to protect tumour cells. Nat Commun. 2018;9(1):948. doi: 10.1038/s41467-018-03347-0.
- Hsu Y-L, Hung J-Y, Chiang S-Y, et al. Lung cancer-derived galectin-1 contributes to cancer associated fibroblast-mediated cancer progression and immune suppression through TDO2/kynurenine axis. Oncotarget. 2016;7(19):27584–27598. doi: 10.18632/oncotarget.8488.
- Cheng J-T, Deng Y-N, Yi H-M, et al. Hepatic carcinoma-associated fibroblasts induce IDO-producing regulatory dendritic cells through IL-6-mediated STAT3 activation. Oncogenesis. 2016;5(2):e198–e198. doi: 10.1038/oncsis.2016.7.
- Xiang H, Ramil CP, Hai J, et al. Cancer-Associated fibroblasts promote immunosuppression by inducing ROS-Generating monocytic MDSCs in lung squamous cell carcinoma. Cancer Immunol Res. 2020;8(4):436–450. doi: 10.1158/2326-6066.CIR-19-0507.
- Ding J-H, Xiao Y, Zhao S, et al. Integrated analysis reveals the molecular features of fibrosis in triple-negative breast cancer. Mol Ther Oncolytics. 2022;24:624–635. doi: 10.1016/j.omto.2022.02.003.
- Salmon H, Franciszkiewicz K, Damotte D, et al. Matrix architecture defines the preferential localization and migration of T cells into the stroma of human lung tumors. J Clin Invest. 2012;122(3):899–910. doi: 10.1172/JCI45817.
- Murdamoothoo D, Sun Z, Yilmaz A, et al. Tenascin-C immobilizes infiltrating T lymphocytes through CXCL12 promoting breast cancer progression. EMBO Mol Med. 2021;13(6):e13270. doi: 10.15252/emmm.202013270.
- Winkler J, Abisoye-Ogunniyan A, Metcalf KJ, et al. Concepts of extracellular matrix remodelling in tumour progression and metastasis. Nat Commun. 2020;11(1):5120. doi: 10.1038/s41467-020-18794-x.
- Pang X-J, Liu X-J, Liu Y, et al. Drug discovery targeting focal adhesion kinase (FAK) as a promising cancer therapy. Molecules. 2021;26(14):4250. doi: 10.3390/molecules26144250.
- Pickup MW, Mouw JK, Weaver VM. The extracellular matrix modulates the hallmarks of cancer. EMBO Rep. 2014;15(12):1243–1253. doi: 10.15252/embr.201439246.
- Jiang H, Hegde S, Knolhoff BL, et al. Targeting focal adhesion kinase renders pancreatic cancers responsive to checkpoint immunotherapy. Nat Med. 2016;22(8):851–860. doi: 10.1038/nm.4123.
- Li Z, Zhou J, Zhang J, et al. Cancer-associated fibroblasts promote PD-L1 expression in mice cancer cells via secreting CXCL5. Int J Cancer. 2019;145(7):1946–1957. doi: 10.1002/ijc.32278.
- Zhang Q, Xu B, Hu F, et al. Tenascin C promotes glioma cell malignant behavior and inhibits chemosensitivity to paclitaxel via activation of the PI3K/AKT signaling pathway. J Mol Neurosci. 2021;71(8):1636–1647. doi: 10.1007/s12031-021-01832-8.
- Katoh D, Kozuka Y, Noro A, et al. Tenascin-C induces phenotypic changes in fibroblasts to myofibroblasts with high contractility through the integrin alphavbeta1/transforming growth factor beta/SMAD signaling axis in human breast cancer. Am J Pathol. 2020;190(10):2123–2135. doi: 10.1016/j.ajpath.2020.06.008.
- Oskarsson T, Acharyya S, Zhang XH-F, et al. Breast cancer cells produce tenascin C as a metastatic niche component to colonize the lungs. Nat Med. 2011;17(7):867–874. doi: 10.1038/nm.2379.
- Chong HC, Tan CK, Huang R-L, et al. Matricellular proteins: a sticky affair with cancers. J Oncol. 2012;2012:351089–351017. doi: 10.1155/2012/351089.