
Abstract
Background
T-cell large granular lymphocyte leukaemia (T-LGLL) generally has a favourable prognosis, but a small proportion of patients are facing a relatively short survival time. This study aimed to identify clinical factors associated with survival in patients with T-LGLL and develop a predictive model for guiding therapeutic decision-making.
Materials and Methods
We conducted a retrospective study on 120 patients with T-LGLL. Lasso regression was performed for feature selection followed by univariate and multivariate Cox regression analysis. A decision tree algorithm was employed to construct a model for predicting overall survival (OS) in T-LGLL.
Results
The median age of diagnosis for the entire cohort was 59 years, and 76.7% of patients reported disease-related symptoms. After a median follow-up of 75 months, the median OS was not reached. The 5-year OS rate was 82.2% and the 10-year OS rate was 63.8%. Multivariate analysis revealed that an Eastern Cooperative Oncology Group performance status over two and a platelet count below 100 × 109/L were independently associated with worse OS, leading to the development of a simplified decision tree model. The model’s performance was adequate when internally validated. The median OS of the high- and intermediate-risk- risk groups was 43 and 100 months respectively, whereas the median OS of the low-risk group was not reached. Furthermore, we found that immunosuppressive agent-based conventional treatment was unsatisfactory for our high-risk patients.
Conclusions
Our model is an easily applicable clinical scoring system for predicting OS in patients with T-LGLL. However, external validation is essential before implementing it widely.
Introduction
Large granular lymphocyte leukaemia (LGLL) is a rare, chronic lymphoproliferative disease, with an annual incidence of 0.2 cases per 1,000,000 individuals [Citation1]. It can arise from either cytotoxic T cells (CD3+) or natural killer cells (CD3-). On the basis of its precise cellular origin and clinical behaviour, LGLL is further divided into three subtypes according to the World Health Organisation classification: T-cell large granular lymphocyte leukaemia (T-LGLL), chronic natural killer lymphoproliferative disorders, and aggressive natural killer cell leukaemia [Citation2]. They account for 85%, 5%, and 10% of LGLL cases, respectively. It is generally considered that clonal large granular lymphocyte (LGL) expansion arises from sustained antigenic stimulation, which promotes dysregulation of apoptosis through the activation of survival signalling pathways [Citation3]. The Janus kinase-signal transducer and activator of transcription (JAK-STAT) axis is the most relevant pathway, whose constitutive activation is partly explained by somatic mutations in STAT3 and STAT5b [Citation4,Citation5]. T-LGLL, the most frequent subtype of the LGL expansion, is often a clinically indolent neoplasm with a median overall survival (OS) greater than ten years and a low risk of transformation into an aggressive malignancy [Citation6]. It is characterized by persistent and clonal proliferation of cytotoxic T cells involving peripheral blood, bone marrow, liver, or spleen. Some patients are asymptomatic at diagnosis and others present with symptoms secondary to neutropenia, anaemia, thrombocytopenia, or autoimmune disorders [Citation7,Citation8]. The conventional treatment of T-LGLL is immunosuppressive therapy, including methotrexate (MTX), cyclosporine (CsA), and cyclophosphamide (CTX). The optimal agent for its initial therapy is yet to be determined [Citation4].
However, previous case reports have noted that a subset of T-LGLL showed a poor prognosis because of a high degree of aggressiveness [Citation9–11]. The majority of patients described in these reports presented with younger age, symptoms of acute illness, hepatosplenomegaly, lymphadenopathy, lymphocytosis, and variable degrees of anaemia or thrombocytopenia. These patients usually presented with a relatively shorter survival time ranging from several months to two years. Their prognosis remained poor with conventional therapy. Treatment with intensive chemotherapy or novel agents targeting the JAK-STAT pathway may render promising responses and outcomes [Citation12,Citation13]. Hence, it is imperative to identify such patients and provide them with more aggressive therapy at an earlier stage. The aim of this study is to identify potential prognostic factors for T-LGLL patients and to construct a prognostic model for better risk stratification and more precise treatment.
Materials and methods
Study population
We conducted a retrospective study at Jiangsu Province Hospital and Nanjing Second Hospital to collect data on patients diagnosed with T-LGLL from August 2009 to March 2023. Data included baseline patients’ characteristics, first-line treatment details, survival time, and so on. Eligible patients met the following criteria: (1) LGL peripheral expansion (count > 0.5 × 10⁹/L and duration > six months) or LGL involvement in bone marrow; (2) classical phenotype (CD3 + CD4-CD8 + CD57 + TCRαβ+) or atypical phenotypes (CD4 + CD8-TCRαβ+, CD4 + CD8 +TCRαβ+, or CD4-CD8-TCRγδ+); (3) rearrangement of T-cell receptor γ gene or clonal expression of T-cell receptor Vβ chain. We considered commonly misdiagnosed conditions such as bone marrow failure syndromes, reactive expansions in LGLs, and other natural killers or T cell lymphoma/leukaemia, and excluded any ambiguous cases.
This study was conducted in accordance with the Declaration of Helsinki and approved by the ethics committees of Jiangsu Province Hospital and Nanjing Second Hospital. Given the minimal risk to participants and the anonymous nature of their involvement, a waiver of documentation of consent was granted by the aforementioned ethics committees, allowing oral consent from participants.
Evaluation metrics
The final follow-up was conducted in March 2023. Our primary objective was to assess OS, which was calculated from the date of diagnosis until death from any cause or the last follow-up. Response to first-line treatment was assessed by clinical evaluation and peripheral blood counts four months after the completion of treatment. Haematologic complete remission (CR) was defined as the normalization of all peripheral blood count values, in addition to the normal count of circulating LGL. Haematologic partial remission was defined as an improvement in peripheral blood counts (a greater than 50% increase in absolute neutrophil count (ANC), a haemoglobin level of more than 100 g/L lasting at least four months, or a greater than 50% reduction in monthly blood transfusion lasting at least four months) [Citation14]. The overall response rate (ORR) was defined as the rate of patients who achieved CR and partial remission. A complete remission rate (CRR) was the rate of patients who achieved CR.
Statistical analysis
We used the R software (v4.2.1) to conduct our analyses. Patient characteristics were summarized as the median with inter-quartile range (IQR) or percentage. The Kaplan-Meier method was utilized to conduct survival analysis, and the resultant P-values were adjusted for multiple hypothesis testing using the Bonferroni method. To overcome over-fitting, we performed LASSO with ten-fold cross-validation, selecting features with non-zero coefficients via LASSO-logistic regression. We employed both univariate and multivariate Cox proportional hazard regression models to identify factors independently associated with OS. A decision tree algorithm was employed to construct a prognostic model for survival prediction based on multivariate analysis results. Time-dependent areas under the receiver-operating characteristic curves (AUC) and calibration curves were generated to effectively demonstrate the performance of the model. Spearman correlation coefficient was used to analyze correlations between parameters. Additionally, we employed the Sankey plot to visually represent our risk stratification flows, and the forest plot to demonstrate response rates and their corresponding 95% confidence interval (CI). Comparisons between categorical variables were performed by the Chi-sq test, with Yates’s correction if necessary, or by Fisher’s exact test. Continuous variables were compared using a Student’s t-test or Wilcoxon rank sum test, as determined by the distribution of the variable being analyzed. All tests were two-sided and statistical significance was defined as p < 0.05.
Results
Baseline characteristics
A total of 120 patients met the inclusion criteria for analysis. Patients’ baseline characteristics are shown in . Of these, 51.7% were males, resulting in a male-to-female sex ratio of 1.07. The median age of diagnosis was 59 years. Notably, 23.3% of patients were discovered incidentally, with no associated symptoms. However, the majority of patients (76.7%) experienced LGLL-associated symptoms including fatigue (57.5%), autoimmune phenomenon (40%), B symptoms (20%), and recurrent infection (18.3%). Splenomegaly was observed in 20% of the cases, whereas lymphadenopathy and hepatomegaly were reported in 15% and 3.3%, respectively. Only 10.8% of patients had an Eastern Cooperative Oncology Group performance status (ECOG PS) over two. The median circulating LGL count was 2.91 × 10⁹/L, with 19.2% of cases presenting counts < 1 × 10⁹/L. Absolute lymphocyte count (ALC) and ANC counts had a median of 3.6 × 10⁹/L and 1.4 × 10⁹/L, respectively, with 30% of patients experiencing ANC counts of less than 1.0 × 10⁹/L, and 11.6% less than 0.5 × 10⁹/L. Anaemia (haemoglobin < 110 g/L) and thrombocytopenia (platelets < 100 × 109/L) occurred in 70% and 18.3% of cases, respectively. Among 80 tested patients, 17.5% were found to carry STAT3 mutations. In addition, pure red-cell anaemia (PRCA) and rheumatoid arthritis were seen in 25% and 5% of patients respectively. More than one-quarter of the patients (26.7%) had an age-adjusted Charlson Comorbidity Index (aCCI) score of more than two.
Table 1. Patients’ baseline characteristics of the included patients
Overall survival
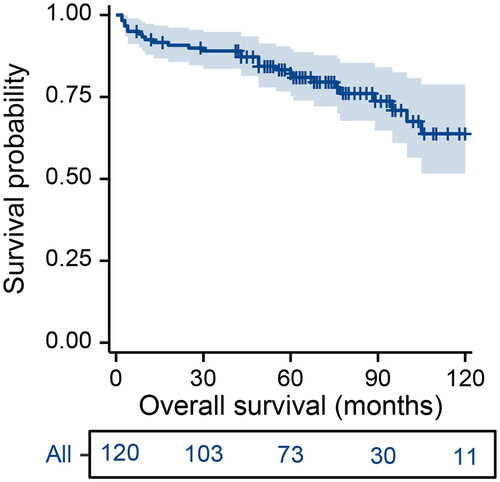
After a median follow-up of 75 months (95% CI, 67–86 months), the median OS was not reached (). The 2-year OS rate for the entire cohort was 90.8% (95% CI, 17.8 − 44.4%), 5-year OS rate was 82.2% (95% CI, 75.3 − 89.6%), and 10-year OS rate was 63.8% (95% CI, 51.6 − 78.8%).
Figure 1. Overall survival curve for the entire study population.
Model construction and validation
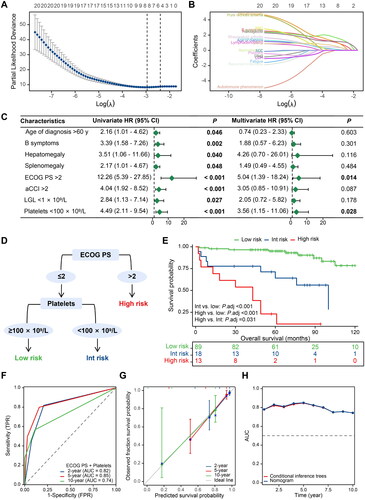
Through the LASSO algorithm, eight features with non-zero coefficients were included to perform univariate and multivariate Cox regression analyses (). The results of the univariate analysis revealed a correlation between poorer OS and age above 60 years (p = 0.046), B symptoms (p = 0.022), hepatomegaly (p = 0.040), splenomegaly (p = 0.048), ECOG PS > 2 (p < 0.001), aCCI > 2 (p < 0.001), LGL < 1 × 10⁹/L (p = 0.027), and platelets < 100 × 109/L (p < 0.001). The multivariate analysis identified only poor performance status (p = 0.014) and thrombocytopenia (p = 0.028) remained independent prognostic factors. Based on this, ECOG PS and platelet count were used to develop a decision tree (). The final risk score comprised 3 risk categories: high (ECOG PS > 2), intermediate (ECOG PS ≤ 2 with platelets < 100 × 109/L), and low (ECOG PS ≤ 2 without platelets < 100 × 109/L). The OS curves for each risk category revealed significant differences between the groups (). Median OS of the high- and intermediate- risk groups was 43 and 100 months respectively, while the median OS of the low-risk group was not reached. The AUC for predicting 2- and 5-year OS were 0.82 and 0.85, respectively (). For the 10-year prediction, the discriminatory performance of the model decreases slightly, with an AUC of 0.74. The calibration curves for predicting 2-, 5-, and 10-year OS were well matched to the standard line (). As shown in , the time-dependent AUCs of the decision tree model are comparable to those of the nomogram model.
Figure 2. Construction and validation process of a decision tree model for predicting the overall survival of patients with T-cell large granular lymphocyte leukaemia. (A–B) Feature selection steps carried out using the lasso regression model; (C) Univariate and multivariate Cox regression analyses; (D) A simplified decision-tree model; (E) Kaplan-Meier survival curves of the three risk groups; (F) Time-dependent receiver operating characteristic curves displaying predictive accuracy for various timeframes (2-, 5-, and 10-year overall survival); (G) Calibration curves for the same three survival periods; and (H) A comparison of time-dependent AUC between the decision tree model and the nomogram model. HR: hazard ratio; CI: confidence interval; ECOG PS: Eastern Cooperative Oncology Group performance status; aCCI: age-adjusted Charlson Comorbidity Index; LGL: large granular lymphocyte; Int: intermediate; TPR: true positive rate; FPR: false positive rate; AUC: area under the curve.
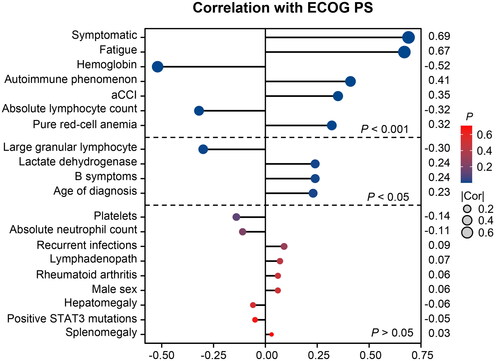
Next, we conducted a correlation analysis () to explore the relationship between ECOG PS and various variables. The results indicate a moderately strong positive correlation between ECOG PS and symptoms at presentation, primarily fatigue (all r > 0.5 and p < 0.001). However, ECOG PS is negatively correlated with the level of haemoglobin (r = −0.52, p < 0.001). We also observed a weak positive correlation between ECOG PS and autoimmune phenomenon (r = 0.41, p < 0.001), aCCI score (r = 0.35, p < 0.001), and PRCA (r = 0.32, p < 0.001). Meanwhile, a statistically significant but weak negative correlation was observed between ECOG PS and levels of ALC (r = −0.32, p < 0.001) and LGL (r = −0.30, p = 0.004). Notably, the study did not find any significant correlation between performance status and platelet count (p = 0.125).
Figure 3. Correlation analysis of the correlation with performance status. ECOG PS: Eastern Cooperative Oncology Group performance status; aCCI: age-adjusted Charlson Comorbidity Index.
Patient characteristics of different risk subgroups
presents a comparison of baseline characteristics among various risk subgroups. The findings suggest that intermediate-risk patients had a significantly higher likelihood of recurrent infections (p = 0.025), B symptoms (p = 0.004), lymphadenopathy (p = 0.010), thrombocytopenia (p < 0.001), and elevated lactate dehydrogenase (LDH) (p = 0.023) than low-risk patients. On the other hand, high-risk patients exhibited a higher incidence of fatigue (p = 0.001), autoimmune phenomena (p = 0.004), B symptoms (p = 0.045), poor performance status (p < 0.001), anaemia (p = 0.049), elevated LDH (p = 0.005), and high comorbidity index (p < 0.001) compared to the low-risk cohort. In relation to the intermediate-risk group, high-risk patients displayed a higher probability of fatigue (p = 0.025), PRCA (p = 0.017), poor performance status (p < 0.001), low haemoglobin levels (p = 0.033), and high comorbidity index (p = 0.004). Notably, the intermediate-risk group had a significantly lower platelet level as opposed to the high-risk group (p = 0.003). Among the 13 high-risk patients, four exhibited a low platelet count. We observed a tendency towards worse survival in patients with low platelet counts compared to those with normal platelet counts; however, the difference did not reach statistical significance (p = 0.059, Supplementary Figure S1).
Table 2. Comparisons of baseline characteristics between different risk subgroups
Treatment outcomes
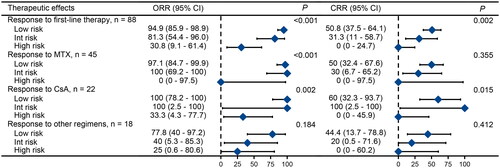
In our study, 88 of 120 patients (73.3%) had indications and received treatment at the time of diagnosis (). Initial treatment for 70 patients was standard immunosuppressive therapies, consisting of MTX (37.5%), CsA (18.3%), and CTX (2.5%). The ORR for MTX, CsA, and CTX was 95.6%, 81.8%, and 66.7% respectively (p = 0.082). The CRR was 44.4% for MTX, 45.5% for CsA, and 0% for CTX (p = 0.308). High-risk patients exhibited poor response rates to conventional immunosuppressant monotherapy or treatment with immunosuppressants in combination with other agents (). Interestingly, despite their poor physical condition, high-risk patients demonstrated good tolerance to immunosuppressive therapy. All patients adhered to the treatment protocol without any dose reductions or delays due to toxicity.
Figure 4. Sankey plot Illustrating relationship and distribution between risk stratification and treatment. Int: intermediate; MTX: methotrexate; CTX: cyclophosphamide; CsA: cyclosporine; CR: complete remission; PR: partial remission.
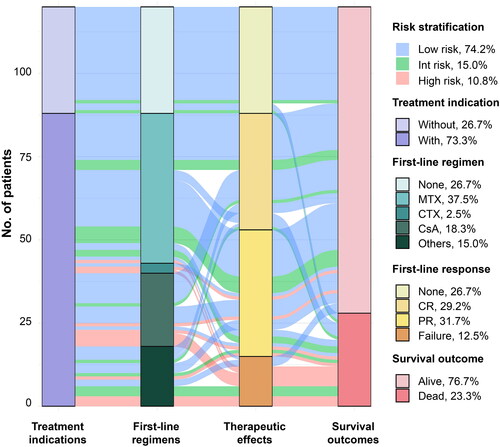
Figure 5. Treatment outcomes of different risk groups for first-line therapies. Note: Data for cyclophosphamide is not shown due to the limited number of cases. The other treatment regimens used were CHOP (cyclophosphamide + doxorubicin + vincristine + prednisone), EPOCH (etoposide + doxorubicin + cyclophosphamide + vincristine + prednisone), FC (fludarabine + cyclophosphamide), and so on. ORR: overall response rate; CI: confidence interval; CRR: complete remission rate; Int: intermediate; MTX: methotrexate; CsA: cyclosporine.
Discussion
In this study, we retrospectively evaluated 120 patients with T-LGLL to determine their clinical features and survival outcomes. A comparison of our findings with previous research revealed both similarities and discrepancies in disease characteristics, which may be attributed to differences in patient selection and inclusion criteria [Citation15]. We found that the median age at diagnosis, sex ratio, and proportion of asymptomatic patients were consistent with previous case series; however, our cohort exhibited a higher incidence of PRCA (25%) and a lower incidence of rheumatoid arthritis (5%) compared to non-Chinese series (5–8% and 11–36%, respectively) [Citation15–19]. In addition, our data confirm the excellent overall prognosis for T-LGLL, with 63.8% of our patients still alive a decade after diagnosis.
What is more, we identified a sub-fraction of patients displaying a highly aggressive clinical course and dismal prognosis. These patients are commonly considered to be in the advanced stage of the disease. However, currently, there is a lack of reliable tools to define the early and advanced stages of T-LGLL accurately, which poses a significant obstacle in guiding appropriate treatment strategies. Based on this, our study aimed to stratify patients based on prognosis and assess the effects of conventional treatment regimens on individuals with different disease characteristics. Through comprehensive analysis of baseline data, we developed a simplified two-factor prognostic score (ECOG PS and platelet count) easily attainable in a clinical setting. Thrombocytopenia is an occasionally concomitant disorder in T-LGLL cases that may be induced by a high tumour burden, anti-platelet antibodies, or splenomegaly. It is typically associated with more advanced stages of the disease and the necessity for treatment [Citation11]. ECOG PS, commonly used for assessing the general health status of patients, was found to be significantly correlated with comorbidities associated with the disease, particularly anaemia in our study. To facilitate clinical practice, we employed a simplified decision tree model instead of a nomogram. To our knowledge, this is the first study to develop a prediction model for patients with T-LGLL. While we acknowledge that our study represents a preliminary exploration, we believe that our findings contribute to the understanding and management of this rare disease.
Previous studies showed age over 60 years, comorbidity index over two, and transfusion-dependent anaemia as independent risk factors for reduced OS in LGLL patients [Citation1,Citation20]. Given the size and heterogeneity of the study population, it’s not surprising to see variations in these findings. Furthermore, these factors may have a collinear relationship with ECOG PS, and therefore our results are not really in conflict with existing research. Notably, high-risk patients with low-performance status showed good tolerance to immunosuppressive therapy, which may benefit from the administration of supportive treatments like blood transfusions, haematopoietic growth factors, and prophylactic antibiotics, among others. Consequently, we posit that the lower response rates observed in these patients are predominantly attributed to the intrinsic nature of the disease rather than the patient’s physical condition.
STAT mutations were the most distinctive genetic features described in T-LGLL patients; however, their causal relationship with the development of T-LGLL remains unclear [Citation21]. Studies have documented the presence of STAT3 and STAT5b mutations in 11–73% and 2–55% of T-LGLL patients, respectively [Citation13,Citation22,Citation23]. A recent report revealed that STAT3 mutations are independently associated with reduced OS in LGLL patients, but previous studies have found no significant difference or even a favourable effect [Citation20,Citation24,Citation25]. In our cohort, 17.5% of patients carried STAT3 mutations, and univariate analysis showed no significant difference in overall survival. Further investigation is necessary to determine the prognostic significance of STAT3 mutations in T-LGLL patients.
The association between mutations outside the JAK/STAT pathway and prognosis in T-LGLL patients remains uncertain. Two whole-exome sequencing studies have explored somatic mutations in genes other than STAT3 in T-LGLL, revealing strikingly divergent mutational spectrums [Citation5,Citation26]. The observed mutation patterns in T-LGLL exhibit potential links to comorbidities and ethnicity, underscoring the importance of further investigations in the East Asian patient population. Regrettably, our study’s retrospective design limited the inclusion of additional next-generation sequencing (NGS) testing for patients. Future research endeavours will prioritize the incorporation of NGS as it plays a crucial role in unravelling the intricate complexities associated with this rare disease.
Immunosuppressive therapy constitutes the cornerstone of T-LGLL treatment. Our study involved the administration of various regimens that included drugs such as MTX, CsA, CTX to patients. Since this disease is rare, there has not been a direct comparison of these oral immunosuppressive agents in a prospective manner. Nevertheless, retrospective studies have demonstrated similar ORRs [Citation25], and our findings support this. Although high-risk patients generally tolerate conventional immunosuppressive therapy well, its efficacy falls short of meeting their needs. Therefore, future research should concentrate on developing innovative, efficacious, and safe therapies aimed at enhancing outcomes for these patients. Our approach could assist in identifying such patients and devising prospective randomized trials.
When interpreting our results, it is important to consider the limitations of our study. Firstly, we used an internal validation method, in which the validation dataset was taken from the training data. Although we obtained good results, further studies are necessary to validate the accuracy of our model in diverse patient populations. Secondly, due to the study’s retrospective nature, some parameters were not available for all patients, and we had to rely on the patient’s self-report or clinician’s documentation for certain subjective data, such as ECOG PS. Lastly, our study lacked consistent therapy. Future prospective studies can provide further insights and address these limitations.
Conclusions
In conclusion, our model represents a significant step forward in predicting OS for patients diagnosed with T-LGLL. Its simplicity makes it a practical option for use in resource-limited settings, giving clinicians the ability to make informed treatment decisions based on projected outcomes. However, further external validation is necessary before the model can be widely adopted. Nonetheless, this scoring system holds great potential for improving patient care and management in the future.
Author contributions
Concept and design: Hailing Liu, Jingjing Guo, Lei Cao, Jianyong Li, and Lei Fan; Definition of intellectual content and literature search: Jingjing Guo, Huayuan Zhu, Yi Miao, Xinyi Du, Yujie Wu, and Wei Xu; Data acquisition, data analysis, and statistical analysis: Hailing Liu, Lei Cao, Huayuan Zhu, Yi Miao, Xinyi Du, Jianyong Li, and Lei Fan; Manuscript preparation: Hailing Liu, Jingjing Guo, and Lei Cao; Manuscript editing and manuscript review: All.
Supplemental Material
Download MS Word (451.4 KB)Acknowledgments
We thank Dr. Dongdong Yao at the Brigham and Women’s Hospital for professional English language proofreading of the manuscript.
Disclosure statement
No potential conflict of interest was reported by the author(s).
Data availability statement
The data generated in this study are available upon request from the corresponding author.
Additional information
Funding
References
- Shah MV, Hook CC, Call TG, et al. A population-based study of large granular lymphocyte leukemia. Blood Cancer J. 2016;6(8):1–10. doi: 10.1038/bcj.2016.59.
- Swerdlow SH, Campo E, Pileri SA, et al. The 2016 revision of the World Health Organization classification of lymphoid neoplasms. Blood. 2016;127(20):2375–2390. doi: 10.1182/blood-2016-01-643569.
- Garrido P, Ruiz-Cabello F, Bárcena P, et al. Monoclonal TCR-Vbeta13.1+/CD4+/NKa+/CD8-/+dim T-LGL lymphocytosis: evidence for an antigen-driven chronic T-cell stimulation origin. Blood. 2007;109(11):4890–4898. doi: 10.1182/blood-2006-05-022277.
- Lamy T, Moignet A, Loughran TJ. LGL leukemia: from pathogenesis to treatment. Blood. 2017;129(9):1082–1094. doi: 10.1182/blood-2016-08-692590.
- Coppe A, Andersson EI, Binatti A, et al. Genomic landscape characterization of large granular lymphocyte leukemia with a systems genetics approach. Leukemia. 2017;31(5):1243–1246. doi: 10.1038/leu.2017.49.[]
- Moignet A, Lamy T. Latest advances in the diagnosis and treatment of large granular lymphocytic leukemia. Am Soc Clin Oncol Educ Book. 2018;38:616–625. doi: 10.1200/EDBK_200689.
- Hasanov E, Fard EV, Puravath A, et al. T-cell large granular lymphocytic leukaemia in the context of rheumatoid arthritis. Lancet. 2018;392(10152):1071. doi: 10.1016/S0140-6736(18)32208-6.
- Qiu ZY, Qin R, Tian GY, et al. Pathophysiologic mechanisms and management of large granular lymphocytic leukemia associated pure red cell aplasia. Onco Targets Ther. 2019;12:8229–8240. doi: 10.2147/OTT.S222378.
- Gentile TC, Uner AH, Hutchison RE, et al. CD3+, CD56+ aggressive variant of large granular lymphocyte leukemia. Blood. 1994;84(7):2315–2321. doi: 10.1182/blood.V84.7.2315.2315.
- Sylvia MT, Jacob SE, Basu D, et al. CD56 negative aggressive T cell large granular lymphocytic leukemia. Indian J Hematol Blood Transfus. 2016;32(Suppl 1):121–124. doi: 10.1007/s12288-015-0502-9.
- Liu Y, Fan L, Zhao H, et al. Metronomic regimen as an effective treatment for aggressive T-LGL leukemia with Central nervous system infiltration: clinical experience and review of literature. Oncotarget. 2017;8(19):32292–32297. doi: 10.18632/oncotarget.15762.
- Alekshun TJ, Tao J, Sokol L. Aggressive T-cell large granular lymphocyte leukemia: a case report and review of the literature. Am J Hematol. 2007;82(6):481–485. doi: 10.1002/ajh.20853.
- Barilà G, Calabretto G, Teramo A, et al. T cell large granular lymphocyte leukemia and chronic NK lymphocytosis. Best Pract Res Clin Haematol. 2019;32(3):207–216. doi: 10.1016/j.beha.2019.06.006.
- Loughran TP, Jr, Zickl L, Olson TL, et al. Immunosuppressive therapy of LGL leukemia: prospective multicenter phase II study by the Eastern cooperative oncology group (E5998). Leukemia. 2015;29(4):886–894. doi: 10.1038/leu.2014.298.
- Bareau B, Rey J, Hamidou M, et al. Analysis of a French cohort of patients with large granular lymphocyte leukemia: a report on 229 cases. Haematologica. 2010;95(9):1534–1541. doi: 10.3324/haematol.2009.018481.
- Loughran TP.Jr. Clonal diseases of large granular lymphocytes. Blood. 1993;82(1):1–14. doi: 10.1182/blood.V82.1.1.bloodjournal8211.
- Dhodapkar MV, Li CY, Lust JA, et al. Clinical spectrum of clonal proliferations of T-large granular lymphocytes: a T-cell clonopathy of undetermined significance? Blood. 1994;84(5):1620–1627. doi: 10.1182/blood.V84.5.1620.1620.
- Semenzato G, Zambello R, Starkebaum G, et al. The lymphoproliferative disease of granular lymphocytes: updated criteria for diagnosis. Blood. 1997;89(1):256–260. doi: 10.1182/blood.V89.1.256.
- Neben MA, Morice WG, Tefferi A. Clinical features in T-cell vs. natural killer-cell variants of large granular lymphocyte leukemia. Eur J Haematol. 2003;71(4):263–265. doi: 10.1034/j.1600-0609.2003.00136.x.
- Barilà G, Teramo A, Calabretto G, et al. Stat3 mutations impact on overall survival in large granular lymphocyte leukemia: a single-center experience of 205 patients. Leukemia. 2020;34(4):1116–1124. doi: 10.1038/s41375-019-0644-0.
- Kerr CM, Clemente MJ, Chomczynski PW, et al. Subclonal STAT3 mutations solidify clonal dominance. Blood Adv. 2019;3(6):917–921. doi: 10.1182/bloodadvances.2018027862.
- Rajala HL, Eldfors S, Kuusanmäki H, et al. Discovery of somatic STAT5b mutations in large granular lymphocytic leukemia. Blood. 2013;121(22):4541–4550. doi: 10.1182/blood-2012-12-474577.
- Andersson EI, Tanahashi T, Sekiguchi N, et al. High incidence of activating STAT5B mutations in CD4-positive T-cell large granular lymphocyte leukemia. Blood. 2016;128(20):2465–2468. doi: 10.1182/blood-2016-06-724856.
- Jerez A, Clemente MJ, Makishima H, et al. STAT3 mutations unify the pathogenesis of chronic lymphoproliferative disorders of NK cells and T-cell large granular lymphocyte leukemia. Blood. 2012;120(15):3048–3057. doi: 10.1182/blood-2012-06-435297.
- Sanikommu SR, Clemente MJ, Chomczynski P, et al. Clinical features and treatment outcomes in large granular lymphocytic leukemia (LGLL). Leuk Lymphoma. 2018;59(2):416–422. doi: 10.1080/10428194.2017.1339880.
- Cheon H, Xing JC, Moosic KB, et al. Genomic landscape of TCRαβ and TCRγδ T-large granular lymphocyte leukemia. Blood. 2022;139(20):3058–3072. doi: 10.1182/blood.2021013164.