
Abstract
Background
Acute kidney injury (AKI) is common after liver transplantation (LT). We developed a nomogram model to predict post-LT AKI.
Methods
A total of 120 patients were eligible for inclusion in the study. Clinical information was extracted from the institutional electronic medical record system. Blood samples were collected prior to surgery and immediately after surgery. Univariable and multivariate logistic regression were used to identify independent risk factors. Finally, a nomogram was developed based on the final multivariable logistic regression model.
Results
In total, 58 (48.3%) patients developed AKI. Multivariable logistic regression revealed four independent risk factors for post-LT AKI: operation duration [odds ratio (OR) = 1.728, 95% confidence interval (CI) = 1.121–2.663, p = 0.013], intraoperative hypotension (OR = 3.235, 95% CI = 1.316–7.952, p = 0.011), postoperative cystatin C level (OR = 1.002, 95% CI = 1.001–1.004, p = 0.005) and shock (OR = 4.002, 95% CI = 0.893–17.945, p = 0.070). Receiver operating characteristic curve analysis was used to evaluate model discrimination. The area under the curve value was 0.815 (95% CI = 0.737–0.894).
Conclusion
The model based on combinations of clinical parameters and postoperative cystatin C levels had a higher predictive performance for post-LT AKI than the model based on clinical parameters or postoperative cystatin C level alone. Additionally, we developed an easy-to-use nomogram based on the final model, which could aid in the early detection of AKI and improve the prognosis of patients after LT.
KEY MESSAGES
Acute kidney injury (AKI) is one of the most common and important complications after liver transplantation (LT).
We developed a nomogram model to predict post-LT AKI based on clinical parameters and postoperative cystatin C level.
The model based on combinations of clinical parameters and postoperative cystatin C levels had a higher predictive performance, which could aid in the early detection of AKI and improve the prognosis of patients after LT.
Introduction
Acute kidney injury (AKI) is one of the most common and important complications after liver transplantation (LT); however, its pathogenesis has not been fully elucidated [Citation1–3]. Although the surgical techniques, donor organ preservation methods and immunosuppression programs have been greatly improved in recent years, the incidence of post-LT AKI remains high [Citation4–10]. Previous studies have found that post-LT AKI after LT is associated with longer duration of intensive care unit (ICU) stay, higher hospital costs and mortality rates and more common graft rejection and development of chronic kidney disease and higher mortality [Citation11–16]. Furthermore, previous studies have also shown that early identification and prevention, such as avoidance of the use of nephrotoxic drugs, and early intervention, such as renal replacement therapy (RRT) when necessary, can improve the prognosis of patients with post-LT AKI [Citation8,Citation17–20]. Therefore, early assessment of the risk for AKI risk as well as early prevention and early intervention are critical.
The pathogenesis of AKI after LT is likely multifactorial [Citation7,Citation15,Citation21,Citation22]. Previous studies have demonstrated that several preoperative, intraoperative and postoperative variables are related to the development of AKI after LT; these variables include serum creatinine (sCr), intraoperative haemorrhage, intraoperative fluid balance, postoperative infection, urine output, early allograft dysfunction (EAD) and the use of immunosuppressive agents with renal toxicity [Citation9,Citation22–27]. Furthermore, several visualized prediction methods, such as nomograms and decision trees, have been established for predicting post-LT AKI [Citation9,Citation10,Citation13,Citation28]. However, most of the studies were retrospective and observational and did not use standard definition criteria for post-LT AKI; therefore, the reliability of previous studies is unclear. Additionally, with an improved understanding of the pathogenesis of post-LT AKI, studies have shown that some novel biomarkers are useful for the early prediction of the occurrence and development of post-LT AKI. The prediction model based on a combination of clinical parameters and novel biomarkers can improve the prediction ability for post-LT AKI [Citation29–32].
In this study, we prospectively enrolled patients with LT and collected the clinical information of LT patients. Blood samples were collected prior to surgery and immediately after surgery to test the serum levels of biomarkers, including cystatin C, neutrophil gelatinase-associated lipocalin (NGAL), endostatin and macrophage migration inhibition factor (MIF). We included these four markers for detection because previous studies have indicated their significance in predicting AKI. A recent review highlights the use of these novel markers for predicting AKI in liver transplant or liver cirrhosis patients [Citation30].We compared the ability of these four novel biomarkers and developed a predictive model based on the combinations of clinical parameters and biomarkers to predict post-LT AKI. Finally, we established a nomogram based on the model. This easy-to-use tool with good discrimination and calibration abilities may aid in the early detection of AKI and improve patient prognosis.
Methods and patients
Study population
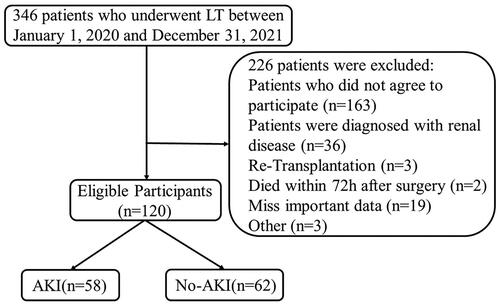
This prospective study enrolled consecutive patients who underwent LT at the Department of General Surgery in Beijing Youan Hospital between 1 January 2020 and 31 December 2021. All the LT recipients were registered in the China Organ Transplant Response Systems (www.cot.org.cn). Written informed consent was obtained from patients or their families at enrolment. The clinical information was extracted from the electronic medical record system. Blood samples were collected preoperatively and postoperatively for the detection of biomarkers using enzyme-linked immunosorbent assay (ELISA). We excluded patients who did not provide consent as well as those with renal diseases pre-LT, re-transplantation, death within 72 h after surgery, missing important data or age <18 years. Finally, data from 120 patients were included in the analysis (). This study was approved by the Ethical Committee of Beijing Youan Hospital (approval number: [2019] 016). This clinical study was registered with the Chinese Clinical Trial Register (ChiCTR; CHiCTR1900024561; http://www.chictr.org/cn/).
Figure 1. Flow diagram of patient enrolment. Abbreviations: LT: liver transplantation; AKI: acute kidney injury.
Diagnostic criteria for AKI
Postoperative AKI was diagnosed according to the 2012 Kidney Disease: Improving Global Outcomes (KDIGO) clinical practice guidelines [Citation33,Citation34]: (1) an increase in sCr level ≥ 26.5 μmol/L (0.3 mg/dL) within 48 h; (2) or increase in sCr level to ≥1.5 times the baseline level within 7 days after LT; or (3) urine volume (UV) < 0.5 mL/(kg · h) for >6 h post-LT. AKI was classified into three stages: stage 1, sCr level of ≥26.5 μmol/L (0.3 mg/dL) or increase to 1.5–1.9-fold from baseline or UV < 0.5 mL/(kg · h) for 6–12 h; stage 2, sCr level increase to 2–2.9-fold of baseline or UV < 0.5 mL/(kg · h) for >12 h; and stage 3, sCr level increase to >3-fold of baseline or ≥354 μmol/L (4.0 mg/dL) or application of Continuous Renal Replacement Therapy. The lowest sCr level within 1 month pre-LT was used as the baseline value. We compared the maximum sCr level within the first 7 days postoperatively with the baseline level.
Data collection
The clinical information, including demographic data, medical history, disease course and laboratory test results, was extracted from the institutional electronic medical record system. Variables known to be related to post-transplant renal dysfunction based on previous studies were also recorded [Citation6,Citation14,Citation21]. The recorded variables were divided into preoperative, intraoperative and postoperative factors.
The preoperative participant factors included sex, age, body mass index, primary liver diseases (liver cancer or liver failure), liver complications (encephalopathy or ascites), baseline medical status (e.g. coronary heart disease, hypertension, diabetes mellitus and biliary tract disease) and preoperative laboratory parameters [e.g. sCr, alanine aminotransferase (ALT) and aspartate aminotransferase (AST)]. Liver cancer met the Milan Criteria [Citation35] and patients with acute or subacute liver failure had absolute priority (model for end-stage liver disease score ≥15).
The intraoperative factors included cold ischaemia time, anhepatic phase, surgical approach, operative time, intraoperative bleeding, blood product transfusions, intraoperative fluid balance, intraoperative hypotension, intraoperative hypotension time and intraoperative urine output. Intraoperative hypotension was defined as systolic blood pressure (SBP) decrease of >20% from baseline or <90 mmHg.
The postoperative factors included laboratory parameters [e.g. postoperative lactic acid, postoperative ALT, 7-day postoperative ALT, highest postoperative ALT, AST and total bilirubin (TB)] and postoperative clinical outcomes [e.g. EAD, acute respiratory distress syndrome (ARDS) and duration of mechanical ventilation]. Postoperative shock was defined as SBP decrease >40 mmHg from baseline or <90 mmHg or shock index ≥ 1 (pulse rate/SBP) with an incentive for shock (such as postoperative bleeding, severe infection and severe underlying heart disease).
Blood sample collection and tests
Blood samples were collected prior to surgery and immediately after surgery. The samples were centrifuged at 2200g for 15 min at 4 °C. The serum was stored at −80 °C for further ELISA. Serum levels of cystatin C, NGAL, endostatin and MIF were determined using human cystatin C ELISA kits (R&D Systems; catalog no. DSCTC0), human Lipocalin-2/NGAL ELISA kits (R&D Systems; catalog no. DLCN20), human Endostatin ELISA kits (R&D Systems; catalog no. DNST0) and human MIF ELISA kits (R&D Systems; catalog no. DMF00B), respectively. The tests were performed according to the manufacturer’s protocols.
Sample size
For this predictive study, the effective sample size depends on the variables included in the model and the number of outcome events. Currently, it is believed that having 10 outcome events per variable ensures the reliability of the results [Citation36]. Our study ultimately included four independent risk factors, and we observed 58 cases of AKI in our study. The number of outcome events for each variable far exceeds the recommended threshold of 10, indicating the reliability of our study.
Statistical analysis
The normality of continuous variables was assessed using the Shapiro–Wilk test. Normally distributed continuous variables were displayed as mean ± standard deviation (SD) and compared using the independent-samples Student’s t test. Non-normally distributed continuous variables were displayed as median with interquartile range (IQR) and compared using the Mann–Whitney U test. Categorical variables were expressed as counts with percentages and compared using Pearson’s chi-square or Fisher’s exact test. Variables with p values of <0.05 were considered statistically significant. The associations between variables and AKI were evaluated using univariable logistic regression. Factors with p < 0.05 in univariable logistic regression were included in backward stepwise logistic regression for multivariate analysis. The area under the curve (AUC) of the receiver operating characteristic (ROC) curve for the final multivariable logistic regression models was used to evaluate the discrimination ability of the model. Furthermore, a nomogram was developed based on the final multivariable logistic regression model. The calibration of the nomogram was evaluated by the Hosmer–Lemeshow goodness-of-fit test and calibration curve. The clinical application value of the model was also evaluated by decision curve analysis (DCA). The correlations between the postoperative cystatin C level, intraoperative parameters and postoperative laboratory results were explored using Spearman’s rank correlation test. Data were analyzed using SPSS software (version 21.0; IBM Corp) and R language (version 4.0.3; R Foundation for Statistical Computing) and illustrated using GraphPad Prism 9 (GraphPad Software Inc.).
Results
Characteristics of the study population
A total of 120 patients were included in the statistical analysis (), including 58 (48.3%) with AKI and 62 (51.7%) without AKI. Ten (8.3%) patients died within 1 year after LT, seven (70%) of whom were diagnosed with AKI postoperatively. The basic characteristics of patients are shown in . The mean age of the patients was 53 years (±10), and 96 (80%) of them were males. Of the patients, 64 (53.3%) and 40 (33.3%) underwent LT because of hepatocellular carcinoma and liver failure, respectively. Many patients had symptoms of decompensated liver cirrhosis, such as encephalopathy (20.8%) and ascites (55.1%).
Table 1. Characteristics of study population.
Among preoperative factors, encephalopathy, Child–Pugh classification and TB level (all p < 0.05) were associated with post-LT AKI. Among intraoperative factors, anhepatic phase, operative time, intraoperative bleeding, blood product transfusions, intraoperative fluid balance, intraoperative hypotension, duration of intraoperative hypotension and intraoperative urine output were associated with post-LT AKI (all p < 0.05). Among post-operative factors, lactic acid levels measured immediately postoperatively, 7-day postoperative and peak ALT levels, immediate postoperative, 7-day postoperative and peak AST levels, immediate postoperative, 7-day postoperative and peak TB levels, EAD, ARDS, duration of mechanical ventilation, shock and infection were associated with post-LT AKI (all p < 0.05). The aforementioned factors were further evaluated by univariate logistic regression analysis and were confirmed to be significantly associated with post-LT AKI ().
Novel biomarkers for AKI after LT
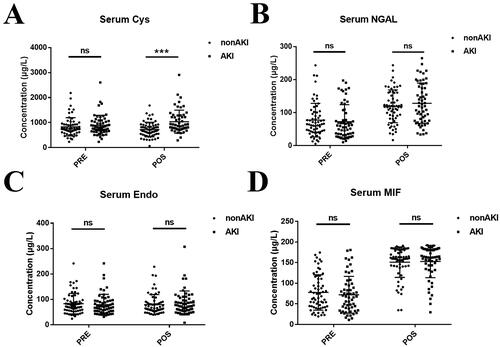
Blood samples were collected prior to surgery and immediately after surgery. Serum samples were collected by centrifugation and stored at −80 °C. Serum levels of cystatin C, NGAL, endostatin and MIF were detected by ELISA. Among the biomarkers related to renal injury, the postoperative cystatin C level was significantly different between the AKI and non-AKI groups (p < 0.001). However, there was no significant difference in the preoperative cystatin C, preoperative and postoperative NGAL, preoperative and postoperative endostatin and preoperative and postoperative MIF (all p > 0.05) between the two groups ( and Supplemental Table S1). The ROC curves of the four biomarkers for the prediction of post-LT AKI are shown in Figure S1.
Figure 2. Novel biomarkers for AKI after LT. (A) serum cystatin C concentration, (B) serum NGAL concentration, (C) serum endostatin concentration and (D) serum MIF concentration. Abbreviations: AKI: acute kidney injury; NGAL: neutrophil gelatinase-associated lipocalin; MIF: macrophage migration inhibition factor; PRE: preoperative; POS: postoperative. ns: not statistically significant, ***p-value < 0.001.
Univariable logistic regression analysis for the predictors of AKI after LT
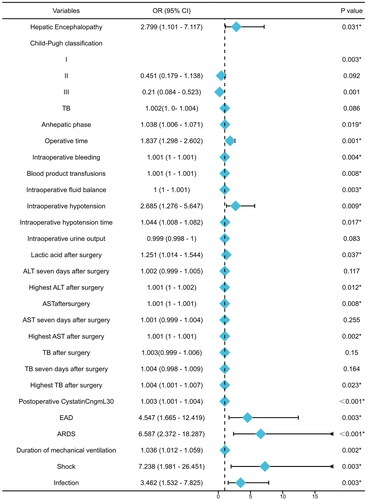
The aforementioned variables and postoperative cystatin C level were evaluated by univariate logistic regression analysis to identify the risk factors of post-LT AKI. Hepatic encephalopathy [odds ratio (OR) = 2.799, 95% confidence interval (CI) = 1.101–7.117, p = 0.031], Child–Pugh classification, anhepatic phase, operative time, intraoperative bleeding, blood product transfusions, intraoperative fluid balance, intraoperative hypotension, duration of intraoperative hypotension, lactic acid, AST and cystatin C levels immediately postoperatively, peak ALT, AST and TB levels, EAD, ARDS, duration of mechanical ventilation, shock and infection showed significant results in the univariable logistic regression analysis (all p < 0.05). The results are presented in and Supplemental Table S2.
Figure 3. The forest plot of univariable logistic regression analysis for the predictors of AKI after LT. Abbreviations: OR: odds ratio; 95% CI (OR): 95% confidence interval of OR; TB: serum total bilirubin; ALT: alanine aminotransferase; AST: aspartate aminotransferase; EAD: early allograft dysfunction; ARDS: acute respiratory distress syndrome. *p-Value < 0.05.
Multivariate logistic regression model for the predictors of post-LT AKI
Factors with p < 0.05 in the univariate logistic regression analysis were included in multivariable logistic regression. Based on the backward stepwise logistic regression, the final regression model was established. Operative time (OR = 1.728, 95% CI = 1.121–2.663, p = 0.013), intraoperative hypotension (OR = 3.235, 95% CI = 1.316–7.952, p = 0.011), postoperative cystatin C level (OR = 1.002, 95% CI = 1.001–1.004, p = 0.005) and shock (OR = 4.002, 95% CI = 0.893–17.945, p = 0.070) were independent risk factors for post-LT AKI (). The ROC was used to evaluate the discrimination ability of the model, which showed an AUC of 0.815 (95% CI = 0.737–0.894; a)). The optimal cut-off value was 0.524 according to the Youden index. The Youden index of the model was 0.554, and the sensitivity and specificity of the model were 0.85 and 0.704, respectively. We also assessed the discrimination ability of postoperative cystatin C level. The model based on the clinical parameters only showed an AUC of 0.721 (95% CI = 0.629–0.813; b)) and 0.770 (95% CI = 0.682–0.858; c)).
Figure 4. The ROC curves of two models and postoperative cystatin C level. (a) The model showing the area under the ROC curve (AUC) was 0.815 [95% CI: 0.737–0.894]. (b) Postoperative cystatin C level, AUC was 0.721 (95% CI: 0.629–0.813). (c) The model only with clinical factors, AUC was 0.770 (95% CI: 0.682–0.858). Abbreviations: TPR: true positive rate; FPR: false positive rate.
![Figure 4. The ROC curves of two models and postoperative cystatin C level. (a) The model showing the area under the ROC curve (AUC) was 0.815 [95% CI: 0.737–0.894]. (b) Postoperative cystatin C level, AUC was 0.721 (95% CI: 0.629–0.813). (c) The model only with clinical factors, AUC was 0.770 (95% CI: 0.682–0.858). Abbreviations: TPR: true positive rate; FPR: false positive rate.](/cms/asset/7219c41e-e9f6-4463-8ee5-2eefee4fc8b5/iann_a_2259410_f0004_c.jpg)
Table 2. Multivariate logistic regression model for the prediction of post-LT AKI.
Development of a nomogram for the prediction of post-LT AKI
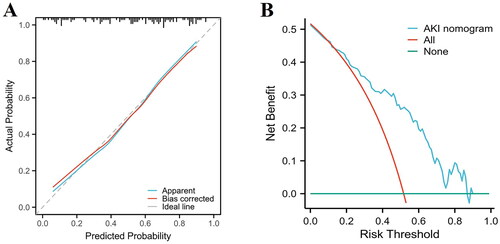
A novel nomogram model for the prediction of post-LT AKI was established using the results of multivariable logistic regression (). Based on their regression coefficients, points were assigned to the four independent predictors according to the top line of the nomogram, labelled ‘Points’. The points were added to evaluate the possibility of post-LT AKI. The test score of the Hosmer–Lemeshow goodness-of-fit test was 0.514 > 0.05. Furthermore, the calibration curve of the nomogram for predicting the risk of developing post-LT AKI is presented in , which demonstrated good agreement between the AKI probabilities predicted by the nomogram and the observed probabilities (p = 0.63). The DCA of the AKI nomogram model is presented in with a threshold probability across 1–90%. These results suggest that the calibration of the nomogram was acceptable. The model was reliable for clinical utility.
Figure 5. Development of a nomogram for the prediction of post-LT AKI.
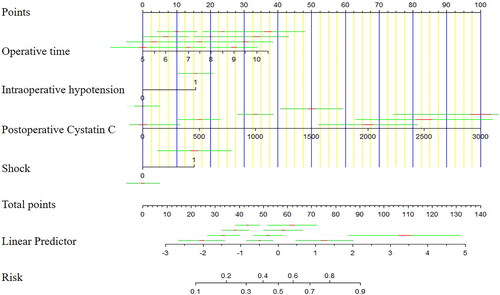
Figure 6. Decision curve analysis (A) and calibration curves (B) of the nomogram for the prediction of post-LT AKI.
Correlation between postoperative cystatin C level, intraoperative parameters and postoperative laboratory results
The postoperative cystatin C level, intraoperative details and postoperative laboratory data (anhepatic phase, operative time, intraoperative bleeding, blood product transfusions, intraoperative fluid balance, intraoperative hypotension time, intraoperative urine output and postoperative lactic acid, ALT, AST and TB levels) are presented in a graphical format and displayed as a heatmap ().
Figure 7. Correlation between postoperative cystatin C level, intraoperative parameters and postoperative laboratory results. The values are presented as Spearman’s r of 120 runners for operative cystatin C. Colormap with range between 1 and −1 and blue for the largest value and red for the smallest value. Abbreviations: ALT: alanine aminotransferase; AST: aspartate aminotransferase; TB: serum total bilirubin.
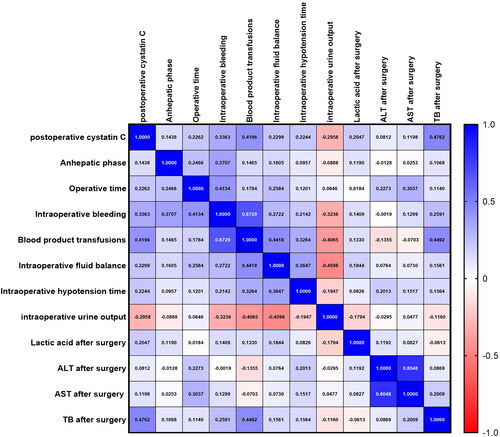
The heatmap colors represent the correlation coefficients of a large number of variables, as indicated by the color key. Analytes in graded shades of blue and red represent their positive and negative correlations, respectively.
The postoperative cystatin C level was correlated with operative time (p = 0.013, r = 0.227), intraoperative bleeding (p = 0.00017, r = 0.336), blood product transfusions (p < 0.00001, r = 0.420), intraoperative fluid balance (p = 0.0116, r = 0.230), intraoperative hypotension time (p = 0.014, r = 0.224), intraoperative urine output (p = 0.001, r = −0.296) and postoperative lactic acid (p = 0.0248, r = 0.205) and TB (p < 0.00001, r = 0.476) levels ( and ).
Discussion
In this prospective study, we collected clinical information and blood samples for testing the serum levels of four biomarkers of AKI from 120 patients who underwent LT. We found that operative time, intraoperative hypotension, postoperative cystatin C level and shock were independent risk factors for post-LT AKI. Finally, we developed a nomogram model to predict post-LT AKI and evaluated the discrimination and calibration abilities of the model. In recent years, although novel biomarkers have been reported to be associated with post-LT AKI, the usage has been limited for clinical decision-making [Citation30]. Previous studies that developed nomogram models had a retrospective study design, which may be associated with bias, and did not include novel biomarkers [Citation9,Citation10,Citation13]. Our study was conducted prospectively and studied the dynamic alterations of biomarkers from pre- to post-LT, which may help us understand the pathogenesis of this disease. Furthermore, our study found that postoperative cystatin C level is an independent risk factor for post-LT AKI. As cystatin C is commonly available in clinical laboratories [Citation31,Citation37,Citation38], a nomogram based on combinations of clinical factors and cystatin C level would facilitate clinical decision-making and improve the patient’s prognosis.
In our study, AKI was a common complication after LT, which is consistent with previous reports [Citation7,Citation10,Citation39,Citation40]. The incidence of post-LT AKI in our study was 48.3% based on the 2012 KDIGO criteria. Among these patients, 31 (53.4%), 13 (22.4%) and 14 (24.2%) had stage 1–3 AKI, and eight (13.8%) required RRT. The incidence of ARDS was higher in the AKI group than in the non-AKI group. The duration of mechanical ventilation and ICU stay was significantly longer in the AKI group than in the non-AKI group. The in-hospital mortality rate was 2.52-fold higher in the AKI group than in the non-AKI group. In summary, our study found that patients with post-LT AKI are at increased risk of serious complications and a poor prognosis, similar to previous studies [Citation4,Citation10,Citation13,Citation15,Citation22,Citation41–43].
Our study found three independent risk factors for post-LT AKI: operative time, intraoperative hypotension and postoperative shock. These risk factors were consistent with those identified in previous studies [Citation10,Citation22,Citation28,Citation44]. Longer operative time is associated with increased risks for prolonged anaesthesia, anhepatic phase, cold ischaemia phase, increased blood loss and complications. Meanwhile, obesity and related factors may increase the difficulty of the operation and prolong the operation time [Citation9,Citation45,Citation46]. To sum up, operative time is a complex factor that not only increases the risk of post-LT AKI but also reflects increasing operational complexity. Previous studies have shown that intraoperative hypotension is associated with post-LT AKI [Citation13,Citation43,Citation47]. Kidneys are one of the most blood supply-demanding organs in the human body and are extremely sensitive to ischaemia and hypoxia. In patients undergoing LT, hypotension due to massive blood loss or other causes may lead to insufficient kidney perfusion, leading to a rapid decrease in UV and significant change in renal function within a short period [Citation9,Citation34]. Additionally, hypotension usually occurs in the reperfusion phase during LT, named post-reperfusion syndrome. This syndrome is defined as a decrease of mean arterial pressure >30% lasting ≥1 min within the first 5 min after reperfusion. Studies have demonstrated that post-reperfusion syndrome was significantly associated with post-LT AKI [Citation48,Citation49]. Furthermore, intraoperative hypotension may lead to increased use of vasopressors and relatively positive fluid balance, which might predispose to harmful outcomes [Citation26,Citation29,Citation43]. During solid organ transplantation, haemodynamic instability increases the risks for EAD. EAD is associated with post-LT AKI [Citation29,Citation50]. Similarly, postoperative shock is one of the most important risk factors for post-LT AKI [Citation51].
The role of novel biomarkers is increasingly being appreciated for the prediction of AKI. However, previous studies of LT patients have reported controversial findings [Citation30]. In our study, blood samples were collected pre- and post-LT. The serum levels of four novel biomarkers of AKI were tested by ELISA. We found that the postoperative cystatin C level was significantly different between the AKI and non-AKI groups (p < 0.001); however, there were no significant differences between the two groups in terms of the preoperative cystatin C, NGAL, endostatin and MIF levels and postoperative NGAL, endostatin and MIF levels (all p > 0.05). Previous studies have reported mixed results regarding the use of NGAL for the detection of AKI. The diagnostic performance (AUC) in previous studies of urinary NGAL for the prediction of AKI ranged from 0.66 to 0.92. The performance of urinary NGAL is superior to that of plasma and serum NGAL; furthermore, dynamic alterations in NGAL levels are more useful [Citation52–54]. Our study found no significant differences in preoperative and postoperative NGAL levels between the AKI and non-AKI groups; furthermore, there were no significant changes in the NGAL levels during pre- and post-LT. Therefore, our results were consistent with those of a previous study that compared the performances of NGAL and MIF for the prediction of post-LT AKI [Citation55]. In the previous study, at the end of LT, only serum MIF—and not urinary MIF, serum NGAL and urinary NGAL—predicted severe AKI (p = 0.03). Interestingly, there were no significant differences between the AKI and non-AKI groups in terms of the MIF level. However, there was a significant increase in the MIF level after LT compared to pre-LT, indicating that the MIF level was sensitive to surgery. The serum MIG level was increased in both AKI and non-AKI groups after LT. However, the MIF level is a potential predictor for the requirement of RRT [Citation56]. Previous studies of endostatin have shown that it is useful in predicting AKI in critically ill patients and in predicting renal recovery from AKI [Citation57,Citation58]. However, our study found no statistically significant difference in serum endostatin levels between the AKI and non-AKI groups, which may be partly due to the substantial heterogeneity of the studied patient populations and blood sampling time points. Previous studies reported that elevated cystatin C levels are associated with AKI development, with the AUC of the diagnostic performance ranging from 0.59 to 0.98 [Citation59,Citation60]. Our study found that the AUC of postoperative cystatin C level was 0.721 (p < 0.001, 95% CI = 0.629–0.813). The model based on combinations of clinical factors and postoperative cystatin C level has a higher distinguishing ability (AUC = 0.815, 95% CI = 0.737–0.894, p < 0.001) than the model based on clinical parameters or postoperative cystatin C level alone ().
Compared to previous studies [Citation9,Citation10,Citation13], our study was conducted prospectively and evaluated the dynamic biomarker changes during pre- and post-LT, which can aid in our understanding of disease pathogenesis. It is important to initiate measures to prevent AKI in high-risk patients. Our study found that haemodynamic stability during the operation period and avoidance of postoperative shock would decrease the incidence of post-LT AKI. Furthermore, we developed a prediction model based on three clinical factors and biomarkers. The method is easy to use, has good discrimination and calibration abilities and could assist in clinical decision-making and improve the patient prognosis.
Our study had several limitations. Firstly, donor information was not included due to the privacy protection policy in our centre. Secondly, the number of recipients in the study was relatively small owing to the relative difficulty in obtaining blood samples. Therefore, external validation of the model was not performed. Thirdly, the long-term prognosis of patients was not evaluated; thus, we will evaluate this in our future study. Finally, the applicability of our model needs external validation in other countries and populations. In fact, a larger cohort study at our centre is planned to optimize the model. Large-scale multi-centre validation is necessary for future studies.
Conclusions
In this study, the model based on combinations of clinical parameters and the postoperative cystatin C level had a higher predictive performance for the detection of post-LT AKI compared to the model based on clinical parameters or postoperative cystatin C level only. Additionally, we developed an easy-to-use nomogram based on the final model. This tool had good discrimination and calibration abilities and could aid in the early detection of AKI, leading to improved prognosis of patients after LT.
Ethical approval
All authors approved the publication of this manuscript.
Author contributions
Study design: YM, GL, XW, ZW and YW; Data collection: LH, BJ and QY; Blood specimens collected: QY, YW and XW; ELISA experiments: ZW and YW; Data analysis: ZW and YW and Manuscript writing: ZW, YW and XW. All authors read and approved the final manuscript.
Supplemental Material
Download MS Word (319.4 KB)Acknowledgement
The authors would like to thank Beijing Youan Hospital for allowing us to access the computerized health records.
Disclosure statement
No potential conflict of interest was reported by the author(s).
Data availability statement
The datasets used and/or analyzed during the current study are available from the corresponding author on reasonable request.
Additional information
Funding
References
- Lameire NH, Bagga A, Cruz D, et al. Acute kidney injury: an increasing global concern. Lancet. 2013;382(9887):1–13. doi: 10.1016/S0140-6736(13)60647-9.
- Flamm SL, Wong F, Ahn J, et al. AGA clinical practice update on the evaluation and management of acute kidney injury in patients with cirrhosis: expert review. Clin Gastroenterol Hepatol. 2022;20(12):2707–2716. doi: 10.1016/j.cgh.2022.08.033.
- Zanetto A, Northup P, Roberts L, et al. Haemostasis in cirrhosis: understanding destabilising factors during acute decompensation. J Hepatol. 2023;78(5):1037–1047. doi: 10.1016/j.jhep.2023.01.010.
- Hilmi IA, Damian D, Al-Khafaji A, et al. Acute kidney injury following orthotopic liver transplantation: incidence, risk factors, and effects on patient and graft outcomes. Br J Anaesth. 2015;114(6):919–926. doi: 10.1093/bja/aeu556.
- Lee YS, Choi YJ, Park KH, et al. Liver transplant patients with high levels of preoperative serum ammonia are at increased risk for postoperative acute kidney injury: a retrospective study. J Clin Med. 2020;9(6):1629. doi: 10.3390/jcm9061629.
- Zongyi Y, Baifeng L, Funian Z, et al. Risk factors of acute kidney injury after orthotopic liver transplantation in China. Sci Rep. 2017;7(1):41555. doi: 10.1038/srep41555.
- Kalisvaart M, Schlegel A, Umbro I, et al. The AKI Prediction Score: a new prediction model for acute kidney injury after liver transplantation. HPB. 2019;21(12):1707–1717. doi: 10.1016/j.hpb.2019.04.008.
- Trinh E, Alam A, Tchervenkov J, et al. Impact of acute kidney injury following liver transplantation on long-term outcomes. Clin Transplant. 2017;31(1):e12863. doi: 10.1111/ctr.12863.
- Zhang Y, Yang D, Liu Z, et al. An explainable supervised machine learning predictor of acute kidney injury after adult deceased donor liver transplantation. J Transl Med. 2021;19(1):321. doi: 10.1186/s12967-021-02990-4.
- Guo D, Wang H, Lai X, et al. Development and validation of a nomogram for predicting acute kidney injury after orthotopic liver transplantation. Ren Fail. 2021;43(1):1588–1600. doi: 10.1080/0886022X.2021.2009863.
- Wyatt CM, Arons RR. The burden of acute renal failure in nonrenal solid organ transplantation. Transplantation. 2004;78(9):1351–1355. doi: 10.1097/01.tp.0000140848.05002.b8.
- Gonwa TA, McBride MA, Anderson K, et al. Continued influence of preoperative renal function on outcome of orthotopic liver transplant (OLTX) in the US: where will MELD lead us? Am J Transplant. 2006;6(11):2651–2659. doi: 10.1111/j.1600-6143.2006.01526.x.
- Zeng J, Li Q, Wu Q, et al. A novel online calculator predicting acute kidney injury after liver transplantation: a retrospective study. Transpl Int. 2023;36:10887. doi: 10.3389/ti.2023.10887.
- Barreto AGC, Daher EF, Junior GBS, et al. Risk factors for acute kidney injury and 30-day mortality after liver transplantation. Ann Hepatol. 2015;14(5):688–694. doi: 10.1016/s1665-2681(19)30763-x.
- de Haan JE, Hoorn EJ, de Geus HRH. Acute kidney injury after liver transplantation: recent insights and future perspectives. Best Pract Res Clin Gastroenterol. 2017;31(2):161–169. doi: 10.1016/j.bpg.2017.03.004.
- Cheng Y, Xue FS, Wan L. Assessing association between intraoperative fluid balance and the risk of acute kidney injury after liver transplantation: methodological issues. Transplantation. 2020;104(10):e303. doi: 10.1097/TP.0000000000003312.
- Alconchel F, Tinguely P, Frola C, et al. Are short-term complications associated with poor allograft and patient survival after liver transplantation? A systematic review of the literature and expert panel recommendations. Clin Transplant. 2022;36(10):e14704. doi: 10.1111/ctr.14704.
- Contreras G, Garces G, Quartin AA, et al. An epidemiologic study of early renal replacement therapy after orthotopic liver transplantation. J Am Soc Nephrol. 2002;13(1):228–233. doi: 10.1681/ASN.V131228.
- Chiu PF, Lin PR, Tsai CC, et al. The impact of acute kidney injury with or without recovery on long-term kidney outcome in patients undergoing living liver transplantation. Nephrol Dial Transplant. 2023;38(8):1817–1822. doi: 10.1093/ndt/gfad005.
- Martucci G, Rossetti M, Li Petri S, et al. Continuous renal replacement therapy after liver transplantation: Peri-Operative associated factors and impact on survival. J Clin Med. 2022;11(13):3803. doi: 10.3390/jcm11133803.
- Tan L, Yang Y, Ma G, et al. Early acute kidney injury after liver transplantation in patients with normal preoperative renal function. Clin Res Hepatol Gastroenterol. 2019;43(4):475–482. doi: 10.1016/j.clinre.2018.07.009.
- Berkowitz RJ, Engoren MC, Mentz G, et al. Intraoperative risk factors of acute kidney injury after liver transplantation. Liver Transpl. 2022;28(7):1207–1223. doi: 10.1002/lt.26417.
- Wadei HM, Lee DD, Croome KP, et al. Early allograft dysfunction after liver transplantation is associated with short- and long-term kidney function impairment. Am J Transplant. 2016;16(3):850–859. doi: 10.1111/ajt.13527.
- Thorgersen EB, Barratt-Due A, Haugaa H, et al. The role of complement in liver injury, regeneration, and transplantation. Hepatology. 2019;70(2):725–736. doi: 10.1002/hep.30508.
- Carrier FM, Chasse M, Sylvestre MP, et al. Effects of intraoperative fluid balance during liver transplantation on postoperative acute kidney injury: an observational cohort study. Transplantation. 2020;104(7):1419–1428. doi: 10.1097/TP.0000000000002998.
- Carrier FM, Sylvestre MP, Massicotte L, et al. Effects of intraoperative hemodynamic management on postoperative acute kidney injury in liver transplantation: an observational cohort study. PLOS One. 2020;15(8):e0237503. doi: 10.1371/journal.pone.0237503.
- He ZL, Zhou JB, Liu ZK, et al. Application of machine learning models for predicting acute kidney injury following donation after cardiac death liver transplantation. Hepatobiliary Pancreat Dis Int. 2021;20(3):222–231. doi: 10.1016/j.hbpd.2021.02.001.
- Xin W, Yi W, Liu H, et al. Early prediction of acute kidney injury after liver transplantation by scoring system and decision tree. Ren Fail. 2021;43(1):1137–1145. doi: 10.1080/0886022X.2021.1945462.
- Pulitano C, Ho P, Verran D, et al. Molecular profiling of postreperfusion milieu determines acute kidney injury after liver transplantation: a prospective study. Liver Transpl. 2018;24(7):922–931. doi: 10.1002/lt.25178.
- Asrani SK, Shankar N, da Graca B, et al. Role of novel kidney biomarkers in patients with cirrhosis and after liver transplantation. Liver Transpl. 2022;28(3):466–482. doi: 10.1002/lt.26344.
- Allen AM, Kim WR, Larson JJ, et al. Serum cystatin C as an indicator of renal function and mortality in liver transplant recipients. Transplantation. 2015;99(7):1431–1435. doi: 10.1097/TP.0000000000000552.
- Levitsky J, Asrani SK, Abecassis M, et al. External validation of a pretransplant biomarker model (REVERSE) predictive of renal recovery after liver transplantation. Hepatology. 2019;70(4):1349–1359. doi: 10.1002/hep.30667.
- Khwaja A. KDIGO clinical practice guidelines for acute kidney injury. Nephron Clin Pract. 2012;120(4):c179–c184. doi: 10.1159/000339789.
- Kellum JA, Lameire N, Group. KAGW. Diagnosis, evaluation, and management of acute kidney injury: a KDIGO summary (part 1). Crit Care. 2013;17(1):204. doi: 10.1186/cc11454.
- Samuel D, Coilly A. Management of patients with liver diseases on the waiting list for transplantation: a major impact to the success of liver transplantation. BMC Med. 2018;16(1):113. doi: 10.1186/s12916-018-1110-y.
- Concato J, Feinstein AR, Holford TR. The risk of determining risk with multivariable models. Ann Intern Med. 1993;118(3):201–210. doi: 10.7326/0003-4819-118-3-199302010-00009.
- De Souza V, Hadj-Aissa A, Dolomanova O, et al. Creatinine- versus cystatine C-based equations in assessing the renal function of candidates for liver transplantation with cirrhosis. Hepatology. 2014;59(4):1522–1531. doi: 10.1002/hep.26886.
- Singapura P, Ma TW, Sarmast N, et al. Estimating glomerular filtration rate in cirrhosis using creatinine-based and cystatin C-based equations: systematic review and meta-analysis. Liver Transpl. 2021;27(11):1538–1552. doi: 10.1002/lt.26216.
- Kalisvaart M, Schlegel A, Umbro I, et al. The impact of combined warm ischemia time on development of acute kidney injury in donation after circulatory death liver transplantation: stay within the golden hour. Transplantation. 2018;102(5):783–793. doi: 10.1097/TP.0000000000002085.
- Zhou J, Lyu L, Zhu L, et al. Association of overweight with postoperative acute kidney injury among patients receiving orthotopic liver transplantation: an observational cohort study. BMC Nephrol. 2020;21(1):223. doi: 10.1186/s12882-020-01871-0.
- Barri YM, Sanchez EQ, Jennings LW, et al. Acute kidney injury following liver transplantation: definition and outcome. Liver Transpl. 2009;15(5):475–483. doi: 10.1002/lt.21682.
- Dong V, Nadim MK, Karvellas CJ. Post–liver transplant acute kidney injury. Liver Transpl. 2021;27(11):1653–1664. doi: 10.1002/lt.26094.
- Kambakamba P, Slankamenac K, Tschuor C, et al. Epidural analgesia and perioperative kidney function after major liver resection. Br J Surg. 2015;102(7):805–812. doi: 10.1002/bjs.9810.
- Sun Y, Gao S, Wang X, et al. Continuous renal replacement therapy in pediatric patients with acute kidney injury after liver transplantation. Front Pediatr. 2022;10:878460. doi: 10.3389/fped.2022.878460.
- Zhang CD, Zeng YJ, Li Z, et al. Extended antimicrobial prophylaxis after gastric cancer surgery: a systematic review and meta-analysis. World J Gastroenterol. 2013;19(13):2104–2109. doi: 10.3748/wjg.v19.i13.2104.
- Zhang J, Rector J, Lin JQ, et al. Nondestructive tissue analysis for ex vivo and in vivo cancer diagnosis using a handheld mass spectrometry system. Sci Transl Med. 2017;9(406):eaan3968. doi: 10.1126/scitranslmed.aan3968.
- Mizota T, Hamada M, Matsukawa S, et al. Relationship between intraoperative hypotension and acute kidney injury after living donor liver transplantation: a retrospective analysis. J Cardiothorac Vasc Anesth. 2017;31(2):582–589. doi: 10.1053/j.jvca.2016.12.002.
- Kalisvaart M, de Haan JE, Hesselink DA, et al. The postreperfusion syndrome is associated with acute kidney injury following donation after brain death liver transplantation. Transpl Int. 2017;30(7):660–669. doi: 10.1111/tri.12891.
- Park MH, Shim HS, Kim WH, et al. Clinical risk scoring models for prediction of acute kidney injury after living donor liver transplantation: a retrospective observational study. PLOS One. 2015;10(8):e0136230. doi: 10.1371/journal.pone.0136230.
- Liu L, Fang C, Fu W, et al. Endothelial cell-derived interleukin-18 released during ischemia reperfusion injury selectively expands T peripheral helper cells to promote alloantibody production. Circulation. 2020;141(6):464–478. doi: 10.1161/CIRCULATIONAHA.119.042501.
- Drolz A, Horvatits T, Roedl K, et al. Outcome and features of acute kidney injury complicating hypoxic hepatitis at the medical intensive care unit. Ann Intensive Care. 2016;6(1):61. doi: 10.1186/s13613-016-0162-4.
- Jaques DA, Spahr L, Berra G, et al. Biomarkers for acute kidney injury in decompensated cirrhosis: a prospective study. Nephrology. 2019;24(2):170–180. doi: 10.1111/nep.13226.
- Hamdy HS, El-Ray A, Salaheldin M, et al. Urinary neutrophil gelatinase-associated lipocalin in cirrhotic patients with acute kidney injury. Ann Hepatol. 2018;17(4):624–630. doi: 10.5604/01.3001.0012.0931.
- Mishra J, Mori K, Ma Q, et al. Amelioration of ischemic acute renal injury by neutrophil gelatinase-associated lipocalin. J Am Soc Nephrol. 2004;15(12):3073–3082. doi: 10.1097/01.ASN.0000145013.44578.45.
- Baron-Stefaniak J, Schiefer J, Miller EJ, et al. Comparison of macrophage migration inhibitory factor and neutrophil gelatinase-associated lipocalin-2 to predict acute kidney injury after liver transplantation: an observational pilot study. PLOS One. 2017;12(8):e0183162. doi: 10.1371/journal.pone.0183162.
- Stefaniak J, Schiefer J, Miller EJ, et al. Macrophage migration inhibitory factor as a potential predictor for requirement of renal replacement therapy after orthotopic liver transplantation. Liver Transpl. 2015;21(5):662–669. doi: 10.1002/lt.24103.
- Jia HM, Zheng Y, Huang LF, et al. Derivation and validation of plasma endostatin for predicting renal recovery from acute kidney injury: a prospective validation study. Crit Care. 2018;22(1):305. doi: 10.1186/s13054-018-2232-5.
- Martensson J, Jonsson N, Glassford NJ, et al. Plasma endostatin may improve acute kidney injury risk prediction in critically ill patients. Ann Intensive Care. 2016;6(1):6. doi: 10.1186/s13613-016-0108-x.
- Wan Z-H, Wang J-J, You S-L, et al. Cystatin C is a biomarker for predicting acute kidney injury in patients with acute-on-chronic liver failure. World J Gastroenterol. 2013;19(48):9432–9438. doi: 10.3748/wjg.v19.i48.9432.
- Jo SK, Yang J, Hwang SM, et al. Role of biomarkers as predictors of acute kidney injury and mortality in decompensated cirrhosis. Sci Rep. 2019;9(1):14508. doi: 10.1038/s41598-019-51053-8.