
Abstract
Background
Intravenous immunoglobulin (IVIG) resistance is of prime importance in Kawasaki disease (KD). In this study, we examined the value and mechanism of serum amyloid A (SAA) level in predicting IVIG resistance in patients with KD.
Methods
SAA levels were measured in 497 consecutive patients with KD before IVIG therapy in the training set. The patients were divided into two groups (IVIG-responsive and IVIG-resistant) according to the American Heart Association (AHA) definition of IVIG resistance. Demographic, echocardiographic, and laboratory data were also retrospectively analyzed and tabulated to predict IVIG resistance. The predictive value of SAA was validated on test sets of prospective data. Cytokine microarrays were analyzed from 4 patients with resistant to IVIG, 4 patients with responsive to IVIG and 4 healthy volunteers.
Results
During the training set, 409 patients with KD were enrolled, of whom 43 (10.5%) were resistant to initial IVIG treatment and 47 (11.49%) had coronary artery lesions (CALs). Serum levels of SAA were higher in the IVIG resistant group compared to the IVIG responsive group, (380.00 [204.40–547.25] vs 230.85 [105.40–490.00] mg/L; p = .008). The values of total bilirubin, C-reactive protein, neutrophils, alanine aminotransferase, aspartate aminotransferase, interleukin-6(IL-6), and procalcitonin were significantly higher in the IVIG-resistant group than in the IVIG-responsive group (p < .05); however, the lymphocytes, platelets, serum sodium levels, and duration of fever before IVIG therapy were significantly lower (p < .05). There was no significant difference in SAA levels between patients with KD with and without CALs. Binary logistic regression analysis showed that SAA (p = .008), neutrophils (p < .001), total bilirubin (p = .001), platelet count (p = .004), and serum sodium level (p = .019) were independent factors influencing IVIG resistance. The optimal cutoff value of SAA for IVIG resistance prediction was 252.45 mg/L, with a corresponding clinical sensitivity of 69.8% and specificity of 54.4%. Based on receiver operating characteristic (ROC) curve analyses, the area under the curve (AUC) of combined detection with these five indicators was 0.800, clinical sensitivity was 69.8%, and specificity was 76.2%. In the prospective data, the sensitivity, specificity, and accuracy of SAA for identifying IVIG resistance KD were 77.8%,69.0%, and 70.0%, respectively. Compared with IVIG- responsive group and healthy children, the levels of IL-6 was upregulated significantly in IVIG-resistant group through cytokine microarrays.
Conclusions
SAA may be a potential biomarker for predicting IVIG responsiveness to KD, Combined detection of SAA levels, total bilirubin, neutrophil count, platelet count, and serum sodium levels is superior to that of any other single indicator for predicting IVIG resistance in KD. And elevated SAA may accompany with IL-6 in KD patients, its use in clinical practice may be helpful for treatment management.
1. Introduction
Kawasaki disease (KD) is an acute, self-limiting vasculitis that predominantly occurs in children younger than five years of age. Intravenous immunoglobulin (IVIG) is the most effective initial treatment. However, approximately 10–20% of patients do not respond to the initial IVIG treatment [Citation1]. These patients are at a high risk of developing coronary artery lesions (CALs) [Citation2], a serious complication, and certain patients with KD are predisposed to sudden death due to thrombotic occlusion [Citation3]. The mechanism of action and development of IVIG resistance have not been fully elucidated [Citation4,Citation5]. It is crucial for KD to predict IVIG resistance early so that patients at risk for CALs can receive early intensive therapy.
There are several scoring systems for predicting IVIG resistance [Citation6,Citation7]. Although these scoring systems are widely applied in Japan, they underperform in other populations [Citation8–11], which may be attributable to ethnicity and other differences. There are also some studies on IVIG resistance prediction models in China; however, these models have low clinical sensitivity and specificity [Citation12]. Some single biomarkers, such as the level of pentraxin-3 (PTX3) [Citation13], procalcitonin [Citation14], soluble CD163 [Citation15], and free carnitine [Citation16] can act as strong and sensitive predictors of IVIG resistance. However, using common laboratory tests and clinical features is not sufficient to predict IVIG resistance [Citation17].
Serum amyloid A (SAA) is a highly conserved acute-phase protein. Similar to C-reactive protein (CRP), SAA can be used as a diagnostic, prognostic, or therapeutic follow-up marker for many diseases [Citation18–20]. Currently, SAA is frequently used as an indicator to monitor inflammation and predict prognosis in clinical practice. SAA is significantly upregulated in acute and chronic inflammatory conditions (such as trauma, infection, and ischemia) in response to elevated levels of interleukin-6 (IL-6) and tumor necrosis factor-α (TNF-α) during the acute-phase response [Citation21]. The clinical course of KD is closely related to excessive activation of the innate immune system and is accompanied by an increase in inflammatory cytokines in the acute phase of KD. Moreover, SAA levels are elevated in Patients with KD with CALs [Citation22].
There has been scant research on the association between SAA levels and IVIG resistance in KD. We hypothesized that SAA could be a useful predictor of IVIG resistance in patients with KD, and that clinicians could routinely use it to make this diagnosis.
2. Methods
2.1. Patient selection
The electronic medical records of Anhui Provincial Children’s Hospital were scrutinized to identify all patients admitted with a first diagnosis of KD from January 2019 to October 2022 in training set. Inclusion criteria were as follows: children hospitalized with complete or incomplete KD based on the American Heart Association (AHA) criteria [Citation1]; IVIG and aspirin were routinely administered in accordance with the guidelines. The exclusion criteria were as follows: non-standardized IVIG treatment; use of corticosteroids or other immunosuppressive drugs before or at the same time as the initial IVIG treatment; the presence of other adverse complications such as macrophage activation syndrome, shock, severe infection, septic lesions, multiorgan dysfunction, hemophagocytic syndrome, and missing hospitalization clinical data. Prospective validation was performed on data collected in our hospital from November 2022 to June 2023. The period of KD patients were treated and studied to test the accuracy of prediction.
This study was conducted in accordance with the Declaration of Helsinki and approved by the Ethics Committee of the Anhui Provincial Children’s Hospital (Approval Number EYLL-2022-020). Informed consent was obtained from all the participants and their parents.
2.2. Treatment protocol, IVIG resistance and coronary artery lesions
All patients in the study were administered IVIG (2 g/kg) as a single dose with aspirin (30–50 mg/kg) as recommended in the guidelines [Citation1]. After defervescence for 48–72 h, a tapered dose of aspirin (3–5 mg/kg/d) was administered for 6–8 wk. If the patients had CALs, aspirin was continued until there was no evidence of lesions. A patient was considered afebrile when body temperature remained below 37.5 °C for more than 24 h. The definition of resistance was defined based on body temperature that did not resolve within 36 h after completion of IVIG infusion. CALs were defined on normalized dimensions for the body surface area as Z scores ≥ 2.5, of coronary arteries on the basis of maximal internal diameters (right coronary artery, left anterior descending artery, or left circumflex coronary artery) or a maximum absolute internal diameter > 3 mm in children < 5 years old, or > 4 mm in children 5 years and older, or segment 1.5 times greater than an adjacent segment [Citation2]. Body surface area and Z-scores were calculated using the Kobayashi equations [Citation23].
2.3. Clinical and laboratory data collection
Data on baseline characteristics and laboratory test results during hospitalization were collected from hospital records. Demographic data included sex, weight, age at KD diagnosis, incomplete KD, and clinical features (rash, conjunctivitis, oral lesions, changes in extremities, and cervical lymphadenopathy). Laboratory test results included white blood cell count, hemoglobin level, neutrophil count, lymphocyte count, platelet count, SAA, CRP, erythrocyte sedimentation rate, serum albumin, aspartate transaminase, alanine aminotransferase, total bilirubin, serum sodium, IL-6, and procalcitonin. All blood samples were collected within 24 h of admission prior to the initial use of IVIG. If multiple laboratory values were available, the value closest to the time of diagnosis and before IVIG administration was recorded. Blood samples were collected in heparin anticoagulant tubes and centrifuged at 1000 g for 5 min to separate the serum. SAA levels were measured using the latex-enhanced immunoturbidimetric method with an automatic biochemical analyzer (Hitachi-7600). The reference value of SAA ranged from 0 to 10.00 mg/L.
2.4. Analysis of cytokine microarrays
Peripheral blood was collected from eight patients with KD, with four patients showing resistance to IVIG treatment and four patients responding positively to IVIG treatment. Control plasma samples were obtained from four healthy volunteers. Five milliliters of venous blood were collected using ethylenediamine tetra acetic acid (EDTA) Na2 as an anticoagulant. A comprehensive range of cytokines was detected using the Human Cytokine Antibody Array Kit (RayBiotech, Norcross, GA, USA), following the manufacturer’s instructions.
2.5. Statistical analysis
Data analysis was performed using SPSS 26.0 (IBM Corp., Armonk, NY, USA). Quantitative data are presented as the median with the 25th and 75th percentiles (interquartile range (IQR)) in square brackets, whereas qualitative data are expressed as n/%. The Shapiro-Wilk test of normality and homogeneity of variance were used to confirm that quantitative data from different groups showed a normal distribution and met the homogeneity of variance. The chi-square test and unpaired Student’s test/Mann-Whitney U test were used to compare demographic characteristics, clinical manifestations, and laboratory data between groups. Crucial indicators from the univariate analysis were then subjected to binary logistic regression analysis to identify independent predictors of IVIG resistance. To compare the efficiency of biomarkers to predict IVIG unresponsiveness, cut-off values based on the maximum value of Youden’s index according to sensitivity and specificity were selected on the basis of a receiver operating characteristic (ROC) curve. Statistical significance was set at p < .05.
3. Results
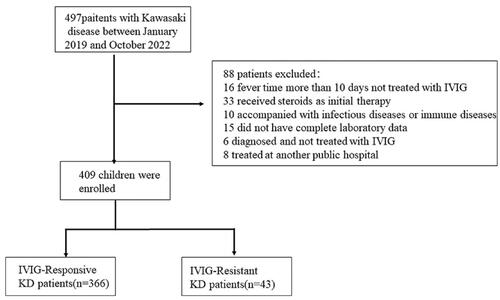
A total of 497 consecutive patients with KD were eligible in the training set, and 88 patients were excluded from the analysis according to the following inclusion and exclusion criteria: those who did not receive IVIG treatment prior to 10 d from fever onset (n = 16), received steroids as initial therapy (n = 33), had infectious diseases or immune diseases (n = 10), did not have complete laboratory data (n = 15), were diagnosed with KD but not treated with IVIG (n = 6), and received IVIG at another hospital (n = 8). The final analysis included 409 patients with KD, 43 (10.5%) of whom showed IVIG resistance ().
Figure 1. Patient inclusion and research Flowchart. A total of 497 consecutive patients with KD were eligible; 88 patients were excluded from analysis based on the inclusion and exclusion criteria.
As indicated in , there was no statistically significant difference between the two groups in terms of age, sex ratio, or body weight. The fever duration prior to initial IVIG treatment was significantly shorter in the IVIG-resistant group than in the IVIG-responsive group (p < .05). Regarding clinical manifestations, there were no significant symptomatic differences in conjunctivitis, cervical lymphadenopathy, rash, edema in the extremities, mucosal changes, and the incidence of CALs between the two groups. The mean interquartile range (IQR) of SAA levels in the IVIG resistant group was significantly higher than that in the IVIG-responsive group (380.00 [204.40–547.25] vs. 230.85 [105.40–490.00] mg/L; p = .008). Significant statistical differences were also found in other parameters including neutrophil count, alanine aminotransferase, aspartate aminotransferase, total bilirubin, lymphocyte count, platelet count, serum sodium, IL-6, and procalcitonin. However, the SAA levels showed no statistically significant differences with or without CALs (p > .05).
Table 1. Baseline and clinical characteristics of KD patients in the two groups.
Twelve significant variables from univariate analysis, that is, SAA, neutrophils, CRP, alanine aminotransferase, aspartate aminotransferase, total bilirubin, lymphocyte count, platelet count, serum sodium, interleukin 6, procalcitonin, and fever duration prior to initial IVIG treatment (p < .05) were included in the multivariate analysis to identify risk factors for IVIG resistance. Higher neutrophil levels, SAA, and total bilirubin, and lower platelet levels and serum sodium remained independent risk factors for IVIG resistance in the multivariate analysis ().
Table 2. Binary logistic regression analyses of risk factors for IVIG-resistance.
ROCs were used to calculate clinical sensitivity and specificity, and SAA exhibited a sensitivity of 69.8% and specificity of 54.4% for predicting IVIG resistance at a cutoff value of 252.45 mg/L. The cutoff value of neutrophils was 9.88 × 10⁹/L, and the sensitivity and specificity for predicting IVIG resistance were 72.1% and 59.0%, respectively. The total bilirubin level had a clinical sensitivity of 48.8% and specificity of 79.5% for predicting IVIG resistance at a cutoff point 10.45 mg/L. A platelet cut-off value of 279.5 × 10¹²/L yielded a clinical sensitivity of 51.2% and a specificity of 73.2% for predicting IVIG resistance. At a cut-off of 136.5 mmol/L, serum sodium level yielded a clinical sensitivity of 81.4% and specificity of 46.4% for predicting IVIG resistance. The combined AUC of these five indicators was 0.800, clinical sensitivity was 69.8%, and specificity was 76.2% (, ).
Figure 2. ROC Curves of five parameters; neutrophil count, platelet count, serum amyloid a levels, serum sodium levels, and total bilirubin in predicting IVIG resistance.
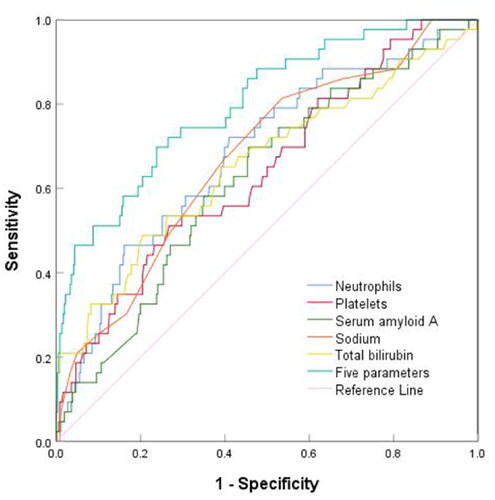
Table 3. Cut-off values for predicting IVIG resistance in KD patients.
We used prospective data to verify the value of SAA in predicting IVIG resistance (). 80 KD patients were enrolled, of whom 9 (11.3%) were resistant to initial IVIG treatment. The predicted diagnosis was compared with the actual KD patients. The sensitivity, specificity, and accuracy of SAA for identifying IVIG resistance KD were 77.8%,69.0%, and 70.0%, respectively.
Table 4. Validation of SAA in prospective set.
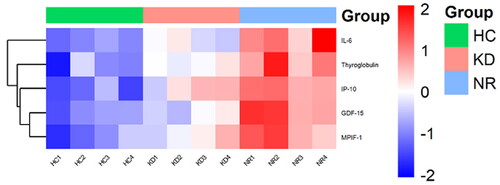
In this study, cytokine microarrays were used to measure the expression levels of five cytokines in 12 samples. The results revealed that these five cytokines, including IL-6, were found to be upregulated in KD-resistant patients compared to both KD-responsive patients and healthy controls. The corresponding heatmap of differentially levels of cytokines is shown in .
Figure 3. A heatmap was Generated from microarray data to visualize the expression values of cytokines. Upregulated cytokines were depicted in red, while downregulated genes were represented in green. The samples included in the heatmap were NR1-4 (IVIG-resistant patients), KD1-4 (IVIG- responsive patients), and HC1-4 (healthy controls).
4. Discussion
IVIG resistance risk scores based on laboratory, echocardiographic, and/or clinical features have limited utility [Citation17]. Nevertheless, several scoring models have been established to predict IVIG resistance in children with an initial KD based on risk factors [Citation6,Citation24]. In general, specific and reliable biomarkers for predicting the treatment response in KD are urgently required. To achieve this, we conducted this study to investigate the predictive value of SAA levels, individually and in combination with other parameters, in KD. Predicting IVIG resistance before initiating therapy can assist pediatricians in selecting effective and beneficial treatments. In this study, the IVIG resistance rate was 10.5% in training data and 11.3% in prospective data, which is consistent with previous reports [Citation1].
Inflammatory responses are closely related to IVIG resistance. In our study, we confirmed significantly higher neutrophil levels in the IVIG-resistant group, consistent with previous findings [Citation6]. The clinical course of KD is closely related to platelet activation [Citation25], and the Kobayashi risk score system uses platelet count to predict IVIG resistance [Citation6]. Although the cause of hyponatremia remains unknown [Citation26], there is a strong negative correlation between serum sodium levels and inflammatory factors, including CRP and IL-6. Hepatic dysfunction is a common complication of acute KD episodes and is characterized by elevated levels of serum liver enzymes and hyperbilirubinemia. Hyperbilirubinemia is caused by hepatocyte lysis and is indicative of an intense inflammatory response [Citation12]. In our study, the higher level of total bilirubin was consistent with a previous study on IVIG resistance in patients with KD [Citation24]. Severe immune-mediated inflammation of blood vessels may cause liver function injury [Citation27].
The pathophysiology of KD is characterized by hyperactivity of the innate immune system, accompanied by an increase in inflammatory cytokines and chemokines [Citation28,Citation29]. Many types of serum proteins, such as CRP and SAA, are elevated during the acute phase of KD [Citation22]. A truncated form of serum amyloid A is elevated in the blood plasma of patients with KD [Citation30]. SAA expression is typically induced in vivo during inflammatory response and has been used as a biomarker of inflammation. Prior investigations into KD have largely focused on the association with other plasma inflammatory markers, such as CRP [Citation31], a biomarker used to identify resistance to IVIG. In the present study, we demonstrated that SAA levels were significantly higher in the peripheral blood of KD patients during the acute phase. Our research revealed that higher SAA levels were independently associated with IVIG resistance; however, the differences in CRP levels were not statistically significant. It was found that the peak times of CRP and SAA levels were not consistent [Citation22], and levels of SAA may increase before CRP and fluctuate more sensitively in the acute phase of KD.
Five variables, including SAA levels, neutrophil count, serum sodium level, platelet count, and total bilirubin level, were selected in the multivariate analysis. Neutrophils, serum sodium, platelets, and total bilirubin have been identified as predictors in a previous study [Citation17]. In our study, the clinical sensitivity and specificity of SAA levels were 0.698 and 0.544, respectively, and the AUC was 0.623. While SAA levels alone were not sufficiently accurate to predict the effect of IVIG, SAA levels combined with neutrophil count, sodium level, platelet count, and total bilirubin level showed higher efficacy in predicting IVIG resistance in KD, with an AUC of 0.800. This ensures that both the missed diagnoses and misdiagnosis rates can be reduced. While the SAA exhibited a higher sensitivity and specificity in the prospective set, with 252.45 mg/L as the optimal cutoff, the prospective study confirmed that the SAA level was a good predictor of IVIG-resistance, suggesting that SAA might have a good generalizability. On the other hand, we can give intensive therapy by SAA level in KD patients, such as who received additional initial therapy with corticosteroid.
SAA plays an active roles in innate immunity, reduced levels of SAA were observed after inhibiting IL-6 [Citation32], In our study, IL-6 levels were elevated in both groups, particularly in the IVIG resistant group. The expression of IL-6 was upregulated during the acute phase in patients with IVIG-resistance, compared with that in IVIG- responsive through Human Cytokine Antibody Array. This was achieved by reducing the production of SAA, a cytokine inducer for which antagonists/inhibitors are already clinically used. SAA-induced inflammation was markedly reduced by a neutralizing antibody against IL-17A in vivo [Citation33]. However, no statistically significant difference in SAA levels was detected with or without CALs, and the individual patients and measurement time may be the reasons for this difference [Citation22]. Hence, our results further confirm the utility of SAA in assessing patients with KD. SAA may accompany with IL-6 in KD patients, But the mechanism by which SAA was significantly increased in patients with KD who were resistant to IVIG remains unknown.
4.1. Study limitations
This study has some potential limitations. First, selection bias may have occurred, as this study was performed at a single institution with retrospective and prospective analysis, which is a lack of external validation. Second, the findings might only be applicable to patients with KD receiving standardized IVIG treatment (2 g/kg) prior to 10 days the onset of fever. In addition, current prediction models are inadequate for distinguishing KD patients with high IVIG resistance [Citation34]. However, when IVIG resistance is observed, second-line treatment with additional anti-inflammatory therapy is essential. Further studies are required to understand the role of SAA in the pathophysiology of KD.
5. Conclusions
According to the findings of our study, SAA level before IVIG infusion is a complementary laboratory marker for IVIG resistance in patients with KD and is not independent of CALs. Therefore, SAA may help identify high-risk IVIG resistance and associate with IL-6 in patients with KD who require additional clinical management.
Authors contributions
Huang XB participated in the design of the study, collected data, did the statistical analysis, and wrote the initial draft report. Zhao S, Liu ZY and Xu YY contributed to the data analysis and revised the report. Deng F contributed the design of the study and reviewed the manuscript, and approved the final manuscript as submitted. All authors have read and approved the submitted version.
Ethical statement
Approval for this study was obtained from the Medical Committee of Anhui Provincial Children’s Hospital (Approval Number EYLL-2022-020), and informed consent was obtained from the parents of each subject. This study was conducted in accordance with the Declaration of Helsinki.
Acknowledgements
We would like to acknowledge the hard and dedicated work of all the staff who implemented the intervention and evaluation components of the study.
Disclosure statement
No potential conflict of interest was reported by the author(s).
Data availability statement
Data used to support the findings of this study are available from the corresponding author upon request.
Additional information
Funding
References
- McCrindle BW, Rowley AH, Newburger JW, et al. Diagnosis, treatment, and Long-Term management of Kawasaki disease: a scientific statement for health professionals from the American heart association. Circulation. 2017;135(17):1–8. doi: 10.1161/CIR.0000000000000484.
- Fukazawa R, Kobayashi J, Ayusawa M, et al. JCS/JSCS 2020 guideline on diagnosis and management of cardiovascular sequelae in Kawasaki disease. Circ J. 2020;84(8):1348–1407. doi: 10.1253/circj.CJ-19-1094.
- Noval Rivas M, Arditi M. Kawasaki disease: pathophysiology and insights from mouse models. Nat Rev Rheumatol. 2020;16(7):391–405. doi: 10.1038/s41584-020-0426-0.
- Gorelik M, Chung SA, Ardalan K, et al. 2021 American college of rheumatology/vasculitis foundation guideline for the management of Kawasaki disease. Arthritis Care Res (Hoboken). 2022;74(4):538–548. doi: 10.1002/acr.24838.
- Hsieh LE, Song J, Tremoulet AH, et al. Intravenous immunoglobulin induces IgG internalization by tolerogenic myeloid dendritic cells that secrete IL-10 and expand Fc-specific regulatory T cells. Clin Exp Immunol. 2022;208(3):361–371. doi: 10.1093/cei/uxac046.
- Kobayashi T, Inoue Y, Takeuchi K, et al. Prediction of intravenous immunoglobulin unresponsiveness in patients with Kawasaki disease. Circulation. 2006;113(22):2606–2612. doi: 10.1161/CIRCULATIONAHA.105.592865.
- Sano T, Kurotobi S, Matsuzaki K, et al. Prediction of non-responsiveness to standard high-dose gamma-globulin therapy in patients with acute Kawasaki disease before starting initial treatment. Eur J Pediatr. 2007;166(2):131–137. doi: 10.1007/s00431-006-0223-z.
- Kaya Akca U, Arslanoglu Aydin E, Aykan HH, et al. Comparison of IVIG resistance predictive models in Kawasaki disease. Pediatr Res. 2022;91(3):621–626. doi: 10.1038/s41390-021-01459-w.
- Jakob A, von Kries R, Horstmann J, et al. Failure to predict high-risk Kawasaki disease patients in a population-based study cohort in Germany. Pediatr Infect Dis J. 2018;37(9):850–855. doi: 10.1097/INF.0000000000001923.
- Davies S, Sutton N, Blackstock S, et al. Predicting IVIG resistance in UK Kawasaki disease. Arch Dis Child. 2015;100(4):366–368. doi: 10.1136/archdischild-2014-307397.
- Piram M, Darce Bello M, Tellier S, et al. Defining the risk of first intravenous immunoglobulin unresponsiveness in non-Asian patients with Kawasaki disease. Sci Rep. 2020;10(1):3125. doi: 10.1038/s41598-020-59972-7.
- Liu J, Ye B, Su D, et al. Evaluation of laboratory predictors for intravenous immunoglobulin resistance and coronary artery aneurysm in Kawasaki disease before and after therapy. Clin Rheumatol. 2023;42(1):167–177. doi: 10.1007/s10067-022-06366-x.
- Kitoh T, Ohara T, Muto T, et al. Increased pentraxin 3 levels correlate with IVIG responsiveness and coronary artery aneurysm formation in Kawasaki disease. Front Immunol. 2021;12:624802. doi: 10.3389/fimmu.2021.624802.
- Nakamura N, Muto T, Masuda Y, et al. Procalcitonin as a biomarker of unresponsiveness to intravenous immunoglobulin for Kawasaki disease. Pediatr Infect Dis J. 2020;39(9):857–861. doi: 10.1097/INF.0000000000002716.
- Azuma Y, Suzuki Y, Okada S, et al. Utility of soluble CD163 in the clinical management of patients with Kawasaki disease. Front Pediatr. 2020;8:148. doi: 10.3389/fped.2020.00148.
- Muto T, Nakamura N, Masuda Y, et al. Serum free carnitine levels in children with Kawasaki disease. Pediatr Int. 2022;64(1):e14849. doi: 10.1111/ped.14849.
- Lam JY, Song MS, Kim GB, et al. Intravenous immunoglobulin resistance in kawasaki disease patients: prediction using clinical data. Pediatr Res. 2023;16:1–6. doi: 10.1038/s41390-023-02519-z.
- Abdelhakam DA, Badr FM, Abd El Monem Teama M, et al. Serum amyloid A, ferritin and carcinoembryonic antigen as biomarkers of severity in patients with COVID-19. Biomed Rep. 2022;16(2):13. doi: 10.3892/br.2021.1496.
- Hong L, Herjan T, Bulek K, et al. Mechanisms of corticosteroid resistance in type 17 asthma. J Immunol. 2022;209(10):1860–1869. doi: 10.4049/jimmunol.2200288.
- Shridas P, Patrick AC, Tannock LR. Role of serum amyloid a in abdominal aortic aneurysm and related cardiovascular diseases. Biomolecules. 2021;11(12):1883. doi: 10.3390/biom11121883.
- Bang YJ, Hu Z, Li Y, et al. Serum amyloid a delivers retinol to intestinal myeloid cells to promote adaptive immunity. Science. 2021;373(6561):eabf9232. doi: 10.1126/science.abf9232.
- Mitani Y, Sawada H, Hayakawa H, et al. Elevated levels of high-sensitivity C-reactive protein and serum amyloid-A late after Kawasaki disease: association between inflammation and late coronary sequelae in Kawasaki disease. Circulation. 2005;111(1):38–43. doi: 10.1161/01.CIR.0000151311.38708.29.
- Kobayashi T, Fuse S, Sakamoto N, et al. A new Z score curve of the coronary arterial internal diameter using the Lambda-Mu-Sigma method in a pediatric population. J Am Soc Echocardiogr. 2016;29(8):794–801.e29. doi: 10.1016/j.echo.2016.03.017.
- Li C, Wu S, Shi Y, et al. Establishment and validation of a multivariate predictive scoring model for intravenous immunoglobulin-resistant Kawasaki disease: a study of children from two centers in China. Front Cardiovasc Med. 2022;9:883067. doi: 10.3389/fcvm.2022.883067.
- Zheng X, Wu W, Zhang Y, et al. Changes in and significance of platelet function and parameters in Kawasaki disease. Sci Rep. 2019;9(1):17641. doi: 10.1038/s41598-019-54113-1.
- Wu S, Long Y, Chen S, et al. A new scoring system for prediction of intravenous immunoglobulin resistance of Kawasaki disease in infants under 1-year old. Front Pediatr. 2019;7:514. doi: 10.3389/fped.2019.00514.
- Cheng F, Kang L, Zhang F, et al. Analysis of hyperbilirubinemia in patients with Kawasaki disease. Medicine. 2020;99(36):e21974. doi: 10.1097/MD.0000000000021974.
- Hara T, Nakashima Y, Sakai Y, et al. Kawasaki disease: a matter of innate immunity. Clin Exp Immunol. 2016;186(2):134–143. doi: 10.1111/cei.12832.
- Ghosh P, Katkar GD, Shimizu C, et al. An artificial intelligence-guided signature reveals the shared host immune response in MIS-C and Kawasaki disease. Nat Commun. 2022;13(1):2687. doi: 10.1038/s41467-022-30357-w.
- Whitin JC, Yu TT, Ling XB, et al. A novel truncated form of serum amyloid a in kawasaki disease. PLOS One. 2016;11(6):e0157024. doi: 10.1371/journal.pone.0157024.
- Nandi A, Pal P, Basu S. A comparison of serum IL6 and CRP levels with respect to coronary changes and treatment response in Kawasaki disease patients: a prospective study. Rheumatol Int. 2019;39(10):1797–1801. doi: 10.1007/s00296-019-04375-9.
- Porritt RA, Chase Huizar C, Dick EJ, et al. Inhibition of IL-6 in the LCWE mouse model of Kawasaki disease inhibits acute phase reactant serum amyloid a but fails to attenuate vasculitis. Front Immunol. 2021;12:630196. doi: 10.3389/fimmu.2021.630196.
- Anthony D, Seow HJ, Uddin M, et al. Serum amyloid a promotes lung neutrophilia by increasing IL-17A levels in the mucosa and γδ T cells. Am J Respir Crit Care Med. 2013;188(2):179–186. doi: 10.1164/rccm.201211-2139OC.
- Kuniyoshi Y, Tsujimoto Y, Banno M, et al. Prediction models for intravenous immunoglobulin resistance in Kawasaki disease: a meta-analysis. Pediatrics. 2023;151(5):e2022059175. doi: 10.1542/peds.2022-059175.