
 ?Mathematical formulae have been encoded as MathML and are displayed in this HTML version using MathJax in order to improve their display. Uncheck the box to turn MathJax off. This feature requires Javascript. Click on a formula to zoom.
Abstract
Background
Adult glioma progresses rapidly and has a poor clinical outcome. The focal adhesion protein Kindlin-3 (encoded by the FERMT3 gene) participates in tumor development, drug resistance, and progression. However, the relationship between Kindlin-3 and glioma prognosis or immune microenvironment is poorly understood.
Methods
We comprehensively analyzed the expression, prognostic value, mutation landscape, functional enrichment, immune infiltration, and therapeutic role of FERMT3 in glioma using multiple datasets and validated Kindlin-3 expression in clinical tissue specimens by immunohistochemistry and multiple immunofluorescence staining.
Results
FERMT3 is an independent predictor of glioma prognosis and is highly expressed in glioblastoma tissues. Functional enrichment analyses indicated that FERMT3 participates in multiple immune-related pathways such as immune response and cytokine production. Furthermore, FERMT3 expression was positively correlated with the infiltration of several immune cells, immune scores, and the expression of genes related to immune checkpoints. Further analyses revealed that overexpression of FERMT3 was linked to a better response to anti-PD1 therapy. Data from single-cell RNA-seq reveal that FERMT3 was largely expressed in microglial cells and tissue-resident macrophages. Multiple immunofluorescence staining confirmed the overexpression of Kindlin-3 in the glioma-associated microglia/macrophages (GAMs).
Conclusion
The findings of this study provide a new perspective on the role of Kindlin-3 in glioma and may have a significant impact on the discovery of novel biomarkers and targeting of GAMs in the future.
1. Introduction
Adult glioma has an extremely poor prognosis and is characterized by infiltrative growth, heterogeneity, and refractory. Almost half of all central nervous system (CNS) cancers are glioblastoma (GBM), which accounts for 49.1% of all cases [Citation1]. The global glioma burden is projected to parallel the increase in the elderly population. It is noteworthy that gliomas comprised 78.2% of all malignant CNS tumors in older adults (65+) [Citation1]. Unfortunately, there is no effective therapy for glioma. Consequently, it is necessary to uncover efficient therapeutic targets for glioma treatment.
The Kindlins family of proteins contains a 4.1-ezrin-radixin-moesin (FERM) domain and comprises FERMT1 (Kindlin-1), FERMT2 (Kindlin-2), and FERMT3 (Kindlin-3). As focal adhesion proteins, Kindlins regulate integrin activation, which plays a role in many important cellular physiological processes such as cell adhesion, migration, proliferation, and differentiation [Citation2]. Recent studies have shown that Kindlins are crucial signaling molecules that participate in the occurrence and development of tumors through multiple signaling pathways independent of integrin binding, such as the wnt, transforming growth factor β (TGFβ), epidermal growth factor receptor (EGFR), hedgehog, and extracellular regulated protein kinases (ERK) signaling pathways [Citation3]. Several studies have suggested that the Kindlins family of proteins potentially promotes or suppresses tumors, depending on the type of cancer. For example, Kindlin-1, -2, and -3 participate in the progression of breast cancer [Citation4–6]. Kindlin-1 and Kindlin-2 play opposite roles in lung cancer [Citation7]. Kindlin-2 can promote colon cancer progression [Citation8], whereas Kindlin-3 exerts the opposite effect [Citation9]. The contradicting roles of the Kindlins family of proteins in tumors reflect how poorly their roles are understood.
Previous studies have demonstrated that both Kindlin-2 and Kindlin-3 contribute to glioma drug resistance. Kindlin-2 strongly weakens the antitumor efficacy of cisplatin on human glioma cells in vitro through the Akt/JNK and Akt/p38 signaling pathways [Citation10]. Furthermore, Kindlin-3 activates the integrin in high-grade glioma, enhancing cell survival and drug resistance [Citation11]. However, these studies did not investigate the relationship between Kindlins family gene expression and glioma prognosis or immune microenvironment.
In this study, we focused on the role of FERMT3 in glioma and analyzed its effect on prognosis, gene mutation, functional pathway, and immune microenvironment using multiple datasets. We also assessed the immunotherapy response of FERMT3 expression, as well as potential small molecular compounds. Finally, FERMT3 expression in clinical glioma specimens and glioma-associated microglia/macrophages (GAMs) was validated. This study uncovered new therapeutic targets for glioma treatment.
2. Materials and methods
2.1. FERMTs family expression and survival analysis in glioma by online databases
The GEPIA database (http://gepia.cancer-pku.cn/) [Citation12] was used to analyze the differential expression of FERMTs in normal tissues and gliomas. Differential expression analysis of FERMTs proteins in normal and GBM was conducted using the CPTAC dataset in UALCAN (http://ualcan.path.uab.edu) [Citation13]. TCGA-GBM and lower-grade glioma (GBMLGG) data was used for survival analysis in the Sangerbox platform (http://vip.sangerbox.com/) [Citation14], which excluded data for individuals with fewer than 30 d of survival. Each expression value was transformed using log2(x + 1). The optimal cut-off value was calculated using the R software package maxstat (version: 0.7-25), which divided patients into two groups. The Kaplan–Meier (K-M) survival curve was plotted. A further analysis using data in the Chinese Glioma Genome Atlas (CGGA, http://www.cgga.org.cn/) database [Citation15] and GlioVis data portal (http://gliovis.bioinfo.cnio.es/) [Citation16] was used to confirm the impact of FERMT3 gene expression on OS of glioma patients. The mRNAseq_325 (CGGA325) and mRNAseq_693 (CGGA693) datasets were selected in CGGA to analyze the OS of all WHO-grade primary glioma specimens. The Rembrandt and Gravendeel datasets were selected in GlioVis to analyze OS.
2.2. Analysis of the relationship between FERMT3 and clinicopathological characteristics and prognosis in glioma
The RNA-seq dataset and corresponding clinical data were downloaded from CGGA (including mRNAseq_325, and TCGA RNAseq). Based on the available glioma data, the relationship between FERMT3 expression and patient clinical parameters, such as WHO grade, isocitrate dehydrogenase (IDH) status, 1p/19q codeletion status, and age, was explored by the ‘ggplot2’ R package or Hiplot Pro (https://hiplot.com.cn/) [Citation17]. In addition, the expression of FERMT3 in different subtypes (including classical, mesenchymal, and proneural) was analyzed using multiple datasets in GlioVis. Multivariate Cox regression analyses were performed to evaluate the independent predictive value of the FERMT3 gene for glioma prognosis. Receiver operating characteristic (ROC) analysis was performed to compare the diagnostic performances by using ‘ROC curve’ tools in Hiplot Pro.
2.3. Mutation and functional enrichment analyses
cBioPortal (https://www.cbioportal.org/) [Citation18] was used to examine the genetic alteration of the FERMT3 gene in glioma. CAMOIP (https://www.camoip.net/) [Citation19] was used to analyze the gene mutation landscape in the high and low FERMT3 expression groups within the TCGA-LGG and TCGA-GBM datasets. In addition, the pathway enrichment for the FERMT3 gene was performed in CAMOIP. The top 20 enrichment Gene Ontology (GO)-biological process (BP), GO-cellular component (CC), GO-molecular function (MF), Reactome, and Kyoto Encyclopedia of Genes and Genomes (KEGG) results were visualized by Ridge-Plot.
2.4. Correlation analyses of FERMT3 expression with immune-related genes, immune cell infiltration, and immune score
The correlation between FERMT3 gene expression in pan-cancer with infiltration of lymphocytes and the expression of major histocompatibility complex (MHC) molecule, immunoinhibitory and immunostimulatory molecules, chemokines, and chemokine receptors were analyzed using data in the TISIDB database (http://cis.Hku.hk/TISIDB/) [Citation20]. Analyses on the correlation of FERMT3 gene expression with tumor purity and infiltration of immune cells in TCGA-LGG and TCGA-GBM datasets were performed using the TIMER database (https://cistrome.shinyapps.io/timer/) [Citation21]. The single-sample gene set enrichment analysis (ssGSEA) was performed to evaluate the extent of immune infiltration in gliomas which is based on the 29 immune-associated gene sets by the “GSVA” R package [Citation22]. Simultaneously, the tumor purity and immune score were evaluated by the “ESTIMATE” software package [Citation23]. The correlation between FERMT3 gene expression and the representative immune checkpoint genes (including LAG3, HAVCR2, CD274, CD276, CD80, PDCD1, PDCD1LG2, IDO1, TIGIT, CTLA4, and CEACAM1) was also visualized using a heatmap. The correlations between the expression of microglia markers (including TMEM119, GPR34, OLFML3, and SLC2A5), macrophage markers (including S100A8, S100A9, ANXA1, and CD14), microglia and macrophage shared markers (including CD163, AIF1, CD68, and ITGAM) [Citation24–26], and microglia/macrophage associated transcription factor PU.1 (Encoded by SPI1) [Citation27,Citation28] were also analyzed.
2.5. Immunotherapy and drug sensitivity analysis
TISMO database (http://tismo.cistrome.org) [Citation29] contains data for gene expression before and after immune checkpoint inhibitor treatment in mice. The expression of FERMT3 after antiPD1, antiPDL1, and antiCTLA4 treatment was analyzed using data from the TISMO database. In addition, the relationship between FERMT3 expression and response to immune checkpoint inhibitors was predicted by the Submap (https://cloud.genepattern.org/gp) algorithm [Citation30] as previously described [Citation31]. The association between Kindlins family gene expression and drug sensitivity was analyzed using the GSCA database (http://bioinfo.life.hust.edu.cn/GSCA/#/) [Citation32].
2.6. Single-cell expression analysis
CHARTS (https://charts.morgridge.org/) [Citation33] is a web application for exploring single-cell RNA-seq data from publicly available human tumor types. The four 10X genomics-based single-cell sequencing GBM cases [Citation34] in the CHARTS database and the uniform manifold approximation and projection (UMAP) dimensionality reduction method were used to analyze predicted cell type composition, malignancy score, FERMT3 expression and inflammation (CancerSEA Gene Set Score).
2.7. Immunohistochemistry and immunofluorescence staining
Three LGG and seven GBM specimens obtained from August 2022 to March 2023 at the First Affiliated Hospital of Hainan Medical University were used for analyzing Kindlin-3 expression in glioma tissues. Glioma diagnosis was performed by pathological analysis of tissue specimens. Kindlin-3 (Ab173416, 1:600) staining was performed on 5 µm thick paraffin-embedded tumor tissue sections using the Envision Labeled Peroxidase System immunohistochemical staining method. Secondary antibody and diaminobenzidine color development were performed using the Dako REAL™ EnVision™ detection system. Scanned images of stained sections were captured using the digital pathology slide scanner (KFBIO KF-PRO-120). Integrated optical density was calculated using the Image-Pro Plus software (version 6). GraphPad Prism (version 9.0) was used for plotting and statistical analysis.
Multiplex immunofluorescence using tyramide signal amplification assays was performed to investigate whether Kindlin-3 is expressed in GAMs. IBA1 (ab178846, 1:1000) and TMEM119 (27585-1-AP, 1:400) were used to mark the pan-myeloid cells and microglia, respectively. Goat anti-mouse/rabbit IgG H&L(HRP) antibodies (ab6789/ab205718, 1:2000) were used as secondary antibodies. Try-cy3, Try-488, and Try-cy5 reagents were purchased from Runnerbio Biotech. Comp. (Shanghai, China). The order of staining was TMEM119-Try-cy3, Kindlin3-Try-488, and IBA1-Try-cy5. Scanned images of the stained sections were captured using the digital scanner microscope Panoramic MIDI (3DHISTECH).
2.8. Statistical analysis
Wilcoxon rank sum test or Student’s test was used for comparing differences between groups. Kruskal–Wallis test was used for analyzing differences among three groups and Bonferroni-Dunn’s test was used for multiple hypothesis tests. The Chi-square test was used to assess the relationship between FERMT3 expression and clinically relevant pathological traits. K-M plot and log-rank test were used to analyze the survival rates of glioma patients. Univariate and multivariate Cox regression analyses were performed to identify independent risk factors for glioma prognosis. The Delong test was used to compare the area under the ROC curves (AUC). Spearman’s test was adopted for correlation analyses. Statistical analyses and visualization were performed using R software (Version 4.0.3), GraphPad Prism 9, or online databases. p < 0.05 was considered statistically significant.
3. Results
3.1. Expression and prognostic value of FERMTs family in glioma
To explore the different expressions of the FERMTs family in normal and glioma tissues, analysis in GEPIA showed that the expression of the FERMT1 was high in LGG, while FERMT2 and FERMT3 were highly expressed in LGG and GBM (Figure S1(A-C)). The CPTAC dataset in the UALCAN database was used to analyze further the expression of the FERMTs proteins in normal tissues and GBM. The results showed that the FERMTs protein was over-expressed in GBM (Figure S1(D-F)).
Given that FERMTs family genes and proteins expression were significantly upregulated in glioma. The predictive value of the FERMTs for glioma prognosis was analyzed by the K-M survival curve. The results showed that high expression of FERMT1 had a favorable prognosis (Figure S2), whereas high expression of FERMT2 was linked to a poor prognosis (Figure S3). The high expression of FERMT3 indicates poor prognosis for the OS, disease-specific survival, and progression-free interval of patients with glioma (Figure S4). These results suggest that FERMT3 may participate in glioma progression. We further validated the effect of FERMT3 on the OS of glioma using CGGA and GlioVis databases. The results showed that glioma prognosis was poor in the FERMT3 high expression group (CGGA325, CGGA693, Rembrandt, and Gravendeel datasets) (Figure S5). The above results suggest that glioma patients with high expression of FERMT3 have a poorer prognosis. Therefore, further analyses focused on the role of FERMT3 in glioma.
3.2. The relationship between FERMT3 expression and clinicopathological characteristics of glioma
The relationships between FERMT3 expression and the clinical parameters of patients were analyzed using the TCGA-GBMLGG and CGGA325 datasets. The results show that high expression of FERMT3 was strongly related to the WHO grade (p < 0.001), IDH mutation status (p < 0.001), 1p/19q codeletion status (p < 0.001), O-6-methylguanine-DNA methyltransferase promoter (MGMTp) methylation status (p = 0.003) and age (p < 0.001) in CGGA325 (). Further analysis in TCGA-GBMLGG revealed that FERMT3 expression was strongly related to the WHO glioma grade (p < .001), IDH mutation (p < 0.001), and 1p/19q codeletion (p < 0.001), and age (p = 0.001) (Supplementary Table 1). Meanwhile, FERMT3 was highly expressed in the WHO IV group, IDH wildtype group (WHO III and IV), 1p/19q non-codeletion group, and MGMTp un-methylation group (WHO IV) in CGGA325 dataset (). Similarly, analysis of the TCGA-GBMLGG dataset revealed that FERMT3 was over-expressed in the WHO IV group, IDH wildtype group, and 1p/19q non-codeletion group (Figure S6). Analysis of multiple datasets in GlioVis showed that FERMT3 expression was higher in the mesenchymal group than in the proneural and classical groups (Figure S7). Delong test demonstrated that FERMT3 outperformed gender, age, IDH mutation status, and MGMTp methylation status to predict survival outcome significantly (p < 0.001, = 0.0300, = 0.0467, and < 0.001, respectively) in CGGA325 dataset and only outperformed gender (p < 0.001) in TCGA-GBMLGG dataset (Figure S8). To determine the expression of Kindlin-3 in glioma, we performed immunohistochemical staining using clinical tissue specimens. The results showed that Kindlin-3 was over-expressed more in the GBM group than in the LGG group (). These results indicate that FERMT3 expression is closely related to the clinicopathological features.
Figure 1. The relationship between FERMT3 expression and clinicopathological characteristics in CGGA325 cohort and clinical tissue specimens. (A) WHO grade. (B) PRS type. (C) Gender. (D) Isocitrate dehydrogenase (IDH) status. (E) 1p/19q status. (F) MGMTp methylation status. (G-I) Immunohistochemistry staining images for Kindlin-3 in clinical LGG (n = 3) and GBM (n = 7) tissues. Scale bars = 100µm, (G) LGG, (H) GBM, (I) Statistical analysis. ns, no significant, * p < 0.05. ** p < 0.01, *** p < 0.001. **** p < 0.0001.
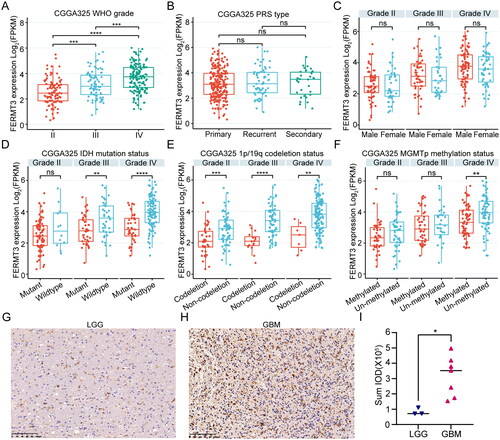
Table 1. Characteristics of patients between low and high FERMT3 expression in CGGA325 cohort.
3.3. FERMT3 is an independent predictor of glioma prognosis
We conducted further investigations to assess the potential of FERMT3 as an independent prognostic indicator. Univariate and multivariate Cox regression analyses revealed that WHO grade, 1p/19q codeletion status and FERMT3 expression independently predicted glioma OS prognosis in CGGA325 (). Analysis of the TCGA-GBMLGG dataset also showed that FERMT3 expression independently predicted primary glioma prognosis (Supplementary Table 2).
Table 2. Univariate and multivariate analyses of overall survival in patients of CGGA325 cohort.
3.4. Mutation and potential function analysis of FERMT3
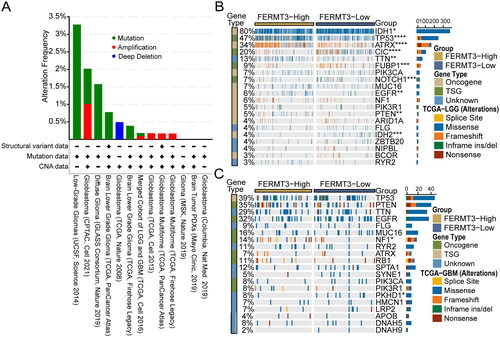
Genomic alteration analysis revealed that FERMT3 alterations were not universal across gliomas, and the most frequently altered dataset was Low-Grade Gliomas (UCSF, Science 2014), not exceeding 3.5% of patients and was mostly mutation (). To explore the mutational landscape of different FERMT3 expression groups, we visualized the top 20 mutated genes in TCGA-LGG and TCGA-GBM datasets using the CAMOIP database. Among them, the mutation frequencies of IDH1, TP53, ATRX, CIC, TTN, FUBP1, NOTCH1, EGFR, PTEN, and IDH2 genes in the TCGA-LGG and NF1 and PKHD1 genes in the TCGA-GBM were significantly different in the high and low FERMT3 expression groups ().
Figure 2. Genomic alteration analysis of FERMT3 and different Genomic profiles associated with FERMT3 expression. (A) Genomic alteration analysis of FERMT3 in cBioPortal database. (B,C) Distinct somatic mutations were found in TCGA-LGG and TCGA-GBM with low and high FERMT3 expression from the CAMOIP database.
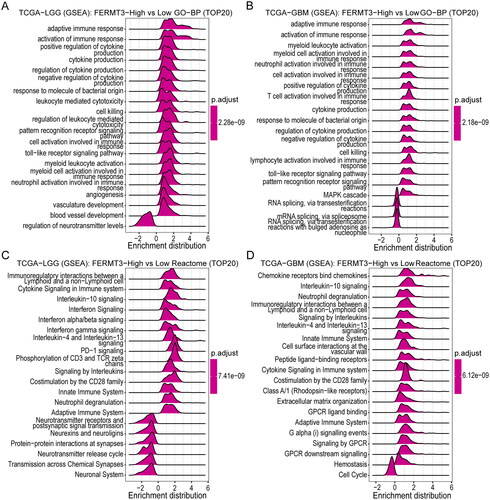
To further analyze the potential function of FERMT3 in glioma, we analyzed the top 20 enriched GO-BP, GO-CC, GO-MF, Reactome, and KEGG terms using the GSEA enrichment method in the CAMOIP database. The results showed that the main involved GO-BP terms included immune response and cytokine production (); the main involved GO-CC terms included immunoglobulin complex and external side of plasma membrane (Figure S9(A,B)); the main involved GO-MF terms included antigen binding, immunoglobulin receptor binding, and cytokine receptor binding (Figure S9(C,D)); the main involved Reactome terms involved immunoregulatory interactions between a lymphoid and a non-lymphoid cell, cytokine signaling in immune system, chemokine receptors bind chemokines and interleukin-10 signaling (); and the main involved KEGG terms involved cytokine-cytokine receptor interaction and NF − kappa B signaling pathway (Figure S9(E,F)). Functional enrichment analysis revealed that FERMT3 in glioma was closely associated with several related immune pathways.
Figure 3. Functional enrichment analysis. (A,B) Ridge-Plot showing top 20 GO-BP terms in TCGA-LGG and TCGA-GBM. (C,D) Ridge-Plot showing top 20 Reactome pathway terms in TCGA-LGG and TCGA-GBM.
3.5. Immune characteristics of FERMT3 in the tumor immune microenvironment (TIME)
To assess the potential role of FERMT3 in TIME, we explored the relationship between FERMT3 expression and the infiltration of immune cells, expression of immune-related genes, and immune scores. Analysis of data in the TISIDB database revealed a positive correlation between FERMT3 expression and infiltration of several lymphocyte subtypes, such as macrophage, MDSC, and Treg (Figure S10(A)). In addition, there was a strong positive correlation between the expression of MHC molecules (HLA-DMA, HLA-DMB, HLA-DPA1, HLA-DOA, HLA-DPA1, HLA-DPB1, HLA-DRA, and HLA-DRB) (Figure S10(B)), immunoinhibitors (CSF1R, CTLA4, HAVCR2, IDO1, IL10, LGALS9, PDCD1, PDCD1LG2, and TIGIT) (Figure S10(C)), immunostimulators (CD27, CD48, and CD86) (Figure S10(D)), chemokines (CCL2, CCL3, CCL4, and CCL5) (Figure S10(E)), chemokine receptors (CCR1, CCR2, CCR5, CXCR3, and CXCR6) (Figure S10(F)). TIMER database analysis showed that FERMT3 gene expression negatively correlated with tumor purity but positively correlated with the infiltration of B cell (R = 0.6), CD4+ T cell (R = 0.873), macrophage (R = 0.797), neutrophil (R = 0.786), and dendritic cell (R = 0.845) in LGG. Analysis of the GBM dataset revealed that FERMT3 expression negatively correlated with tumor purity and infiltration of CD8+ T cells (R = −0.468) but positively correlated with infiltration of CD4+ T cells (R = 0.366), neutrophils (R = 0.369), and dendritic cells (R = 0.451) (Figure S11).
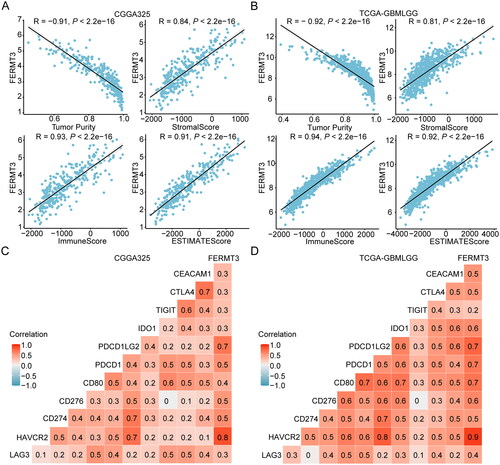
The relationship between FERMT3 gene expression and diverse immune cell types, functions, and pathways was analyzed using the ssGSEA algorithm. The results showed that the factors with Spearman’s correlation coefficient greater than 0.5 were checkpoint, T cell co-inhibition, tumor-infiltrating lymphocytes, T helper cells, cytokine and cytokine receptor, APC co-inhibition, macrophages, plasmacytoid dendritic cells, human leukocyte antigen, parainflammation, APC co-stimulation, T cell co-stimulation, inflammation-promoting, regulatory T cells, MHC class I, and cytolytic activity both in the TCGA-GBMLGG and CGGA325 (Figure S12). ESTIMATE algorithm analysis results showed a positive correlation between FERMT3 expression and stromalScore, immuneScore, and ESTIMATEScore for both CGGA325 and TCGA-GBMLGG (). Meanwhile, the correlation HAVCR2, CD274, CD276, PDCD1, and PDCD1LG2 and FERMT3 gene expression was greater than 0.5 (). These results showed that FERMT3 expression was most positively correlated with several immune-related indicators.
Figure 4. Correlation between FERMT3 and immune characteristics in glioma. (A,B) Correlation between FERMT3 expression and stromalScore, immuneScore, and ESTIMATEScore in CGGA325 and TCGA-GBMLGG. (C,D) Correlation between FERMT3 expression and immune checkpoint genes in CGGA325 and TCGA-GBMLGG.
3.6. Expression of FERMT3 is related to immune checkpoint inhibitors and sensitivity to chemotherapy
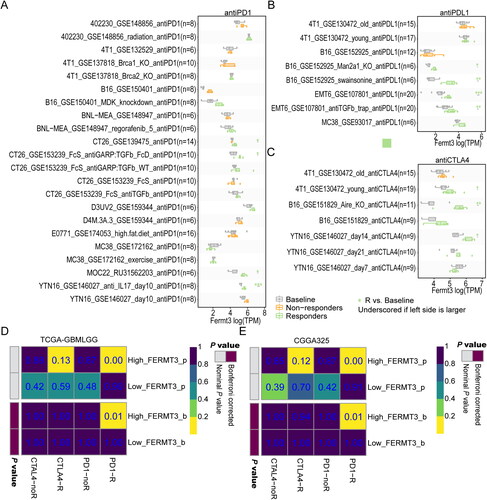
Since FERMT3 was closely associated with the TIME, we further assessed its relationship with immunotherapy response. We analyzed the relationship between Fermt3 gene expression in mice before and after antiPD1, antiPDL1, and anti-CTLA4 treatment based on data in the TISMO database. The results showed that FERMT3 expression was higher in the immunotherapy-responsive group compared to baseline expression in several studies (). The Submap algorithm predicted the relationship between FERMT3 expression and immunotherapy response. We found that high expression of FERMT3 predicted a positive response to anti-PD1 treatment (). To further investigate the correlation between FERMT3 expression and small molecule drugs, the results of GSCA database analysis showed that its expression was negatively correlated with multiple drugs, including several histone deacetylases inhibitors (HDACi), such as apicidin, entinostat, panobinostat, tacedinaline, and vorinostat in GDSC (Figure S13(A)) and AR − 42, CAY10603, Tubastatin A, and Vorinostat in CTRP (Figure S13(B)). The above results suggest that FERMT3 is closely associated with treatment response in glioma.
Figure 5. FERMT3 Might have a significant effect on the efficacy of glioma immunotherapy. Differences Fermt3 gene expression in mice before and after antiPD1 (A), antiPDL1 (B), and anti-CTLA4 (C) treatment or with and without response groups in the TISMO database. (D,E) Predicting response to immunotherapy (anti-PD1 and anti-CTLA4) in low and high-FERMT3 expression groups based on the Submap algorithms in CGGA325 and TCGA-GBMLGG.
3.7. Single-cell RNA-seq data and multiplex immunofluorescence reveal the expression of FERMT3 in TIME
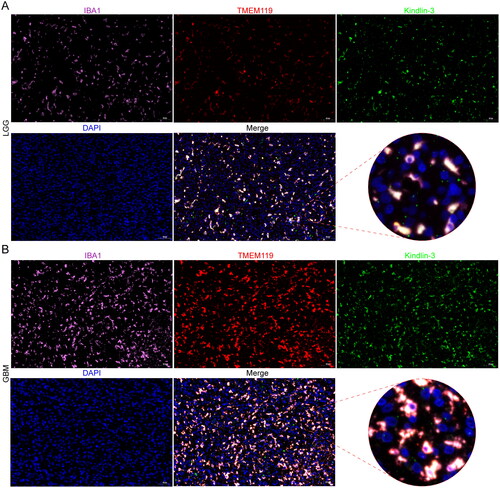
Additional investigations were conducted to explore the expression of FERMT3 at the single-cell level. The cell type, malignancy score, FERMT3 expression, and inflammation scores were calculated in 10X genomics scRNA-seq data of the four GBM specimens based on the CHARTS database. The results showed that FERMT3 was mainly expressed in microglial cells and tissue-resident macrophages (). Meanwhile, FERMT3 was enriched in subgroups with low malignancy scores, and these subgroups had higher inflammation scores (Figure S14). In addition, the correlation between FERMT3 expression and microglia and macrophage markers was analyzed. The results showed a strong positive correlation between FERMT3 expression and the expression of several microglia and macrophage markers in both TCGA-GBMLGG and CGGA325 datasets (). The correlation between FERMT3 and transcription factor gene SPI1 was more than 0.9 (). These results suggest that FERMT3 potentially plays important roles in non-tumor cells, such as microglia and macrophage, and may be associated with a higher inflammation score. To verify the co-expression of Kindlin-3 and GAMs, we performed multiplex immunofluorescence and found that Kindlin-3 expression paralleled that of the pan-myeloid marker (IBA1) and the microglia marker (TMEM119) in LGG and GBM tissues ().
Figure 6. Analysis of single-cell RNA-seq level expression of FERMT3 and its correlation with microglia and macrophage markers. single-cell RNA-seq level expression of FERMT3 in MGH102.10X (A), MGH115.10X (B), MGH124.10X (C) and MGH125.10X (D) from CHARTS database. (E,F) Correlation with microglia and macrophage markers in CGGA325 and TCGA-GBMLGG. (G,H) Correlation between FERMT3 and SPI1 expression in CGGA325 and TCGA-GBMLGG.
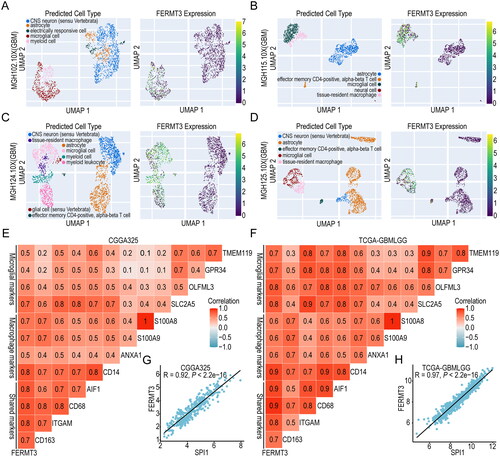
Figure 7. Kindlin-3 is co-expressed with glioma-associated microglia/macrophage markers. (A, B) Multiplex immunofluorescence staining showing Kindlin-3 is co-expressed with the pan-myeloid marker IBA1 and the microglia marker TMEM119 in LGG (n = 3, A) and GBM (n = 7, B) tissues. Scale bars = 50µm.
4. Discussion
Kindlin-3, encoded by the FERMT3 gene, has been implicated in the regulation of integrin activation and shown to influence the functions of hematopoietic and immune cells. It also participates in the development and progression of tumors [Citation2,Citation3]. During leukocyte adhesion to endothelial cells, Kindlin-3 activates β1, β2, and β3 integrin classes [Citation35]. Mutations in the gene encoding Kindlin-3 result in autosomal recessive leukocyte adhesion deficiency type III (LAD-III), which is characterized by a hemorrhagic tendency and severe bleeding as well as impaired adhesion of leukocytes to inflammatory epithelium [Citation35,Citation36]. Interestingly, Kindlin-3 has different roles in tumors. In breast cancer, Kindlin-3 increased the production of VEGF by disrupting the crosstalk between integrin β1 and Twist, and ultimately enhanced the invasion of breast cancer cells, tumor angiogenesis, and tumor metastasis [Citation5]. In melanoma cells, the expression of Kindlin-3 inhibited the migration and metastasis of tumor cells [Citation37]. In addition, Kindlin-3 was found to be significantly upregulated in human glioma tissues compared with normal brain tissues. Knockdown of FERMT3 inhibited glioma cell proliferation and development of chemoresistance to temozolomide (TMZ) [Citation11]. However, the potential of FERMT3 as an independent prognostic factor and its relationship with immune infiltration and the response to immunotherapy remains unknown.
In this study, we found that FERMT3 was highly expressed in glioma, and its expression was correlated to the clinicopathological features that predict poor prognosis. It was also found to be an independent prognostic indicator. Further pathway function analysis showed that high expression of FERMT3 was associated with immune-related pathways such as immune response and cytokine production. Gliomas are known for their complex TIME and poor response to immune checkpoint inhibitor therapy. Given that FERMT3 expression is related to multiple immune-related pathways, we explored the role of FERMT3 in the TIME and found that its expression was positively correlated with immune cells such as macrophages and neutrophils. It was also strongly positively correlated with immune score and several immune checkpoint-related genes, and their correlation coefficients with stromalScore, immuneScore, ESTIMATEScore, and HAVCR2 were more than 0.8. These results suggest that FERMT3 may play a potential role in TIME of glioma.
The TIME of glioma contains about 40% GAMs, which form the most abundant cell population in glioma tumor mass [Citation38]. GAMs can release many types of growth factors and cytokines, promote glioma proliferation, survival, metabolism, migration, and angiogenesis, and inhibit the function of immune cells [Citation39]. Thus, the expression of FERMT3 was explored at the single-cell level and results showed that it was mainly expressed in microglia and macrophage. Subsequently, results indicated that FERMT3 was strongly positively correlated with several microglia/macrophage markers and SPI1 in glioma. Interestingly, we also found that Kindlin-3 was co-expressed with IBA1 and TMEM119 through multiplex immunofluorescence staining. This validated the results at the single-cell level, indicating that Kindlin-3 is expressed in GAMs. Previous studies have demonstrated that Kindlin-3 is required for the maintenance of microglial shape and plasticity and regulates microglial bipolarization in vivo and in response to hard substrates in vitro [Citation40]. This study also showed that lack of Kindlin-3 resulted in hypercontractility in microglia, dysregulation of ERK signaling, overexpression of TGFβ1 and abnormal patterns of vasculature, and severe malformation of photoreceptor regions [Citation40]. A recent study showed that a specific subtype of high-grade glioma-associated microglia exhibits pro-inflammatory and proliferative features and promotes tumor progression by secreting IL1β [Citation41]. Furthermore, several clinical trials targeting TAMs in GBM are currently underway [Citation42]. The significance of investigating Kindlin-3 as a viable therapeutic strategy for targeting GAMs warrants further exploration.
The effect of FERMT3 on treatment response was also explored in this study. There is consensus that glioma is an immune “cold” tumor, and recent reviews have shown that patients with glioma have poor responses to immunotherapy [Citation43,Citation44]. Previous reports have demonstrated that the advancement of emerging immunotherapy strategies [Citation45,Citation46] and the identification of therapeutic targets have the potential to enhance the effectiveness of immunotherapy for glioma [Citation47]. An important finding is that the expression of Fermt3 was upregulated in the immunotherapy response group, and high expression of FERMT3 indicated a good response to anti-PD1 therapy. This may be related to the increased levels of cytokines, chemokines, and immune cell infiltration in the FERMT3 high-expression group. Therefore, patients with high expression of FERMT3 may benefit from targeted immunotherapy. Meanwhile, FERMT3 expression was negatively correlated with various HDACi. Recently, many studies have demonstrated that HDACs affect the survival and TMZ resistance of glioma [Citation48,Citation49]. In preclinical studies, HDACi showed potent antitumor effects. As summarized in previous reviews, many HDACi have been shown to act synergistically with other chemotherapeutic agents, radiotherapy, or immunotherapy in GBM, showing strong therapeutic potential [Citation50]. Therefore, there is a need to explore whether the application of HDACi may exert an anti-tumor effect by reducing the expression of FERMT3, especially in patients with TMZ resistance.
Recently, several studies have revealed potential prognostic markers for glioma, such as Piezo1 [Citation51], transcription factor CASZ1 [Citation52], hsa-miR-196a-5p [Citation53], EVA1C [Citation54], and autophagy-related genes [Citation55]. However, in comparison to our research, none of the aforementioned studies utilized external cohorts to validate independent prognostic markers or investigate the expression of these markers at the single-cell level. Additionally, although some studies have observed the relationship between prognostic markers and immune infiltration [Citation52,Citation54], it is important to note that no significant relationship has been established between these markers and the response to immunotherapy. Despite these findings, there are some shortcomings in this study. For example, the expression and prognostic value of Kindlin-3 need to be verified through a large study cohort. The integration of the prognostic nomogram with commonly used clinical prognostic markers (such as IDH mutation status and 1p/19q codeletion status) provides a solid theoretical framework for tailoring individualized treatment strategies for glioma patients [Citation56]. By incorporating FERMT3 expression and clinicopathological characteristics in multivariate Cox regression analysis, certain clinical prognostic indicators, including IDH status in the CGGA325 dataset, do not meet the criteria to be classified as independent prognostic factors. Conducting subsequent studies with large cohorts to develop nomograms based on FERMT3 and independent prognostic clinicopathological characteristics will prove highly valuable in facilitating prognostic assessment and guiding personalized treatment for individuals. It is undeniable that these interesting findings of ours are worthy of further study on the role and function of Kindlin-3 in glioma. In addition, future research should exploit technologies such as 3D cell culture to clarify the role of Kindlin-3 in the interaction between glioma cells and tumor-infiltrating immune cells.
5. Conclusion
In summary, our study shows that FERMT3 is closely related to the clinicopathological characteristics of glioma and can be used as an independent prognostic indicator. Functional enrichment analysis revealed that its high expression correlates with immune-related pathways such as immune response and cytokine production. It is highly positively correlated with the expression of various immune cells, immune scores, and immune checkpoint-related genes. Moreover, FERMT3 is specifically highly expressed in GAMs and its high expression predicts a better response to anti-PD1 therapy.
Author contributions
KY and KW conceived and designed the study. SZ, CT, and LY contributed equally to the experimentation, data analysis, and manuscript writing. ZC and TC revised the manuscript. The final manuscript has been read and approved by all authors.
Ethics approval
The study methodologies conformed to the standards set by the Declara-tion of Helsinki. The studies involving human participants were reviewed and approved by the Medical Ethics Committee of the First Affiliated Hospital of Hainan Medical University (Approval number: 2022 (Scientifc Research L) No. (144)).
Patient consent
All participants were provided with written informed consent.
Supplemental Material
Download MS Word (8.1 MB)Acknowledgments
The authors gratefully acknowledge contributions from the CGGA, TCGA network, and other multiple databases used in this manuscript and sincerely thank the Home for Researchers editorial team for the language polishment.
Disclosure statement
No potential conflict of interest was reported by the author(s).
Data availability statement
The datasets presented in this study can be found in in the CGGA database (http://www.cgga.org.cn/).
Correction Statement
This article has been republished with minor changes. These changes do not impact the academic content of the article.
Additional information
Funding
References
- Low JT, Ostrom QT, Cioffi G, et al. Primary brain and other central nervous system tumors in the United States (2014-2018): a summary of the CBTRUS statistical report for clinicians. Neurooncol Pract. 2022;9(3):1–15.
- Rognoni E, Ruppert R, Fassler R. The kindlin family: functions, signaling properties and implications for human disease. J Cell Sci. 2016;129(1):17–27. doi: 10.1242/jcs.161190.
- Zhan J, Zhang H. Kindlins: roles in development and cancer progression. Int J Biochem Cell Biol. 2018;98:93–103. doi: 10.1016/j.biocel.2018.03.008.
- Sin S, Bonin F, Petit V, et al. Role of the focal adhesion protein kindlin-1 in breast cancer growth and lung metastasis. J Natl Cancer Inst. 2011;103(17):1323–1337. doi: 10.1093/jnci/djr290.
- Sossey-Alaoui K, Pluskota E, Davuluri G, et al. Kindlin-3 enhances breast cancer progression and metastasis by activating twist-mediated angiogenesis. Faseb J. 2014;28(5):2260–2271. doi: 10.1096/fj.13-244004.
- Ma L, Tian Y, Qian T, et al. Kindlin-2 promotes src-mediated tyrosine phosphorylation of androgen receptor and contributes to breast cancer progression. Cell Death Dis. 2022;13(5):482. doi: 10.1038/s41419-022-04945-z.
- Zhan J, Zhu X, Guo Y, et al. Opposite role of kindlin-1 and kindlin-2 in lung cancers. PLoS One. 2012;7(11):e50313. doi: 10.1371/journal.pone.0050313.
- Liu G, Bao Y, Liu C, et al. IKKε phosphorylates kindlin-2 to induce invadopodia formation and promote colorectal cancer metastasis. Theranostics. 2020;10(5):2358–2373. doi: 10.7150/thno.40397.
- Tang Y, Nan N, Gui C, et al. Blockage of PD-L1 by FERMT3-mediated wnt/β-catenin signalling regulates chemoresistance and immune evasion of colorectal cancer cells. Clin Exp Pharmacol Physiol. 2022;49(9):988–997. doi: 10.1111/1440-1681.13685.
- Ou YW, Zhao ZT, Wu CY, et al. Mig-2 attenuates cisplatin-induced apoptosis of human glioma cells in vitro through AKT/JNK and AKT/p38 signaling pathways. Acta Pharmacol Sin. 2014;35(9):1199–1206. doi: 10.1038/aps.2014.60.
- Lu C, Cui C, Liu B, et al. FERMT3 contributes to glioblastoma cell proliferation and chemoresistance to temozolomide through integrin mediated wnt signaling. Neurosci Lett. 2017;657:77–83. doi: 10.1016/j.neulet.2017.07.057.
- Tang Z, Li C, Kang B, et al. GEPIA: a web server for cancer and normal gene expression profiling and interactive analyses. Nucleic Acids Res. 2017;45(W1):W98–w102. doi: 10.1093/nar/gkx247.
- Chandrashekar DS, Karthikeyan SK, Korla PK, et al. UALCAN: an update to the integrated cancer data analysis platform. Neoplasia. 2022;25:18–27. doi: 10.1016/j.neo.2022.01.001.
- Shen W, Song Z, Zhong X, et al. Sangerbox: a comprehensive, interaction-friendly clinical bioinformatics analysis platform. iMeta. 2022;1(3):e36. doi: 10.1002/imt2.36.
- Zhao Z, Zhang KN, Wang Q, et al. Chinese glioma genome atlas (CGGA): a comprehensive resource with functional genomic data from Chinese glioma patients. Genomics Proteomics Bioinformatics. 2021;19(1):1–12. doi: 10.1016/j.gpb.2020.10.005.
- Bowman RL, Wang Q, Carro A, et al. GlioVis data portal for visualization and analysis of brain tumor expression datasets. Neuro Oncol. 2017;19(1):139–141. doi: 10.1093/neuonc/now247.
- Li J, Miao B, Wang S, et al. Hiplot: a comprehensive and easy-to-use web service for boosting publication-ready biomedical data visualization. Brief Bioinform. 2022;23(4):bbac261.
- Gao J, Aksoy BA, Dogrusoz U, et al. Integrative analysis of complex cancer genomics and clinical profiles using the cBioPortal. Sci Signal. 2013;6(269):pl1. doi: 10.1126/scisignal.2004088.
- Lin A, Qi C, Wei T, et al. CAMOIP: a web server for comprehensive analysis on multi-omics of immunotherapy in pan-cancer. Brief Bioinform. 2022;23(3):bbac129. doi: 10.1093/bib/bbac129.
- Ru B, Wong CN, Tong Y, et al. TISIDB: an integrated repository portal for tumor-immune system interactions. Bioinformatics. 2019;35(20):4200–4202. doi: 10.1093/bioinformatics/btz210.
- Li T, Fan J, Wang B, et al. TIMER: a web server for comprehensive analysis of Tumor-Infiltrating immune cells. Cancer Res. 2017;77(21):e108–e10. doi: 10.1158/0008-5472.CAN-17-0307.
- He Y, Jiang Z, Chen C, et al. Classification of triple-negative breast cancers based on immunogenomic profiling. J Exp Clin Cancer Res. 2018;37(1):327. doi: 10.1186/s13046-018-1002-1.
- Yoshihara K, Shahmoradgoli M, Martínez E, et al. Inferring tumour purity and stromal and immune cell admixture from expression data. Nat Commun. 2013;4(1):2612. doi: 10.1038/ncomms3612.
- Bennett ML, Bennett FC, Liddelow SA, et al. New tools for studying microglia in the mouse and human CNS. Proc Natl Acad Sci U S A. 2016;113(12):E1738–46. doi: 10.1073/pnas.1525528113.
- Darmanis S, Sloan SA, Croote D, et al. Single-Cell RNA-Seq analysis of infiltrating neoplastic cells at the migrating front of human glioblastoma. Cell Rep. 2017;21(5):1399–1410. doi: 10.1016/j.celrep.2017.10.030.
- Roesch S, Rapp C, Dettling S, et al. When immune cells turn Bad-Tumor-Associated microglia/macrophages in glioma. Int J Mol Sci. 2018;19(2):436. doi: 10.3390/ijms19020436.
- McIvor Z, Hein S, Fiegler H, et al. Transient expression of PU.1 commits multipotent progenitors to a myeloid fate whereas continued expression favors macrophage over granulocyte differentiation. Exp Hematol. 2003;31(1):39–47. doi: 10.1016/s0301-472x(02)01017-2.
- Sonn I, Honda-Ozaki F, Yoshimatsu S, et al. Single transcription factor efficiently leads human induced pluripotent stem cells to functional microglia. Inflamm Regen. 2022;42(1):20. doi: 10.1186/s41232-022-00201-1.
- Zeng Z, Wong CJ, Yang L, et al. TISMO: syngeneic mouse tumor database to model tumor immunity and immunotherapy response. Nucleic Acids Res. 2022;50(D1):D1391–D1397. doi: 10.1093/nar/gkab804.
- Hoshida Y, Brunet JP, Tamayo P, et al. Subclass mapping: identifying common subtypes in independent disease data sets. PLOS One. 2007;2(11):e1195. doi: 10.1371/journal.pone.0001195.
- He G, Chen Z, Zhuo S, et al. Pyroptosis: a novel signature to predict prognosis and immunotherapy response in gliomas. Hum Cell. 2022;35(6):1976–1992. doi: 10.1007/s13577-022-00791-5.
- Liu CJ, Hu FF, Xia MX, et al. GSCALite: a web server for gene set cancer analysis. Bioinformatics. 2018;34(21):3771–3772. doi: 10.1093/bioinformatics/bty411.
- Bernstein MN, Ni Z, Collins M, et al. CHARTS: a web application for characterizing and comparing tumor subpopulations in publicly available single-cell RNA-seq data sets. BMC Bioinf. 2021;22(1):83. doi: 10.1186/s12859-021-04021-x.
- Neftel C, Laffy J, Filbin MG, et al. An integrative model of cellular states, plasticity, and genetics for glioblastoma. Cell. 2019;178(4):835–849.e21. doi: 10.1016/j.cell.2019.06.024.
- Moser M, Bauer M, Schmid S, et al. Kindlin-3 is required for beta2 integrin-mediated leukocyte adhesion to endothelial cells. Nat Med. 2009;15(3):300–305. doi: 10.1038/nm.1921.
- Svensson L, Howarth K, McDowall A, et al. Leukocyte adhesion deficiency-III is caused by mutations in KINDLIN3 affecting integrin activation. Nat Med. 2009;15(3):306–312. doi: 10.1038/nm.1931.
- Feng C, Wee WK, Chen H, et al. Expression of kindlin-3 in melanoma cells impedes cell migration and metastasis. Cell Adh Migr. 2017;11(5-6):419–433. doi: 10.1080/19336918.2016.1243645.
- Buonfiglioli A, Hambardzumyan D. Macrophages and microglia: the cerberus of glioblastoma. Acta Neuropathol Commun. 2021;9(1):54. doi: 10.1186/s40478-021-01156-z.
- Xuan W, Lesniak MS, James CD, et al. Context-Dependent Glioblastoma-Macrophage/microglia symbiosis and associated mechanisms. Trends Immunol. 2021;42(4):280–292. doi: 10.1016/j.it.2021.02.004.
- Dudiki T, Meller J, Mahajan G, et al. Microglia control vascular architecture via a TGFβ1 dependent paracrine mechanism linked to tissue mechanics. Nat Commun. 2020;11(1):986. doi: 10.1038/s41467-020-14787-y.
- Liu H, Sun Y, Zhang Q, et al. Pro-inflammatory and proliferative microglia drive progression of glioblastoma. Cell Rep. 2021;36(11):109718. doi: 10.1016/j.celrep.2021.109718.
- Wang G, Zhong K, Wang Z, et al. Tumor-associated microglia and macrophages in glioblastoma: from basic insights to therapeutic opportunities. Front Immunol. 2022;13:964898. doi: 10.3389/fimmu.2022.964898.
- Yu MW, Quail DF. Immunotherapy for glioblastoma: current progress and challenges. Front Immunol. 2021;12:676301. doi: 10.3389/fimmu.2021.676301.
- Wang C, Yu M, Zhang W. Neoantigen discovery and applications in glioblastoma: an immunotherapy perspective. Cancer Lett. 2022;550:215945. doi: 10.1016/j.canlet.2022.215945.
- Bian Y, Wang Y, Chen X, et al. Image-guided diagnosis and treatment of glioblastoma. View. 2023;4(3):20220069. doi: 10.1002/VIW.20220069.
- Zhu H, Yang C, Yan A, et al. Tumor-targeted nano-adjuvants to synergize photomediated immunotherapy enhanced antitumor immunity. View. 2023;4(3):20220067. doi: 10.1002/VIW.20220067.
- Qu S, Huang C, Zhu T, et al. OLFML3, as a potential predictor of prognosis and therapeutic target for glioma, is closely related to immune cell infiltration. View. 2023;4(2):20220052. doi: 10.1002/VIW.20220052.
- Yang WB, Hsu CC, Hsu TI, et al. Increased activation of HDAC1/2/6 and Sp1 underlies therapeutic resistance and tumor growth in glioblastoma. Neuro Oncol. 2020;22(10):1439–1451. doi: 10.1093/neuonc/noaa103.
- Hanisch D, Krumm A, Diehl T, et al. Class I HDAC overexpression promotes temozolomide resistance in glioma cells by regulating RAD18 expression. Cell Death Dis. 2022;13(4):293. doi: 10.1038/s41419-022-04751-7.
- Chen R, Zhang M, Zhou Y, et al. The application of histone deacetylases inhibitors in glioblastoma. J Exp Clin Cancer Res. 2020;39(1):138. doi: 10.1186/s13046-020-01643-6.
- Qu S, Li S, Hu Z. Upregulation of Piezo1 is a novel prognostic indicator in glioma patients. Cancer Manag Res. 2020;12:3527–3536. doi: 10.2147/CMAR.S251776.
- Mao C, Huang C, Hu Z, et al. Transcription factor CASZ1 increases an oncogenic transcriptional process in tumorigenesis and progression of glioma cells. MedComm. 2022;3(4):e182. doi: 10.1002/mco2.182.
- Qu S, Qiu O, Huang J, et al. Upregulation of hsa-miR-196a-5p is associated with MIR196A2 methylation and affects the malignant biological behaviors of glioma. Genomics. 2021;113(3):1001–1010. doi: 10.1016/j.ygeno.2021.02.012.
- Hu Z, Qu S. EVA1C is a potential prognostic biomarker and correlated with immune infiltration levels in WHO grade II/III glioma. Front Immunol. 2021;12:683572. doi: 10.3389/fimmu.2021.683572.
- Qu S, Liu S, Qiu W, et al. Screening of autophagy genes as prognostic indicators for glioma patients. Am J Transl Res. 2020;12(9):5320–5331.
- Qu S, Qiu O, Hu Z. The prognostic factors and nomogram for patients with high-grade gliomas. Fundam Res. 2021;1(6):824–828. doi: 10.1016/j.fmre.2021.07.005.