
Abstract
Background
Acute kidney injury (AKI) is a common and serious complication after the repair of Type A acute aortic dissection (TA-AAD). However, previous models have failed to account for the impact of blood pressure fluctuations on predictive performance. This study aims to develop machine learning (ML) models combined with intraoperative medicine and blood pressure time-series data to improve the accuracy of early prediction for postoperative AKI risk.
Methods
Indicators reflecting the duration and depth of hypotension were obtained by analyzing continuous mean arterial pressure (MAP) monitored intraoperatively with multiple thresholds (<65, 60, 55, 50) set in the study. The predictive features were selected by logistic regression and the least absolute shrinkage and selection operator (LASSO), and 4 ML models were built based on the above features. The performance of the models was evaluated by area under receiver operating characteristic curve (AUROC), calibration curve and decision curve analysis (DCA). Shapley additive interpretation (SHAP) was used to explain the prediction models.
Results
Among the indicators reflecting intraoperative hypotension, 65 mmHg showed a statistically superior difference to other thresholds in patients with or without AKI (p < .001). Among 4 models, the extreme gradient boosting (XGBoost) model demonstrated the highest AUROC: 0.800 (95% 0.683–0.917) and sensitivity: 0.717 in the testing set and was verified the best-performing model. The SHAP summary plot indicated that intraoperative urine output, cumulative time of mean arterial pressure lower than 65 mmHg outside cardiopulmonary bypass (OUT_CPB_MAP_65 time), autologous blood transfusion, and smoking were the top 4 features that contributed to the prediction model.
Conclusion
With the introduction of intraoperative blood pressure time-series variables, we have developed an interpretable XGBoost model that successfully achieve high accuracy in predicting the risk of AKI after TA-AAD repair, which might aid in the perioperative management of high-risk patients, particularly for intraoperative hemodynamic regulation.
Key Messages
In this study, we combined intraoperative blood pressure time-series data for the first time to build 4 machine learning (ML) models that successfully improve the accuracy of early prediction of postoperative AKI risk, with the XGBoost model displaying the best predictive performance.
We explored the impact of multiple intraoperative hypotension thresholds (MAP <65, <60, <55 < 50 mmHg) on the occurrence of postoperative AKI in patients and attempted to provide clinicians with recommendations for hemodynamic management during surgery.
Our study found that 65 mmHg showed a statistically superior difference to other thresholds in patients with or without AKI after undergoing TA-AAD repair (p < .001).
Introduction
Cardiac surgery-associated acute kidney injury (CSA-AKI) is a recognized category of common and serious perioperative complication for which no specific drugs are available [Citation1]. With an ageing society and a number of breakthroughs in clinical management and surgical techniques, more and more patients opt to undergo complex cardiothoracic surgical procedures in China, such as repair of Type A acute aortic dissection (TA-AAD) [Citation2], in tertiary hospitals. However, patients with TA-AAD tend to be more prone to severe systemic pathophysiological changes and have a slightly higher incidence of AKI than other cardiac procedures [Citation3,Citation4]. Failure to screen and intervene promptly may not only result in the development of AKI to a stage of kidney loss requiring continuous renal replacement therapy (RRT), increasing the risk of developing chronic kidney disease (CKD) at a young age, but may also lead to multi-organ dysfunction in the brain, heart, liver, lungs and immune system, forcing longer intensive care unit (ICU) stays, higher mortality rates and larger treatment costs [Citation5,Citation6]. It is significant to identify patients who are at high risk of AKI after TA-AAD repair as early as possible and to give them more healthcare, thereby reducing the potential threat of postoperative complications.
While it is common knowledge that serum creatinine (Scr) levels have been used as the traditional gold standard for diagnosing AKI, the latest findings suggest that this indicator has a delayed effect in response to acute nephrosis and is recommended for replacement [Citation7]. On the other hand, previous predictive scoring models developed by various observers had shown great promise in differentiating AKI risk after TA-AAD repair prior to changes in Scr levels, where area under receiver operating characteristic curve (AUROC) ranged from 0.73 to 0.78 [Citation8–12]. However, all of these models have more or less limitations and there seems to be more room for improvement in predictive performance. Most studies either consider only critical patients requiring RRT, ignoring the potential threat of stage 1, or rely on traditional characteristics at a single phase in the perioperative period, especially those focusing on preoperative laboratory physicochemical indicators, without taking a look at intraoperative hemodynamics. Besides, conventional logistic regression methods are mainly adopted to construct the models, unable to accurately handle the complex interactions between multiple predictors and prone to over-fitting. Hence, it is challenging to achieve precise prediction of postoperative AKI in Chinese (non-white) TA-AAD patients using the above model.
Machine learning (ML) models for risk stratification of major diseases, which could dramatically improve the accuracy and sensitivity in predicting outcomes, are increasingly being looked upon with praise by an increasing number of clinical experts as available clinical data resources become publicly available and widespread, for example, in the areas of precision therapy and prevention of oncology, cardiovascular, and psychiatry, frequently prompting ground-breaking changes in the diagnostic procedure [Citation13–15]. ML methods include a variety of algorithms that allow analysis of the non-linear relationship between predictors and the targeted outcome, as well as identify the full subset of feature variables that may be relevant [Citation16,Citation17]. Nevertheless, as of now, only one AAD-AKI prediction model based on the ML algorithm had been reported, with smaller sample sizes and lack of universal clinical application [Citation12].
Therefore, considering that perioperative hypotension may increase the risk of patients suffering from AKI after the operation and there are no recommended optimal blood pressure management protocols [Citation18], we sought to determine the appropriate threshold for intraoperative blood pressure management in aortic dissection surgery, and analyze the association between intraoperative drugs and outcomes. and to develop predictive models in combination with artificial intelligence techniques for the early risk assessment of AKI in patients undergoing TA-AAD repair as a highly attractive target for optimizing clinical intervention strategies in the future.
Methods
Study population
We retrospectively collected the medical records of adult patients with TA-AAD who underwent surgical treatment at Nanjing First Hospital from January 2019 to August 2022. TA-AAD diagnosis was confirmed by computed tomography angiography and color Doppler ultrasound. Patients were excluded if they (i) lacked perioperative serum creatinine (Scr) data; (ii) had already started Renal Replacement Therapy (RRT) before surgery; (iii) died within 48 h after surgery; (iv) had a history of aortic aneurysm, Marfan’s syndrome, traumatic and medically induced aortic coarctation. The institutional review board (IRB) of Nanjing First Hospital (Nanjing, Jiangsu, China) approved this study based on the Helsinki Declaration, which waived the need to obtain patient informed consent (KY20221122-01-KS-01).
Procedures
Patients with TA-AAD were admitted to ICU before surgery and controlled blood pressure and heart rate. After admission to the operating room, invasive arterial puncture was performed to detect the mean arterial pressure (MAP). All patients received general intravenous-inhalation combined anesthesia, the aim of maintaining the bispectral index (BIS) in the range of 40-60. Cardiopulmonary bypass (CPB) was performed with non-pulsatile perfusion; with perfusion, the flow was 2.0–2.8 L/min/m2 and MAP was maintained at 55–85 mmHg. The mean bladder temperature during hypothermic circulatory arrest was 28 ± 0.3 °C. Shed blood from the operational field was collected into a cell saver reservoir (Jingjing Medical Equipment, Beijing, China), autologous cell salvaged and washed blood was transfused into the patient. After the surgery, the patient was transferred to ICU with tracheal tube for further support and management.
Data collection
Data for analysis included demographics, past medical history, laboratory tests, surgery and anesthesia details stored in the patient’s electronic health record. We calculated patients’ estimated glomerular filtration rate (eGFR) using the Chronic Kidney Disease Epidemiology Collaboration (CKD-EPI) equation recommended by 2012 KDIGO Guideline, which is considered to have higher accuracy [Citation19,Citation20]. The Vaso-Inotropic Score (VIS) was calculated based on the intraoperative dose of the appropriate drugs: VIS = dobutamine dose (µg/kg/min) + dobutamine dose (µg/kg/min) + 100 × epinephrine dose (µg/kg/min) + 10 × milrinone dose (µg/kg/min) + 10,000 × vasopressin dose (U/kg/min) + 100 × norepinephrine dose (µg/kg/min) + 50 × levosimendan dose (µg/kg/min) [Citation21].
In addition, the data included intraoperative time-series hemodynamic characteristics (MAP and central venous pressure (CVP)) monitored in the Anesthesia Information Management System. MAP was calculated as 2/3 × diastolic blood pressure (DBP) + 1/3 × systolic blood pressure (SBP), and MAP were recorded directly during CPB. Intraoperative hypotension in the proportion of CPB duration was set as MAP < 65 mmHg. Given the published variability of intraoperative hypotension and venous congestion, thresholds for MAP (< 65, < 60, < 55, < 50 mmHg) and CVP (> 12, > 16, > 20 mmHg) were preset. For the processing of time-series data, we calculated the cumulative duration of MAP and CVP below or above the corresponding thresholds. To better reflect the duration and depth of abnormal pressure value, we calculated the total area under the curve (AUT) based on the trapezoidal rule [Citation22,Citation23].
Outcome
The outcome of this study was the occurrence of postoperative AKI. According to Kidney Disease: Improving Global Outcomes (KDIGO) Clinical Practice Guidelines, postoperative AKI was defined [Citation24]. Specifically, postoperative stage 1 AKI was defined as an increase in Scr of more than 1.5 times the baseline level within the first 7 d of surgery or an increase in Scr of ≥0.3 mg/dL (≥26.5 μmol/L) within 48 h of surgery; Stage 2 was defined as an increase of more than 2 times the baseline level, and stage 3 was defined as an increase of more than 3 times the baseline level or a level increase of ≥4 mg/dL (353.6 μmol/L), or requiring RRT. Baseline Scr was defined as the most recent Scr value within 48 h before surgery.
Feature selection
The original dataset was randomly stratified into a training set and a testing set by 8:2. The training set was used for feature selection and model training (including hyperparameter tuning). The testing set was used as internal validation to assess the stability and reliability of each model. First, we screened all variables with p < .05 using univariate logistic regression analysis. Next, we included the above variables in the least absolute shrinkage and selection operator (LASSO) analysis to extract the optimal feature subset [Citation25]. The LASSO method employed the hyperparameter lambda (λ) to minimize the regression coefficients during model estimation, excluding features with coefficients that were exactly zero, and non-zero variables were selected for further analysis. This Lambda was chosen from 500 numbers between 0 and 0.5, and the ideal hyperparameter for minimizing the objective function was determined by 10-fold cross-validation. This process was repeated 50 times for each LASSO model to prevent errors that might result from a single 10-fold cross-validation. Finally, prediction models were constructed using all non-zero coefficient variables obtained from LASSO. The LASSO was performed using the R package glmnet 4.1-3.
Model development and evaluation
We adopted 4 ML models, including L2 regularized logistic regression (LR with L2), random forest classifier (RFC), support vector machine (SVM), and extreme gradient boosting (XGBoost). To avoid overfitting, we used a grid search algorithm with 10-fold cross-validation to find the optimal hyperparameters in the training set. Then the generalization performance of the model was evaluated in the testing set.
Specifically, the evaluation indicators were described as follows. We calculated AUROC and used the Delong test to analyze the statistical differences between the AUROC of different models [Citation26]. The Youden index (Youden index = sensitivity + specificity − 1) was used to determine the optimal threshold. Each model’s sensitivity, specificity, accuracy, and F1 values were obtained based on these thresholds. The 10-fold cross-validation was performed to obtain the accuracy of the models each time to assess the robustness. The Brier score assessed the calibration capability, calculating the difference between real-world and model-predicted results. A lower score indicated better calibration. The ultimate goal of developing models was to aid in clinical practice. Therefore, to determine the suitability of a model to support clinical decision making, the decision curve analysis (DCA) was used to assess the clinical benefit of each model [Citation27].
In addition, all continuous variables were preprocessed with Z-score normalization, while all categorical variables were transformed using One-Hot coding before inclusion in the models [Citation28,Citation29]. Finally, all models were built using the ‘sklearn 1.0.2’ and ‘xgboost 1.5.1’ packages in Python.
Model interpretation
The SHapley Additive Interpretation (SHAP) method was proposed to visualize the importance of variables in ML models and provided a metric for explaining the model risk prediction mechanisms [Citation30]. The SHAP summary bar plot visualized which features impact the model’s predictions most, while the SHAP summary scatter plot helped determine whether variables were positively correlated with the results. In addition, the method could be benefit to evaluate how the raw values of each feature affect the prediction model’s output. The SHAP dependence plot represented this result. The SHAP method was executed using the SHAP 0.39.0 library in Python.
Statistical analysis
First of all, we used the K-nearest neighbor (KNN) method to fill in the missing data [Citation31]. This method calculated the missing value by calculating the Euclidean distance between each case, using the average of the five nearest neighbors. And then, the normality of the distribution was tested for all continuous variables using the Shapiro-Wilk test. And descriptive statistics were used for all variables, with continuous variables expressed as mean (standard deviation) or median (quartile range), and categorical variables expressed as numbers (percentages). When appropriate, continuous variables were analyzed using either the Student t-test or the Mann-Whitney U-test. Fisher’s exact test or χ2 test were used for categorical variables. All tests were two-sided, and p < .05 was considered statistically significant. We performed statistical analysis using IBM SPSS software (version 25.0) and R version 4.2.2.
Results
Study population
The flow chart of patient enrollment was shown in . Among the 306 enrolled patients, 265 patients who met the criteria for naval exclusion were enrolled in this study. As shown in , there were no statistical difference in baseline Scr, urea nitrogen and eGFR between patients with and without AKI (p > .05), and there were statistical differences in ASA (p = .012) and VIS (p = .003). A total of 191 patients (72.1%) had AKI, and stage 1, 2 and 3 AKI patients accounted for 36.6%, 16.6% and 18.9%, respectively. A similar proportion of patients with AKI was established between the training and testing sets, as shown in Table S1, with almost balanced demographic and clinical characteristics between the two sets.
Figure 1. Flow chart of patient enrollment in this study.
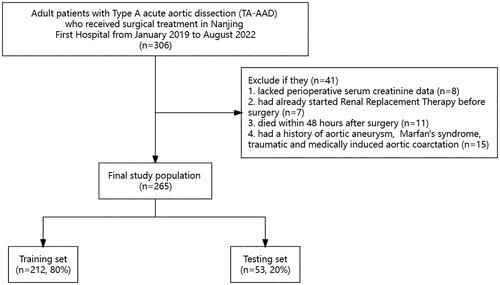
Table 1. The demographic and clinical characteristics in the whole cohort.
Feature selection
A few variables had some missing, the specific percentage of missing were listed in Table S2, which we filled using the KNN method. The univariate associations of candidate predictors with the occurrence of AKI were listed in Table S3. A total of 9 variables associated with postoperative AKI were identified by LASSO, including intraoperative urine output, cumulative time of mean arterial pressure lower than 65 mmHg outside cardiopulmonary bypass (OUT_CPB_MAP_65 time), autologous blood transfusion, smoking, blood platelet transfusion, intraoperative diuretics use, norepinephrine dose, total area under curve below threshold mean arterial blood pressure 65 mmHg outside cardiopulmonary bypass (OUT_CPB_MAP_AUT_65), and fraction of intraoperative hypotension duration during CPB. Detailed coefficients for all nonzero coefficient variables after LASSO were given in Table S4.
Model performance
The 4 different machine algorithms were employed in current study. The best hyperparameters of each model and the accuracy values of the 10-fold cross-validation can be found in Table S5 and S6. Then, the results of the Delong test demonstrated no statistical difference in AUROC among the models (Table S7). The AUROC of each model in the testing set, as well as the sensitivity, specificity and other evaluation indexes under the selected threshold were manifested in and . It can be seen that for the prediction of postoperative AKI, the XGBoost model showed the highest AUROC: 0.800 (0.683–0.917), sensitivity: 0.737 and F1 value: 0.789, which was selected as the best model to predict AKI. And the model was well calibrated, as shown in . The net benefit of each model at different threshold probabilities was revealed in the DCA (), where the XGBoost model gained more benefit than the all-patient treatment regimen (blue) or the no-patient treatment regimen (black) using this prediction model to guide clinical interventions at threshold probabilities of 0.6–0.9.
Figure 2. The AUROC of 4 models. (a) in the training set. (b) in the testing set. AUROC: area under the receiver operating characteristic curve; LR: logistic regression; XGB: extreme gradient boosting; RFC: random forest classifier; SVM: support vector machine.
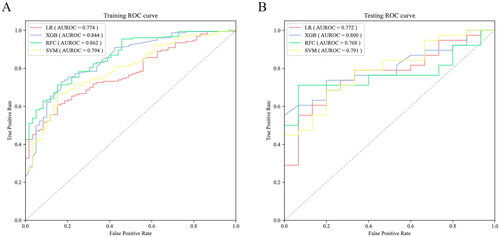
Figure 3. Performance of machine learning models. (a) the calibration plots. (b) the decision curve analysis in the testing set. LR: logistic regression; XGB: extreme gradient boosting; RFC: random forest classifier; SVM: support vector machine.
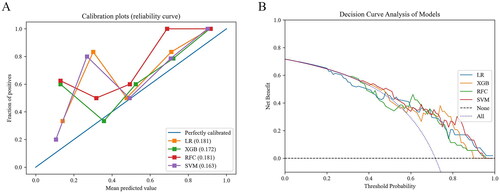
Table 2. Comparison of the performance of each model at the optimal threshold.
Model interpretation
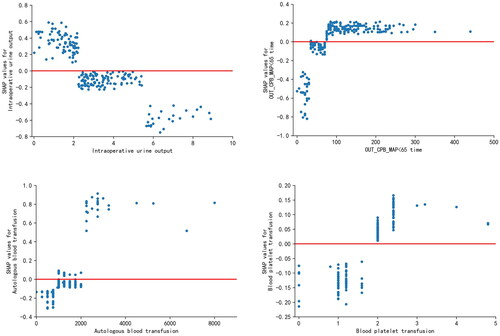
The SHAP algorithm was used to visualize the interpretation of the best prediction model. The factors of which influencing AKI after TA-AAD were ranked by SHAP summary plots for the importance of the characteristics (). showed that intraoperative urine output, OUT_CPB_MAP_65 time, autologous blood transfusion, smoking and blood platelet transfusion were the top 5 important features. Both SHAP plots displayed that lower intraoperative urine output, higher OUT_CPB_MAP_65 time, higher autologous blood transfusion, and higher blood platelet transfusion were associated with higher SHAP value output in the XGBoost model, indicating a higher probability of AKI ( and ).
Figure 4. SHAP summary plot of the XGB model. (a) Average absolute influence of factors on the model output magnitude in the order of importance of feature significance. (b) the graphic illustrated the dot estimate of the XGB model output. XGB, extreme gradient boosting; out_CPB_MAP < 65 time, cumulative time of mean arterial pressure lower than 65 mmHg outside cardiopulmonary bypass; out_CPB_MAP_AUT_65, total area under curve below threshold mean artery blood pressure 65 mmHg outside cardiopulmonary bypass; CPB, cardiopulmonary bypass.
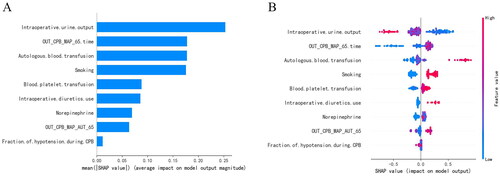
Figure 5. SHAP dependence plot of the XGB model. (a) Intraoperative urine output. (b) out_CPB_MAP < 65 time. (c) autologous blood transfusion. d blood platelet transfusion. The x-axis represents the raw values of each feature and the y-axis indicates the SHAP values of features. When the SHAP value of a specific feature exceeds zero, it indicates an increased risk of acute kidney injury. XGB, extreme gradient boosting; out_CPB_MAP < 65 time, cumulative time of mean arterial pressure lower than 65 mmHg outside cardiopulmonary bypass.
Discussion
This study proposed to develop ML models by combining intraoperative time-series data for the first time that could be used to improve the accuracy of early prediction of the risk of postoperative AKI. Patients undergoing on-pump TA-AAD surgery at a tertiary hospital over three consecutive years (2019–2022) in China were retrospectively evaluated to give clinicians advice on the management of hemodynamics during the procedure. Of the 9-variable models constructed based on the 4 ML algorithms, the XGBoost model demonstrated the most satisfactory performance with an AUROC of 0.800 (95% CI: 0.683–0.917), the sensitivity of 0.737 and F1 value of 0.810, outperforming RFC, SVM or LR with L2.
It is well known that attempting early risk stratification of patients undergoing cardiac repair with individualized management strategies, such as regulating hemodynamics and closely monitoring changes in cardiac and renal function [Citation32,Citation33], to prevent the development of AKI is not a new challenge. As reported in a series of previous studies, the incorporation of intraoperative data reflecting the patient’s real-time acute physiological stress condition during surgery into predictive models would be a landmark in the accurate assessment of multiple postoperative complications, including AKI, myocardial injury (MI), and stroke, but unfortunately are currently limited to the investigation of non-cardiac surgery populations [Citation34–37].
The most novel feature of this study is that, based on continuously recorded invasive blood pressure measurements throughout the operation, it focuses on the key impact of an easily controlled intraoperative anesthetic management strategy on the early prediction of the occurrence of AKI after TA-AAD repair.
First of all, a patient’s favorable prognosis may benefit from identifying an intraoperative MAP threshold target. Not surprisingly, when MAP is below a certain threshold, the autoregulation of blood flow to several tissues and organs, such as the renal, is easily disrupted [Citation38,Citation39]. A prolonged low MAP value is equivalent to a longer period of organ perfusion deficit, thereby increasing the risk of kidney injury [Citation40–42]. Conversely, above this threshold, MAP values fluctuate up and down with limited impact on the incidence of AKI [Citation43,Citation44]. In constructing a highly accurate ‘early warning’ model, this study attempted to set multiple absolute MAP thresholds (<50, <55, <60, <65 mmHg) in light of our previous cohort studies [Citation45] and the published consensus statements on intraoperative blood pressure [Citation46], and confirmed that 65 mmHg showed a statistically superior difference to other thresholds in terms of lowering the risk of postoperative AKI. Unlike previous studies for non-cardiac surgery, MAP <65 mmHg also seems reasonable for TA-AAD patients with generally a history of hypertension. In the future, it would be worth considering using this threshold to deploy prospective research in multiple major medical centers to contribute to the development of official guidelines.
Secondly, we were inspired by the time-weighted vaso-inotropic score (VISAUC) established by Vandenberghe et al. [Citation47] to propose the use of MAP_AUT as a proxy for describing the severity of intraoperative hypotension, successfully incorporating time-series features into the prediction model and filling the gap of cleverly transforming dynamic variables [Citation48,Citation49]. Namely, the joint effect of both the ‘value’ of the intraoperative MAP at a given time-point and cumulative time below a given MAP ‘value’ on predicting outcome can be taken into account. To give an example, Patient A had hypotension for 60 min and almost always remained at 60 mmHg; Patient B had hypotension for 20 min but was as low as 40 mmHg. It would not seem reasonable to judge that Patient A had more severe hypotension based solely on the duration of hypotension. Whereas in our model, calculating the cumulative time while also considering the area under the curve could better reflect the perioperative blood pressure fluctuations and the abnormal degree of hypotension in patients.
Thirdly, according to the differences in the principles of blood pressure regulation during cardiac surgery (before, during and after CPB), we investigated how the dynamic changes of MAP under two intervals, respectively the time of exposure to hypotension outside of CPB and during CPB, were associated with outcomes. In contrast to blood pressure management during CPB, which is primarily pump flow driven, MAP regulation of the patients from induction of anesthesia until surgical opening and during resuscitation after removal of the pump is generally attributable to anesthesiologic management [Citation50,Citation51]. In this period, the anesthetists could control the blood pressure as much as possible above the target threshold and avoid prolonged hypotension by resorting to strategies such as enhancing cardiac function, maintaining electrolyte balance, addressing anemia, and eliminating allergies [Citation52]. Therefore, giving anesthetists more specific advice on maintaining intraoperative blood pressure is essential for successful early prophylactic intervention for AKI. Coincidentally, the SHAP summary plot from our study demonstrates that the duration of hypotension outside CPB (MAP < 65 mmHg) is a significant predictor of postoperative AKI. This finding was consistent with the studies reported by de la Hoz et al. [Citation53] and Ngu et al. [Citation54]. Our prediction model alerts clinicians to pay more attention to hemodynamic changes outside CPB in TA-AAD patients. This may be due to the fact that most patients are prone to ischemic reperfusion injury after CPB and further deteriorate cardiac function, with a consequent higher probability of hypotensive events [Citation55]. In particular, there is a need for heightened early warning when faced with special cases, as their blood pressure tends to be more uncontrollable.
Specifically, the multivariate analysis indicated that urine output, blood transfusion and medication should be valued as management wind vane within the window for effective intervention. Of these, in line with the published findings of Tseng et al. [Citation48], intraoperative urine output was the most influential feature, with lower output tending to imply progressive deterioration in renal blood flow and renal perfusion pressure [Citation56]. This also explains well why diuretics (i.e. furosemide) are not only considered to be an accumulation of nephrotoxicity, but also a marker of the patient’s acute responses. Compared to the cohort without AKI, the AKI population always received greater amounts of autologous blood transfusion during the procedure, reflecting the fact that the AKI population tends to have more intraoperative bleeding, poorer renal perfusion, and that transfusion of blood products such as red blood cells, platelets and cold precipitation contribute to renal hemodynamic disturbances after CPB [Citation57–59], which in turn also aggravate the kidney injury. The inclusion of norepinephrine dose as a risk factor in the prediction model was surprising, as most studies have highlighted its positive effect on blood pressure regulation [Citation60–62], even in the Randomized Clinical Trial (RCT) by Futier et al. [Citation63] where all patients used norepinephrine to maintain a high MAP. However, on the one hand, the dependency on norepinephrine precisely indicates that the patient suffers from prolonged hypotension; on the other hand, high-dose infusions of vasopressors may lead to impaired renal oxygenation and enhanced renal oxygen consumption, disrupting the supply-demand balance and exacerbating the development of AKI [Citation64,Citation65].
Finally, in addition to targeted optimization of intraoperative management strategies, the complete model we have developed includes preoperative information about patient smoking. The findings show that smoking is positively associated with post-operative AKI, suggesting that patients should take earlier cessation actions and receive more subtle care.
The optimization of the performance of predictive models with the benefit of artificial intelligence technology cannot be overstated. By calculating and comparing evaluation metrics such as AUROC in the testing set and observing the DCA, it was not hard to see that the gradient boosting technique showed significant advantages over classical logistic regression modeling approaches. Especially in the case of limited sample size or unbalanced data sets, the XGboost algorithm, as a structurally optimized and widely recognized ensemble classifier, differs from a simple single decision tree in that it avoids the pitfalls of misclassification and prediction bias, thereby effectively preventing over- or under-fitting events and providing guarantee for the accuracy and generalization of prediction results [Citation66,Citation67]. In addition, when the predictive model is practiced at the actual bedside, clinical experts often devote their attention to whether it enables timely and accurate risk stratification of patients as a decision-making tool to aid post-operative management. In our study, the high sensitivity of 0.737 meant that approximately one-quarter of patients with confirmed AKI were not identified early enough to be at high risk (i.e. a false negative rate of 26.3%), potentially affecting them in achieving a favorable prognosis. However, this is within an acceptable well range. Another ‘stumbling block’ that prevents the ML model from being widely used is the lack of reasonable explanations for a range of issues, including which variable has the greatest ability to predict outcomes. To this end, we introduce the SHAP method [Citation68,Citation69], adding the relevant SHAP summary plots and dependence scatter plots, clarifying whether the contribution from each factor is positive or negative. With the visual ‘white box’ model we provide, it is expected to successfully address the concerns of clinicians in weighing the robustness and interpretability of the XGboost model.
There are some potential limitations of our study to be addressed in future work. Firstly, similar to many retrospective studies, the data in this study were collected based on a single Chinese tertiary hospital and the sample source may not be as perfect as a multicenter study; however, our database contains intraoperative dynamic continuous blood pressure variables at 5-min intervals for each patient in the cohort that were not available in any other study [Citation70], and our sample selection has screened out patients who were managed therapeutically by non-international standards, which will provide as much assurance as possible regarding the reliability of the data source. In addition, multiple interpolation techniques have been used to deal with individual missing values. Secondly, Aortic dissection undergoing CPB is a complex and high-risk procedure, and intraoperative management and postoperative care strategies often remain variable, especially in some developing countries where advanced first-class medical systems are lacking. Furthermore, it is an inherent problem in many studies that the models constructed on the basis of the same race do not represent the entire population, with uncertain extrapolation results [Citation71–73]. Therefore, while considering the stability of external validation of models, we should encourage support for each region or center to tailor predictive models to its actual specific setting to facilitate individualized bedside management. Thirdly, the graded results of AKI were not defined using postoperative urine output. However, high-risk patients with significant oliguria can be successfully identified utilizing serum creatinine criteria. Moreover, given the close monitoring of cardiac surgery and the role of diuretics, significant fluctuations in urine output are less likely to be observed, and their strength in determining clinical outcomes may be much less than that of creatinine values [Citation74]. Finally, in light of the higher incidence of AKI that distinguishes TA-AAD from other cardiac procedures, our study only targeted consideration of these more deserving patients, which may not accurately predict postoperative outcomes for other cardiac surgery.
Conclusion
This study provides a sensitive predictive model (XGBoost) of AKI risk for patients undergoing TA-AAD repair based on ML technology combined with intraoperative temporal variables, which is expected to enable the focused transfer of valuable close monitoring resources to positive patients and greatly facilitate the precise implementation of personalized bedside care. Also, it was observed that the development of AKI was duration-dependent with intraoperative MAP < 65 mmHg, suggesting that clinicians should pay attention to perioperative hemodynamic management goals to help improve the patient’s prognosis for renal function. In the future, for the above findings, apart from external validation in multicenter cohorts, we will confirm the performance of the constructed model in different AKI classifications and attempt to compare the changes of the screened predictors in different disease courses.
Authors contributions
AD, ZZ and FJ contributed equally to this work. AD and ZZ conceived and designed the study. AD, FJ, YG and YF obtained, cleaned the dataset. AD performed the data analysis and produced graphs. ZZ provided a review of the previous literature. AD, ZZ and FJ wrote the manuscript. DA, CC and KH polished this article. YS, HS and JZ supervised the whole process. All authors contributed to manuscript revision, read, and approved the submitted version.
Ethical approval
The study involving human participants was reviewed and approved by the Ethics Committee of Nanjing First Hospital, with the need for individual patient consent waived. (Protocol code: KY20221122-01-KS-01).
Consent form
Not applicable.
Supplemental Material
Download MS Word (28.6 KB)Disclosure statement
No potential conflict of interest was reported by the author(s).
Data availability statement
The original contributions presented in the study are included in the article and Supplementary Material. Further data that support the findings of this study are available from the corresponding author on reasonable request.
Additional information
Funding
References
- Wang Y, Bellomo R. Cardiac surgery-associated acute kidney injury: risk factors, pathophysiology and treatment. Nat Rev Nephrol. 2017;13(11):1–14. doi: 10.1038/nrneph.2017.119.
- Elsayed RS, Cohen RG, Fleischman F, et al. Acute type a aortic dissection. Cardiol Clin. 2017;35(3):331–345. doi: 10.1016/j.ccl.2017.03.004.
- Howard DPJ, Banerjee A, Fairhead JF, et al. Population-based study of incidence and outcome of acute aortic dissection and premorbid risk factor control: 10-year results from the oxford vascular study. Circulation. 2013;127(20):2031–2037. doi: 10.1161/CIRCULATIONAHA.112.000483.
- Helgason D, Helgadottir S, Ahlsson A, et al. Acute kidney injury after acute repair of type a aortic dissection. Ann Thorac Surg. 2021;111(4):1292–1298. doi: 10.1016/j.athoracsur.2020.07.019.
- Evangelista A, Isselbacher EM, Bossone E, et al. Insights from the international registry of acute aortic dissection: a 20-Year experience of collaborative clinical research. Circulation. 2018;137(17):1846–1860. doi: 10.1161/CIRCULATIONAHA.117.031264.
- Chawla LS, Bellomo R, Bihorac A, et al. Acute kidney disease and renal recovery: consensus report of the acute disease quality initiative (ADQI) 16 workgroup. Nat Rev Nephrol. 2017;13(4):241–257. doi: 10.1038/nrneph.2017.2.
- Najafi M, Goodarzynejad H, Karimi A, et al. Is preoperative serum creatinine a reliable indicator of outcome in patients undergoing coronary artery bypass surgery? J Thorac Cardiovasc Surg. 2009;137(2):304–308. doi: 10.1016/j.jtcvs.2008.08.001.
- Kim WH, Lee SM, Choi JW, et al. Simplified clinical risk score to predict acute kidney injury after aortic surgery. J Cardiothorac Vasc Anesth. 2013;27(6):1158–1166. doi: 10.1053/j.jvca.2013.04.007.
- Dong N, Piao H, Du Y, et al. Development of a practical prediction score for acute renal injury after surgery for stanford type a aortic dissection. Interact Cardiovasc Thorac Surg. 2020;30(5):746–753. doi: 10.1093/icvts/ivaa011.
- Luo C, Zhong Y, Qiao Z, et al. Development and validation of a nomogram for postoperative severe acute kidney injury in acute type a aortic dissection. JGC. 2022;19:734–742.
- Zhang Y, Lan Y, Chen T, et al. Prediction of acute kidney injury for acute type a aortic dissection patients who underwent sun’s procedure by a perioperative nomogram. Cardiorenal Med. 2022;12(3):117–130. doi: 10.1159/000524907.
- Li X, Wang Z, Huang X, et al. Prediction model of acute kidney injury after different types of acute aortic dissection based on machine learning. Front Cardiovasc Med. 2022;9:984772. doi: 10.3389/fcvm.2022.984772.
- Cuocolo R, Caruso M, Perillo T, et al. Machine learning in oncology: a clinical appraisal. Cancer Lett. 2020;481:55–62. doi: 10.1016/j.canlet.2020.03.032.
- Krittanawong C, Zhang H, Wang Z, et al. Artificial intelligence in precision cardiovascular medicine. J Am Coll Cardiol. 2017;69(21):2657–2664. doi: 10.1016/j.jacc.2017.03.571.
- Bzdok D, Meyer-Lindenberg A. Machine learning for precision psychiatry: opportunities and challenges. Biol Psychiatry Cogn Neurosci Neuroimaging. 2018;3(3):223–230. doi: 10.1016/j.bpsc.2017.11.007.
- Jordan MI, Mitchell TM. Machine learning: trends, perspectives, and prospects. Science. 2015;349(6245):255–260. doi: 10.1126/science.aaa8415.
- Beam AL, Kohane IS. Big data and machine learning in health care. JAMA. 2018;319(13):1317–1318. doi: 10.1001/jama.2017.18391.
- Filiberto AC, Loftus TJ, Elder CT, et al. Intraoperative hypotension and complications after vascular surgery: a scoping review. Surgery. 2021;170(1):311–317. doi: 10.1016/j.surg.2021.03.054.
- Levey AS, Stevens LA, Schmid CH, et al. A new equation to estimate glomerular filtration rate. Ann Intern Med. 2009;150(9):604–612. doi: 10.7326/0003-4819-150-9-200905050-00006.
- Levin A, Stevens PE. Summary of KDIGO 2012 CKD guideline: behind the scenes, need for guidance, and a framework for moving forward. Kidney Int. 2014;85(1):49–61. doi: 10.1038/ki.2013.444.
- Favia I, Vitale V, Ricci Z. The Vasoactive-Inotropic score and Levosimendan: time for LVIS? J Cardiothorac Vasc Anesth. 2013;27(2):e15–e16. doi: 10.1053/j.jvca.2012.11.009.
- Monk TG, Bronsert MR, Henderson WG, et al. Association between intraoperative hypotension and hypertension and 30-day postoperative mortality in noncardiac surgery. Anesthesiology. 2015;123(2):307–319. doi: 10.1097/ALN.0000000000000756.
- Epstein RH, Dexter F, Schwenk ES. Hypotension during induction of anaesthesia is neither a reliable nor a useful quality measure for comparison of anaesthetists’ performance. Br J Anaesth. 2017;119(1):106–114. doi: 10.1093/bja/aex153.
- Khwaja A. KDIGO clinical practice guidelines for acute kidney injury. Nephron Clin Pract. 2012;120(4):c179–84. doi: 10.1159/000339789.
- Vasquez MM, Hu C, Roe DJ, et al. Least absolute shrinkage and selection operator type methods for the identification of serum biomarkers of overweight and obesity: simulation and application. BMC Med Res Methodol. 2016;16(1):154. doi: 10.1186/s12874-016-0254-8.
- DeLong ER, DeLong DM, Clarke-Pearson DL. Comparing the areas under two or more correlated receiver operating characteristic curves: a nonparametric approach. Biometrics. 1988;44(3):837–845.
- Van Calster B, Wynants L, Verbeek JFM, et al. Reporting and interpreting decision curve analysis: a guide for investigators. Eur Urol. 2018;74(6):796–804. doi: 10.1016/j.eururo.2018.08.038.
- Shalabi LA, Shaaban Z. Normalization as a preprocessing engine for data mining and the approach of preference matrix. International Conference on Dependability of Computer Systems [Internet]. 2006 [cited 2023 May 18]. http://ieeexplore.ieee.org/document/4024051/.
- Okada S, Ohzeki M, Taguchi S. Efficient partition of integer optimization problems with one-hot encoding. Sci Rep. 2019;9(1):13036. doi: 10.1038/s41598-019-49539-6.
- Quinn KN, Wilber H, Townsend A, et al. Chebyshev approximation and the global geometry of model predictions. Phys Rev Lett. 2019;122(15):158302. doi: 10.1103/PhysRevLett.122.158302.
- Altman NS. An introduction to kernel and Nearest-Neighbor nonparametric regression. The American Statistician. 1992;46:175–185.
- Palevsky PM, Liu KD, Brophy PD, et al. KDOQI US commentary on the 2012 KDIGO clinical practice guideline for acute kidney injury. Am J Kidney Dis. 2013;61(5):649–672. doi: 10.1053/j.ajkd.2013.02.349.
- Parolari A, Pesce LL, Pacini D, et al. Risk factors for perioperative acute kidney injury after adult cardiac surgery: role of perioperative management. Ann Thorac Surg. 2012;93(2):584–591. doi: 10.1016/j.athoracsur.2011.09.073.
- Walsh M, Devereaux PJ, Garg AX, et al. Relationship between intraoperative mean arterial pressure and clinical outcomes after noncardiac surgery: toward an empirical definition of hypotension. Anesthesiology. 2013;119(3):507–515. doi: 10.1097/ALN.0b013e3182a10e26.
- Sun LY, Wijeysundera DN, Tait GA, et al. Association of intraoperative hypotension with acute kidney injury after elective noncardiac surgery. Anesthesiology. 2015;123(3):515–523. doi: 10.1097/ALN.0000000000000765.
- van Waes JAR, van Klei WA, Wijeysundera DN, et al. Association between intraoperative hypotension and myocardial injury after vascular surgery. Anesthesiology. 2016;124(1):35–44. doi: 10.1097/ALN.0000000000000922.
- Bijker JB, Persoon S, Peelen LM, et al. Intraoperative hypotension and perioperative ischemic stroke after general surgery: a nested case-control study. Anesthesiology. 2012;116(3):658–664. doi: 10.1097/ALN.0b013e3182472320.
- Drummond JC. The lower limit of autoregulation: time to revise our thinking? Anesthesiology. 1997;86(6):1431–1433. doi: 10.1097/00000542-199706000-00034.
- Forni LG, Joannidis M. Blood pressure deficits in acute kidney injury: not all about the mean arterial pressure? Crit Care. 2017;21(1):102. doi: 10.1186/s13054-017-1683-4.
- Busse LW, Ostermann M. Vasopressor therapy and blood pressure management in the setting of acute kidney injury. Semin Nephrol. 2019;39(5):462–472. doi: 10.1016/j.semnephrol.2019.06.006.
- Ono M, Brady K, Easley RB, et al. Duration and magnitude of blood pressure below cerebral autoregulation threshold during cardiopulmonary bypass is associated with major morbidity and operative mortality. J Thorac Cardiovasc Surg. 2014;147(1):483–489. doi: 10.1016/j.jtcvs.2013.07.069.
- Evans L, Rhodes A, Alhazzani W, et al. Surviving sepsis campaign: international guidelines for management of sepsis and septic shock 2021. Intensive Care Med. 2021;47(11):1181–1247. doi: 10.1007/s00134-021-06506-y.
- Azau A, Markowicz P, Corbeau JJ, et al. Increasing mean arterial pressure during cardiac surgery does not reduce the rate of postoperative acute kidney injury. Perfusion. 2014;29(6):496–504. doi: 10.1177/0267659114527331.
- McEwen CC, Amir T, Qiu Y, et al. Morbidity and mortality in patients managed with high compared with low blood pressure targets during on-pump cardiac surgery: a systematic review and meta-analysis of randomized controlled trials. Can J Anaesth. 2022;69(3):374–386. doi: 10.1007/s12630-021-02171-3.
- Chen L, Hong L, Ma A, et al. Intraoperative venous congestion rather than hypotension is associated with acute adverse kidney events after cardiac surgery: a retrospective cohort study. Br J Anaesth. 2022;128(5):785–795. doi: 10.1016/j.bja.2022.01.032.
- Sessler DI, Bloomstone JA, Aronson S, et al. Perioperative quality initiative consensus statement on intraoperative blood pressure, risk and outcomes for elective surgery. Br J Anaesth. 2019;122(5):563–574. doi: 10.1016/j.bja.2019.01.013.
- Vandenberghe W, Bové T, De Somer F, et al. Impact of mean perfusion pressure and vasoactive drugs on occurrence and reversal of cardiac surgery-associate acute kidney injury: a cohort study. J Crit Care. 2022;71:154101. doi: 10.1016/j.jcrc.2022.154101.
- Tseng P-Y, Chen Y-T, Wang C-H, et al. Prediction of the development of acute kidney injury following cardiac surgery by machine learning. Crit Care. 2020;24(1):478. doi: 10.1186/s13054-020-03179-9.
- Zeger SL, Irizarry R, Peng RD. On time series analysis of public health and biomedical data. Annu Rev Public Health. 2006;27(1):57–79. doi: 10.1146/annurev.publhealth.26.021304.144517.
- Sun LY, Chung AM, Farkouh ME, et al. Defining an Intraoperative Hypotension Threshold in Association with Stroke in Cardiac Surgery. Anesthesiology. 2018;129(3):440–447. doi: 10.1097/ALN.0000000000002298.
- Löffel LM, Bachmann KF, Furrer MA, et al. Impact of intraoperative hypotension on early postoperative acute kidney injury in cystectomy patients – a retrospective cohort analysis. J Clin Anesth. 2020;66:109906. doi: 10.1016/j.jclinane.2020.109906.
- Karamchandani K, Dave S, Hoffmann U, et al. Intraoperative arterial pressure management: knowns and unknowns. Br J Anaesth. 2023;131(3):445–451. doi: 10.1016/j.bja.2023.05.027.
- De La Hoz MA, Rangasamy V, Bastos AB, et al. Intraoperative hypotension and acute kidney injury, stroke, and mortality during and outside cardiopulmonary bypass: a retrospective observational cohort study. Anesthesiology. 2022;136(6):927–939. doi: 10.1097/ALN.0000000000004175.
- Ngu JMC, Jabagi H, Chung AM, et al. Defining an intraoperative hypotension threshold in association with De novo renal replacement therapy after cardiac surgery. Anesthesiology. 2020;132(6):1447–1457. doi: 10.1097/ALN.0000000000003254.
- Jain U. Myocardial ischemia after cardiopulmonary bypass. J Card Surg. 1995;10(4 Suppl):520–526. doi: 10.1111/j.1540-8191.1995.tb00688.x.
- Demirjian S, Schold JD, Navia J, et al. Predictive models for acute kidney injury following cardiac surgery. Am J Kidney Dis. 2012;59(3):382–389. doi: 10.1053/j.ajkd.2011.10.046.
- Liu Y, Shang Y, Long D, et al. Intraoperative blood transfusion volume is an independent risk factor for postoperative acute kidney injury in type a acute aortic dissection. BMC Cardiovasc Disord. 2020;20(1):446. doi: 10.1186/s12872-020-01727-3.
- Lee H-C, Yoon H-K, Nam K, et al. Derivation and validation of machine learning approaches to predict acute kidney injury after cardiac surgery. J Clin Med. 2018;7(10):322. doi: 10.3390/jcm7100322.
- Ng SY, Sanagou M, Wolfe R, et al. Prediction of acute kidney injury within 30 days of cardiac surgery. J Thorac Cardiovasc Surg. 2014;147(6):1875–1883.e1. doi: 10.1016/j.jtcvs.2013.06.049.
- Joannidis M, Druml W, Forni LG, et al. Prevention of acute kidney injury and protection of renal function in the intensive care unit. Expert opinion of the working group for nephrology, ESICM. Intensive Care Med. 2010;36(3):392–411. doi: 10.1007/s00134-009-1678-y.
- Redfors B, Bragadottir G, Sellgren J, et al. Effects of norepinephrine on renal perfusion, filtration and oxygenation in vasodilatory shock and acute kidney injury. Intensive Care Med. 2011;37(1):60–67. doi: 10.1007/s00134-010-2057-4.
- Di Giantomasso D, Morimatsu H, May CN, et al. Intrarenal blood flow distribution in hyperdynamic septic shock: effect of norepinephrine. Crit Care Med. 2003;31(10):2509–2513. doi: 10.1097/01.CCM.0000084842.66153.5A.
- Futier E, Lefrant J-Y, Guinot P-G, et al. Effect of individualized vs standard blood pressure management strategies on postoperative organ dysfunction among high-risk patients undergoing major surgery: a randomized clinical trial. JAMA. 2017;318(14):1346–1357. doi: 10.1001/jama.2017.14172.
- Bragadottir G, Redfors B, Nygren A, et al. Low-dose vasopressin increases glomerular filtration rate, but impairs renal oxygenation in post-cardiac surgery patients. Acta Anaesthesiol Scand. 2009;53(8):1052–1059. doi: 10.1111/j.1399-6576.2009.02037.x.
- Vedel AG, Holmgaard F, Rasmussen LS, et al. High-Target versus Low-Target blood pressure management during cardiopulmonary bypass to prevent cerebral injury in cardiac surgery patients: a randomized controlled trial. Circulation. 2018;137(17):1770–1780. doi: 10.1161/CIRCULATIONAHA.117.030308.
- Chen T, Guestrin C. XGBoost: a scalable tree boosting system. Proceedings of the 22nd ACM SIGKDD International Conference on Knowledge Discovery and Data Mining [Internet]. San Francisco California USA: ACM; 2016. p. 785–94. [cited 2023 May 12]. https://dl.acm.org/doi/10.1145/2939672.2939785.
- Sheridan RP, Wang WM, Liaw A, et al. Extreme gradient boosting as a method for quantitative structure–activity relationships. J Chem Inf Model. 2016;56(12):2353–2360. doi: 10.1021/acs.jcim.6b00591.
- Štrumbelj E, Kononenko I. Explaining prediction models and individual predictions with feature contributions. Knowl Inf Syst. 2014;41(3):647–665. doi: 10.1007/s10115-013-0679-x.
- Lundberg S, Lee S-I. A unified approach to interpreting model predictions [Internet]. arXiv; 2017 [cited 2022 Sep 29]. http://arxiv.org/abs/1705.07874.
- Meyer A, Zverinski D, Pfahringer B, et al. Machine learning for real-time prediction of complications in critical care: a retrospective study. Lancet Respir Med. 2018;6(12):905–914. doi: 10.1016/S2213-2600(18)30300-X.
- Jiang W, Xu J, Shen B, et al. Validation of four prediction scores for cardiac surgery-associated acute kidney injury in Chinese patients. Braz J Cardiovasc Surg. 2017;32(6):481–486. doi: 10.21470/1678-9741-2017-0116.
- Pannu N, Graham M, Klarenbach S, et al. A new model to predict acute kidney injury requiring renal replacement therapy after cardiac surgery. CMAJ. 2016;188(15):1076–1083. doi: 10.1503/cmaj.151447.
- Echarri G, Duque-Sosa P, Callejas R, et al. External validation of predictive models for acute kidney injury following cardiac surgery: a prospective multicentre cohort study. Eur J Anaesthesiol. 2017;34(2):81–88. doi: 10.1097/EJA.0000000000000580.
- Md Ralib A, Pickering JW, Shaw GM, et al. The urine output definition of acute kidney injury is too liberal. Crit Care. 2013;17(3):R112. doi: 10.1186/cc12784.