
Abstract
Purpose
This study aimed to develop a postoperative MRI-based fibrosis scoring system and to assess its correlation with anorectal function in locally advanced rectal cancer (LARC) cases administered neoadjuvant chemoradiotherapy (nCRT).
Methods
Pathologically confirmed LARC cases administered nCRT and radical resection were assessed retrospectively. Based on postoperative magnetic resonance imaging (MRI) findings, anastomotic fibrosis score (AFS) and perirectal fibrosis score (PFS) were determined to evaluate the extent of fibrosis. The Wexner continence score for anorectal function was obtained 2 years postoperatively and assessed for correlation with MRI fibrosis scores. The cases were divided into 2 groups by the median Wexner score. Univariable and multivariable analyses were adopted for building a nomogram model, whose diagnostic performance was estimated by receiver operating characteristic (ROC) and decision curve analyses (DCA).
Results
Finally, 144 patients with LARC were included in cohort 1 (training set). 52 patients were enrolled in cohort 2 (external validation set). Spearman correlation analysis indicated that AFS and PFS were positively correlated with the Wexner score. Univariable and multivariable analyses revealed age, tumor height, AFS, and PFS were independent predictors of anorectal function. The nomogram model achieved a good diagnostic performance, with AUCs of 0.800 and 0.827 in the training and validation sets, respectively; its predicting value was also confirmed by DCA.
Conclusion
The present study showed AFS and PFS derived from postoperative MRI are positively correlated with Wexner score. In addition, the new scoring system was effective in predicting anorectal function in LARC cases administered nCRT.
Introduction
Neoadjuvant chemoradiotherapy (nCRT) is broadly used for improving patient outcome in locally advanced rectal cancer (LARC) [Citation1]. As nCRT is associated with improved local control, low toxicity, high tolerance, elevated resectability rate and high incidence of sphincter preservation [Citation2–6], it is recommended as the therapy of choice for LARC [Citation1,Citation7].
However, chemoradiotherapy may lead to impaired anorectal and/or bowel functions following sphincter-sparing surgery, reflected by multiple symptoms such as fecal incontinence, elevated defecation frequency and emptying troubles [Citation8]. Although the underlying mechanisms remain elusive, possible causes include damage to the external anal sphincter and radiotherapy-induced fibrosis [Citation9]. Therapy-associated fibrosis constitutes a serious long-term complication caused by persistent activation of myofibroblasts and hyperplastic remodeling of the extracellular matrix. It might lead to multiple clinical manifestations and impaired quality of life [Citation10,Citation11].
In clinical practice, Wexner continence score use is common in bowel function evaluation following rectal cancer (RC) surgery, as the commonest approach for assessing fecal incontinence [Citation12–14]. The Wexner questionnaire examines the frequencies of 3 fecal incontinence types, including solid, liquid and gas, as well as the respective consequences such as pad wearing and lifestyle changes. However, no feasible scoring system is available to describe the extent of therapy-induced fibrosis and the relationship with anorectal function based on the imaging approach.
Therefore, this study aimed to develop a postoperative imaging-based fibrosis scoring system and to investigate its correlation with the Wexner continence score. Accordingly, the applicability of this system in predicting anorectal function in LARC cases administered nCRT was examined with an external validation set.
Material and methods
Participants
Individuals administered nCRT and radical resection for LARC at Shanghai Changhai Hospital and Fudan University Shanghai Cancer Center between January 2018 and May 2021 were retrospectively enrolled in the training and validation sets, respectively. The trial followed the Declaration of Helsinki and had approval from the local Institutional Review Boards (Committee on Ethics of Biomedicine of Changhai Hospital, registration ID No. 8686; Committee on Ethics of Biomedicine of Fudan University Shanghai Cancer Center, registration ID 220718). Written informed consent was obtained from all patients before commencing the study.
Inclusion criteria were: (1) pathologically confirmed rectal adenocarcinoma; (2) LARC (TNM stage II–III) treated with nCRT; (3) distal margin of rectal cancer ≤10 cm from the anal verge as determined by rectal magnetic resonance imaging (MRI); (4) radical resection of RC; (5) sphincter-preserving surgery, with or without preventive ileostomy; (6) a follow-up for at least two years, with routine MRI performed in the first year after radical excision.
Exclusion criteria were: (1) local recurrence within the follow-up period after surgery; (2) residual tumor; (3) follow-up period of less than 2 years or unavailable Wexner continence score; (4) synchronous or metachronous distant metastasis; (5) administration of postoperative radiotherapy; (6) poor image quality; (7) impossible ileostomy reversal; (8) history of other pelvic tumors.
Preoperative CRT and operation
Preoperative CRT was performed by 3D-conformal radiotherapy, totally applying 50.0 Gy in daily fractions of 2.0 Gy. A capecitabine monotherapy regimen was selected for the concurrent chemotherapy. Preoperative CRT and the surgical operation were generally separated by 6–8 weeks. All RC operations were performed by experienced chief surgeons, with annual RC operation volume >100 cases. Resection (circumferential, proximal, and distal) margins were defined as positive with cancer cells detected at 1 mm or less nearby.
Image acquisition
Routine postoperative MRI was carried out approximately 1 year after radical excision, using a 3.0 T or 1.5 T MR scanner with an abdominal phase array coil. After a 4-h fasting, patients underwent rectal cleaning with 20 ml of glycerin prior to rectal MR scanning. Raceanisodamine hydrochloride was not utilized because of potential contraindications. Rectal gel contrast was not standard practice at our hospital for rectal MRIs, and its use was waived to prevent potential overfilling in this study. The rectal MRI sequences included: sagittal T2-weighted imaging (T2WI); oblique-axial high-resolution T2WI without fat suppression, oriented parallel to the anastomosis as defined on sagittal T2WI; axial diffusion-weighted imaging (DWI), with a b value of 0 (1000 s/mm2); axial T1-weighted imaging (T1WI); sagittal, coronal and axial gadolinium contrast-enhanced T1WI (CE-T1WI). The main sequences are described in Supplemental Table 1.
Definitions of anastomotic fibrosis score (AFS) and perirectal fibrosis score (PFS)
To assess postoperative fibrosis at the anastomosis, perirectal area and pelvis, two new MR fibrosis scoring scales were proposed mainly based on postoperative high-resolution oblique-axial high-resolution T2WI images, including anastomotic fibrosis score (AFS) and perirectal fibrosis score (PFS). DWI and CE-T1WI were also taken into consideration in the pattern of each scoring scale.
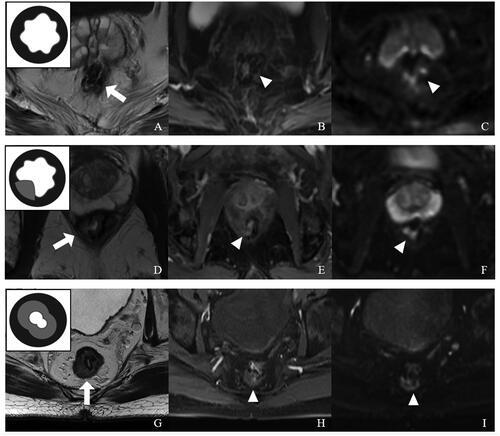
AFS was used to describe the extent of fibrosis or scar proliferation at the anastomosis site. The anastomotic fibrosis or scar tissue is an inner thick layer or nodular focus of homogeneous intermediate-low signal intensity, with or without anastomotic stenosis. AFS ranged from 0 to 2 (), with each value representing a particular condition: 0, thickened scar occupying <1/3 of the anastomosis; 1, thickened scar occupying 1/3–2/3 of the anastomosis; 2, thickened scar occupying >2/3 of the anastomosis.
Figure 1. Representative images for distinct anastomotic fibrosis score (AFS) values with a schematic diagram (top left corner) based on postoperative rectal MRI. (A–C) AFS = 0. (A) T2WI showing a low-signal intensity anastomosis around the rectal wall without fibrosis (arrow), Covered by normal mucosa. (B) In CE-T1WI, no obvious abnormal enhancement was found at the anastomotic site (arrowhead). (C) DWI (b = 1000 s/mm2) showing a low-signal anastomosis with partially high-signal intensity susceptibility artifacts (arrowhead). (D–F) AFS = 1. (D) In T2WI, the anastomosis had some thickened fibrotic tissue at the right posterior rectal wall (<1/3 circle, arrow). (E) CE-T1WI showing homogeneous enhancement from mild to moderate at the partially thickening anastomotic site (arrowhead). (F) DWI (b = 1000 s/mm2) showing a low-signal anastomosis with partially high-signal intensity susceptibility artifacts (arrowhead). (G–I) AFS = 2. (G) T2WI showing a full-circle thick layer of homogeneous intermediate-low signal intensity (>2/3 circle, arrow), with anastomotic stenosis. (H) CE-T1WI showing mild to moderate enhanced proliferation tissue at the anastomotic site (arrowhead). (I) DWI (b = 1000 s/mm2) showing partially high-signal intensity susceptibility artifacts (arrowhead).
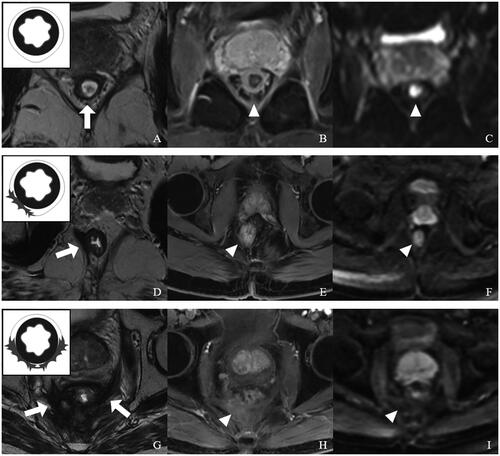
PFS was utilized to describe the extent of fibrosis and adhesion in the following three parts of the pelvis: (1) peri-anastomotic area, (2) presacral area and (3) pelvic wall. The postoperative perirectal-regional fibrotic tissue typically showed low-signal intensity on T2WI that included irregular linear or fibrous appearances, with or without adhesion of surrounding tissues. PFS also ranged from 0 to 2 (), with each value representing a particular condition: 0, no perirectal fibrosis or adhesion; 1, fibrosis and adhesion limited to one part of the pelvis; 2, fibrosis and adhesion detected in more than one part of the pelvis.
Figure 2. Representative images for distinct perirectal fibrosis score (PFS) values with a schematic diagram (top left corner) based on postoperative rectal MRI. (A–C) PFS = 0. (A) T2WI showing no perirectal fibrosis and adhesion in the peri-anastomotic area (arrow), presacral area and pelvic wall. (B) CE-T1WI showing no obvious abnormal enhancement (arrowhead). (C) There was no significant diffusion-limited high-signal intensity at the perirectal area in DWI (b = 1000 s/mm2). (D–F) PFS = 1. (D) T2WI showing fibrosis and adhesion at the right levator ani Muscle (arrow). (E) In CE-T1WI, the surrounding scar tissue had mild enhancement (arrowhead). (F) DWI (b = 1000 s/mm2) showing no diffusion-limited signal intensity at the fibrosis and adhesion area (arrowhead). (G–I) PFS = 2. (G) Extensive fibrosis and adhesion at the peri-anastomotic area, presacral area and pelvic wall on oblique-axial T2WI (arrow). (H) CE-T1WI showing mild to moderate enhancement in surrounding fibrosis and adhesion tissue (arrow). (I) There was no significant diffusion-limited high-signal intensity at the perirectal area in DWI (arrowhead).
MR fibrosis scores were evaluated by 3 radiology specialists (Shuai Li, Hai Di Lu and Yuan Yuan with 8, 10 and 11 years of experience in medical imaging, respectively), in a blinded manner. Systematic training before the assessment was referred to the MR fibrosis scoring standards. The final judgement was made after discussion among these experts.
Follow-up
Follow-up was carried out at 3-month intervals during the initial 2 postoperative years, at 6-month intervals for the following 3 years and yearly afterwards. Colonoscopy was carried out yearly. Local recurrence was determined by biopsy if indicated, or based on continuous lesion enlargement or the presence of newly formed lesions. Distant metastasis was confirmed by chest CT and liver CE-MRI. The Wexner fecal incontinence score was assessed approximately 2 years after radical excision by the surgeon (Supplemental Table 2). The cases were divided into 2 groups by the median Wexner score.
Baseline patient data were obtained, e.g. age, sex, body mass index (BMI), tumor height (obtained by preoperative MRI), clinical and pathological TN-stage, tumor regression grade (TRG), ileostomy, and postoperative complications such as infection, bowel obstruction and anastomotic leak.
Nomogram model establishment
Clinical factors and fibrosis scores were evaluated by univariate logistic regression analysis in the training set. Parameters with p < .05 were subsequently combined to build a nomogram model by multivariate logistic regression analysis (p < .05) for anorectal function assessment. The obtained nomogram was evaluated for performance in each cohort.
Statistical analysis
The Kolmogorov-Smirnov test was carried out to assess continuous data for normality. Independent samples t test or a non-parametric test was performed to compare a given continuous variable, as appropriate. Categorical data were assessed by the χ2 test or Fisher’s exact test. Spearman’s correlation analysis was carried out to characterize the agreement between fibrosis scores and the Wexner score. The Kappa statistic was used to evaluate interobserver correlation between readers. The intraclass correlation coefficient (ICC) was used to evaluate consistency among the three readers. All parameters with p < .05 in univariable analysis were entered in the multivariable analysis to build a nomogram. ROC curve analysis was carried out to assess the nomogram’s performance by determining the AUC (area under the ROC curve), as well as sensitivity, specificity, accuracy, positive (PPV) and negative (NPV) predictive values, and positive (PLR) and negative (NLR) likelihood ratios. The nomogram’s goodness of fit was examined by the Hosmer-Lemeshow test. Decision curve analysis (DCA) was performed for determining the nomogram’s clinical utility by calculating its net benefits at various threshold probabilities. R v3.6.3 was used for nomogram analysis, while other data were analyzed using SPSS 22.0 (SPSS, USA) and MedCalc Statistical software v13.0.0.0 (MedCalc Software, Belgium). p < .05 was considered statistically significant.
Results
Clinicodemographic features
Totally 144 and 52 individuals with LARC administered nCRT were retrospectively analyzed in the training and validation sets, respectively. The median ages at diagnosis were 60 years (interquartile range [IQR]: 48–64) and 54 years (IQR: 47–61) in the respective cohorts.
Anal sphincter function was assessed, and the Wexner Fecal Incontinence Questionnaire was filled 2 years post-surgery. The median Wexner scores were 4 (IQR: 3–7) in both cohorts, ranging from 0 to 16, with only 8 cases scoring above 11. Patients were classified into two groups based on median Wexner score (threshold value of 4): Group 1 (score <4, no or mild symptom) and Group 2 (score ≥4, moderate to severe symptom). The median time of post-surgery rectal MR scanning was 12.2 (months (IQR: 10.9, 13.7), with a mean time of 12.3 ± 1.7 months. All resection margins were negative. Baseline clinicopathological parameters of the training and validation sets are presented in and Supplemental Table 3.
Table 1. Clinicopathological parameters, AFS and PFS in the training set.
Interobserver agreement for MR fibrosis scores
shows the interobserver agreement for AFS and PFS among the three readers. Kappa values for AFS ranged from 0.708 to 0.859 in the training cohort and from 0.786 to 0.941 in the validation cohort. For PFS, the Kappa values were between 0.851 and 0.909 in the training cohort and between 0.656 and 0.747 in the validation cohort. ICCs for AFS and PFS were 0.803 and 0.886 in the training set, and 0.864 and 0.720 in the validation set, respectively.
Table 2. Interobserver agreement for MR fibrosis scores in both cohorts.
Associations of AFS and PFS with Wexner score
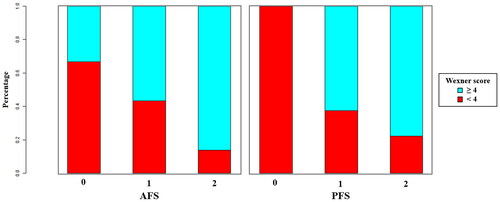
The Spearman correlation coefficient between AFS and Wexner score was 0.369 (p < .001) in the training set, while it was 0.246 (p < .001) between PFS and Wexner score. Compared with Group 1, significantly higher percentages of high AFS and PFS scores were found in Group 2 (all p < .001, ). In both cohorts, Wexner scores were significantly higher in the groups with high AFS and PFS scores (Supplemental Figure 1).
Figure 3. Relationships between MRI-based fibrosis scores and Wexner score. Compared with cases with Wexner scores <4, the percentages of high AFS and PFS scores were significantly higher in patients with Wexner scores ≥4 (all p < .001).
Factors associated with Wexner score
Univariable analysis showed that age, BMI, tumor height, postoperative complications, AFS and PFS were correlated with Wexner score in the training set (p < .05, ). Multivariable analysis revealed age [odds ratio (OR) = 0.954, 95% confidence interval (CI) 0.918–0.993; p = .020], tumor height (OR = 0.660, 95% CI 0.515–0.846; p = .001), AFS (OR = 2.336, 95% CI 1.020–5.349; p = .045) and PFS (OR = 3.167, 95% CI 1.457–6.885; p = .004) were independent predictors of Wexner score (). Similarly, in the external validation cohort, tumor height (OR = 0.494, 95% CI 0.267–914; p = .025), AFS (OR = 5.071, 95% CI 1.288–19.970; p = .020) and PFS (OR = 4.099, 95% CI 1.253–13.411; p = .020) remained as independent predictors of Wexner score (Supplemental Table 4).
Table 3. Logistic regression analysis for the risk factors of high Wexner score in the training set.
Performance of the nomogram model
A nomogram model () was constructed based on the regression formula: prediction probability = 2.861 − 0.049 × age − 0.424 × tumor height + 0.888 × AFS + 1.166 × PFS. AUCs for the nomogram model were 0.800 and 0.827 in the training and validation sets, respectively ( and ). Calibration of the model was satisfactory, as confirmed by the Hosmer-Lemeshow test for both the training (p = .169) and validation (p = .956) sets. The calibration curves (Supplemental Figure 2) demonstrated strong agreement between the predicted estimates and the actual Wexner scores. The simplified model revealed that age (≤ 50 years old), tumor height (≤ 5 cm), AFS (> 1) and PFS (> 1) were identified as risk factors for a high Wexner score (Supplemental Table 5 and Supplemental Figure 3). AUCs for the simplified model were 0.756 and 0.820 in the training and validation sets, respectively (Supplemental Table 6).
Figure 4. A nomogram model Combining clinical factors and fibrosis scores. In the nomogram, a vertical line was first drawn according to the value of the most influential factors to determine the corresponding numbers of points. The total points were the sum of the above points. Then, a vertical line was drawn according to the value of total points to determine the probability of high Wexner score.
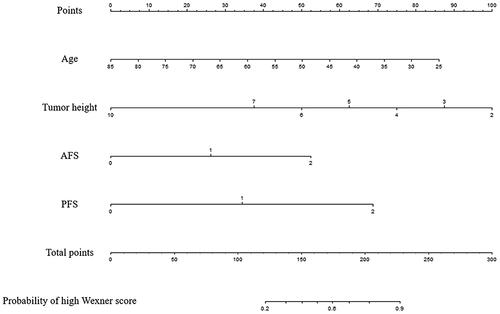
Figure 5. ROC curves for the training (A) and validation (B) sets.
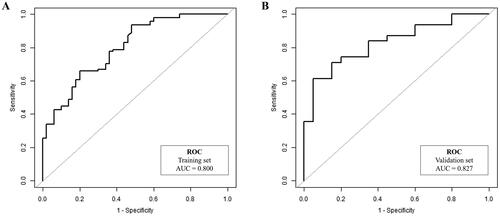
Table 4. ROC curve analysis in both cohorts.
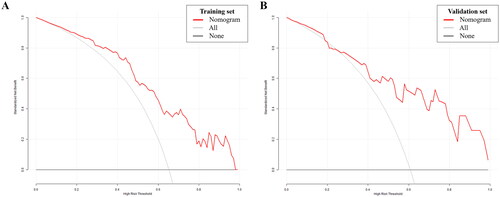
DCA of the nomogram model is presented in , illustrating that utilizing the developed model to predict the odds of a high Wexner score conferred a positive net benefit versus the all-or-none scheme at a large threshold probability in both cohorts.
Figure 6. Decision curve analysis. The x- and y-axes represent the threshold probability and standardized net benefit, respectively. The red line represents the prediction nomogram model; gray and black lines represent the assumptions that all and no patients had a risk of high Wexner score, respectively. (A) Training set; (B) Validation set.
Discussion
This study firstly introduced a postoperative MR scoring system, which combines components of fibrosis and/or scar at the anastomosis, perirectal area and pelvis. Our results demonstrated that AFS and PFS were positively correlated with the Wexner score. Univariable and multivariable analyses revealed age, tumor height, AFS and PFS were associated with worse anorectal function. We also evaluated the performance of the nomogram model for anorectal function in patients with LARC in this study.
Several studies have demonstrated that preoperative CRT may adversely affect anorectal function in LARC cases [Citation15–18]. A possible reason is that radiotherapy may induce fibrosis, leading to worse anorectal function. Secondly, preoperative CRT also impairs leukocyte production, reduces collagen accumulation and wound healing ability, and increases the incidence of postoperative infective complications and anastomotic leakage [Citation19]. Therefore, preoperative CRT results in a high incidence of preventive ileostomy. Another underlying mechanism is that radiotherapy may induce necrosis, adhesion, fibrosis and stenosis of the internal and external anal sphincter, puborectalis and levator ani muscles [Citation20–22], thereby impairing anorectal function.
The Wexner score is most widely utilized for assessing bowel function following RC surgery, as a convenient and easily understood tool for evaluating fecal incontinence [Citation13,Citation14]. The Wexner questionnaire was usually investigated at 2 years after radical excision of RC. However, throughout the preceding follow-up period, no reliable scale could assess anastomotic/pelvic fibrosis and anorectal function.
Currently, rectal MRI stands as a highly accurate and non-invasive method routinely employed for postoperative surveillance in surgical patients [Citation23,Citation24]. Particularly in the context of patients with LARC in China, rectal MRI is widely adopted to assess postoperative status. Although our institution also routinely employs rectal MRI for postoperative follow-up in rectal cancer patients, a comprehensive evaluation of fibrosis within the anastomosis, perirectal region, and pelvic area has not been discussed. Furthermore, no scoring system has investigated the extent of fibrosis and its association with anorectal function using imaging techniques.
Thus, the highlight of the current study is that an MR-based scoring system was firstly introduced to quantify radiotherapy-induced fibrosis in the anastomosis and perirectal area. To our knowledge, this is the first correlational study examining anastomotic/pelvic fibrosis with anorectal function. The impact of pelvic fibrosis on the contraction and relaxation of the levator ani muscles could lead to anal stricture and consequent fecal incontinence. Moreover, incomplete anal stricture can directly result in fecal incontinence by diminishing the volume and tolerance of the rectal cavity, consequently causing an increase in stool frequency and fecal incontinence. Consequently, interventions targeting pelvic fibrosis, such as anorectal dilation and transanal stricturoplasty, might offer relief from fecal incontinence. Patients anticipated to have fibrosis and compromised anorectal function according to our MRI-derived fibrosis scoring system could benefit from various interventions aimed at enhancing anorectal function, including digital anal dilation, endoscopic balloon dilatation, transanal endoscopic microsurgery (TEM), and pelvic floor rehabilitation.
The radiological presentation of postoperative changes was typical. On T2WI scans, the anastomosis is reflected by a low-signal intensity line around the rectal wall, with an outer regular or irregular and starkly hypointense layer that corresponds to the submucosal layer, with or without covering by the normal mucosa. Simultaneously, postoperative anastomosis fibrosis tissue or scar proliferation is an inner thick layer or nodular focus of homogeneous intermediate-low- signal intensity, which breaches or ruptures the hypointense layer, representing fibrotic scar tissue proliferation, with or without anastomotic stenosis. According to the degree of anastomotic fibrosis proliferation, a grading system was proposed as an anastomotic fibrosis score (AFS) that ranged from 0 to 2. AFS was positively correlated with the Wexner score; an underlying reason might be the occurrence of radiotherapy-induced postoperative complications, including infection and anastomotic leakage, which induce fibrosis and impair anorectal function.
Perirectal fibrosis refers to peri-anastomotic, presacral and pelvic wall fibrous tissue hyperplasia and adhesion. Follow-up MRI examination showed a rather well-defined postoperative presacral and perirectal area. The surrounding postoperative local-regional fibrosis tissue typically has a low-signal intensity on T2WI that included irregular linear or fibrous appearances. The perirectal fibrosis score (PFS) system was constructed by grading the level of perirectal fibrosis and adhesion, and scores ranged from 0 to 2. PFS was positively correlated with the Wexner score; a potential cause might be the radiotherapy-induced pelvic floor injuries of the internal and external anal sphincter, puborectalis and levator ani, thereby resulting in postoperative pelvic floor disorders.
The fibrotic tissue demonstrates low-signal intensity on DWI scans obtained at elevated b values. By contrast, a residual lesion or local recurrence has relatively elevated cell density, showing intense signals on DWI scans. In contrast-enhanced T1WI, homogeneous enhancement from mild to moderate was shown in the fibrotic tissue whereas local recurrence was obviously heterogeneously enhanced.
Nevertheless, this study does have certain limitations. First, it’s important to acknowledge that this was a relatively small-scale retrospective investigation. Selection and recall biases may have been present, especially since patients experiencing severe symptoms and recurrence might have been excluded. Additionally, the correlation coefficients for AFS/PFS and the Wexner score might appear modest. The possible reason is that both AFS and PFS may affect anal function in different dimensions, so neither of them could perfectly reflect anal function. Instead, the combination of AFS and PFS might predict anal function better. Future large prospective trials are warranted to confirm these findings. Secondly, the present work did not include postoperative CRT cases into the analysis due to unbalanced baseline data and a lack of pre-treatment data on anorectal function. Whether these findings are applicable to postoperative CRT requires further research. Thirdly, sexual dysfunction was not analyzed, because MRI assessment of the pelvis is not a validated tool for evaluating sexual function [Citation20], with ultrasound remaining the standard approach. Fourthly, due to the COVID-19 pandemic, we could not include dynamic MR defecography with real-time imaging during rectal examination (the instillation and defecation of ultrasound gel has been forbidden in our institution for the last two years). This would help objectively determine pelvic organ interactions with a standardized protocol based on the latest recommendations of the European Society of Urogenital Radiology and the European Society of Gastrointestinal and Abdominal Radiology [Citation25]. Further investigation employing dynamic MR defecography is necessary to address postoperative pelvic floor disorders [Citation26–29].
Conclusion
In conclusion, the present study introduced a postoperative MR-based fibrosis scoring system to evaluate anastomotic/pelvic fibrosis in LARC treated with nCRT. The results demonstrated that AFS and PFS were positively correlated with Wexner score. Furthermore, we built a nomogram model including clinical variables, AFS and PFS, which had good performance for anorectal function. Therefore, the novel model might be useful in comparative research of radiotherapy-induced fibrosis in the future.
Ethical approval
This study was approved by the ethics committee of the Shanghai Changhai Hospital, Naval Medical University (IRB Approval No. 8686) and the ethics committee of the Fudan University Shanghai Cancer Center (The registration ID is 220718).
Supplemental Material
Download MS Word (240.7 KB)Disclosure statement
No potential conflict of interest was reported by the author(s).
Data availability statement
The datasets used and/or analyzed in the current study are available from the corresponding author on reasonable request.
Additional information
Funding
References
- Sauer R, Becker H, Hohenberger W, et al. Preoperative versus postoperative chemoradiotherapy for rectal cancer. N Engl J Med. 2004;351(17):1–11. doi:10.1056/NEJMoa040694.
- Krook JE, Moertel CG, Gunderson LL, et al. Effective surgical adjuvant therapy for high-risk rectal carcinoma. N Engl J Med. 1991;324(11):709–715. doi:10.1056/NEJM199103143241101.
- Kim JH. Controversial issues in radiotherapy for rectal cancer: a systematic review. Radiat Oncol J. 2017;35(4):295–305. doi:10.3857/roj.2017.00395.
- Yoen H, Park HE, Kim SH, et al. Prognostic value of tumor regression grade on MR in rectal cancer: a large-scale, single-center experience. Korean J Radiol. 2020;21(9):1065–1076. doi:10.3348/kjr.2019.0797.
- Sauer R, Liersch T, Merkel S, et al. Preoperative versus postoperative chemoradiotherapy for locally advanced rectal cancer: results of the German CAO/ARO/AIO-94 randomized phase III trial after a median follow-up of 11 years. J Clin Oncol. 2012;30(16):1926–1933. doi:10.1200/JCO.2011.40.1836.
- Song JH, Jeong JU, Lee JH, et al. Preoperative chemoradiotherapy versus postoperative chemoradiotherapy for stage II-III resectable rectal cancer: a meta-analysis of randomized controlled trials. Radiat Oncol J. 2017;35(3):198–207. doi:10.3857/roj.2017.00059.
- Benson AB, Venook AP, Al-Hawary MM, et al. NCCN guidelines insights: rectal cancer, version 6.2020. J Natl Compr Canc Netw. 2020;18(7):806–815. doi:10.6004/jnccn.2020.0032.
- Marinello FG, Frasson M, Baguena G, et al. Selective approach for upper rectal cancer treatment: total mesorectal excision and preoperative chemoradiation are seldom necessary. Dis Colon Rectum. 2015;58(6):556–565. doi:10.1097/DCR.0000000000000349.
- Zhu X, Lou Z, Gong H, et al. Influence of neoadjuvant chemoradiotherapy on the anal sphincter: ultrastructural damage may be critical. Int J Colorectal Dis. 2016;31(8):1427–1430. doi:10.1007/s00384-016-2618-2.
- Wang B, Wei J, Meng L, et al. Advances in pathogenic mechanisms and management of radiation-induced fibrosis. Biomed Pharmacother. 2020;121:109560. doi:10.1016/j.biopha.2019.109560.
- Matzel K, Bittorf B, Günther K, et al. Rectal resection with low anastomosis: functional outcome. Colorectal Dis. 2003;5(5):458–464. doi:10.1046/j.1463-1318.2003.t01-1-00503.x.
- Essangri H, Majbar M, Benkabbou A, et al. Transcultural adaptation and validation of the Moroccan Arabic dialect version of the Wexner incontinence score in patients with low anterior resection syndrome after rectal surgery. Surgery. 2021;170(1):47–52. doi:10.1016/j.surg.2021.01.029.
- Jorge JM, Wexner SD. Etiology and management of fecal incontinence. Dis Colon Rectum. 1993;36(1):77–97. doi:10.1007/BF02050307.
- Vaizey CJ, Carapeti E, Cahill JA, et al. Prospective comparison of faecal incontinence grading systems. Gut. 1999;44(1):77–80. doi:10.1136/gut.44.1.77.
- Ammann K, Kirchmayr W, Klaus A, et al. Impact of neoadjuvant chemoradiation on anal sphincter function in patients with carcinoma of the mid rectum and low rectum. Arch Surg. 2003;138(3):257–261. doi:10.1001/archsurg.138.3.257.
- Canda A, Terzi C, Gorken I, et al. Effects of preoperative chemoradiotherapy on anal sphincter functions and quality of life in rectal cancer patients. Int J Colorectal Dis. 2010;25(2):197–204. doi:10.1007/s00384-009-0807-y.
- De Nardi P, Testoni S, Corsetti M, et al. Manometric evaluation of anorectal function in patients treated with neoadjuvant chemoradiotherapy and total mesorectal excision for rectal cancer. Dig Liver Dis. 2017;49(1):91–97. doi:10.1016/j.dld.2016.09.005.
- Ihnát P, Slívová I, Tulinsky L, et al. Anorectal dysfunction after laparoscopic low anterior rectal resection for rectal cancer with and without radiotherapy (manometry study). J Surg Oncol. 2018;117(4):710–716. doi:10.1002/jso.24885.
- Johnson LB, Jorgensen LN, Adawi D, et al. The effect of preoperative radiotherapy on systemic collagen deposition and postoperative infective complications in rectal cancer patients. Dis Colon Rectum. 2005;48(8):1573–1580. doi:10.1007/s10350-005-0066-0.
- Lakhoo J, Khatri G, Elsayed R, et al. MRI of the male pelvic floor. Radiographics. 2019;39(7):2003–2022. doi:10.1148/rg.2019190064.
- Khatri G, de Leon A, Lockhart M. MR imaging of the pelvic floor. Magn Reson Imaging Clin N Am. 2017;25(3):457–480. doi:10.1016/j.mric.2017.03.003.
- Lee BC, Park IJ, Kim CW, et al. Matched case-control analysis comparing oncologic outcomes between preoperative and postoperative chemoradiotherapy for rectal cancer. Ann Surg Treat Res. 2017;92(4):200–207. doi:10.4174/astr.2017.92.4.200.
- Lambregts DM, Cappendijk VC, Maas M, et al. Value of MRI and diffusion-weighted MRI for the diagnosis of locally recurrent rectal cancer. Eur Radiol. 2011;21(6):1250–1258. doi:10.1007/s00330-010-2052-8.
- Chen F, Ma X, Li S, et al. MRI-Based radiomics of rectal cancer: assessment of the local recurrence at the site of anastomosis. Acad Radiol. 2021;28(Suppl 1):S87–S94. doi:10.1016/j.acra.2020.09.024.
- El Sayed RF, Alt CD, Maccioni F, et al. Magnetic resonance imaging of pelvic floor dysfunction - joint recommendations of the ESUR and ESGAR pelvic floor working group. Eur Radiol. 2017;27(5):2067–2085. doi:10.1007/s00330-016-4471-7.
- Kobi M, Flusberg M, Paroder V, et al. Practical guide to dynamic pelvic floor MRI. J Magn Reson Imaging. 2018;47(5):1155–1170. doi:10.1002/jmri.25998.
- Alt CD, Benner L, Mokry T, et al. Five-year outcome after pelvic floor reconstructive surgery: evaluation using dynamic magnetic resonance imaging compared to clinical examination and quality-of-life questionnaire. Acta Radiol. 2018;59(10):1264–1273. doi:10.1177/0284185118756459.
- Kanmaniraja D, Arif-Tiwari H, Palmer SL, et al. MR defecography review. Abdom Radiol (NY). 2021;46(4):1334–1350. doi:10.1007/s00261-019-02228-4.
- Lalwani N, Khatri G, El Sayed RF, et al. MR defecography technique: recommendations of the society of abdominal radiology’s disease-focused panel on pelvic floor imaging. Abdom Radiol (NY). 2021;46(4):1351–1361. doi:10.1007/s00261-019-02160-7.