
Abstract
The study aimed to develop a sensitive and high-throughput liquid chromatography coupled with tandem mass spectrometry method to quantify concentrations of tramadol and paracetamol simultaneously in human plasma. Sample preparation involved single-step protein precipitation using methanol and two deuterated internal standards, tramadol D6 and paracetamol D4. Agilent Poroshell 120 EC-C18 (100 × 2.1 mm, 2.1 µm) analytical column was employed to achieve chromatographic separation. Detection was in positive ion multiple reaction monitoring mode. A tailing factor (Tf) of <1.2, separation factor (K prime) of >1.5 from the column dead time and signal-to-noise (S/N) ratio >10, were obtained for analytes and internal standards. The standard curve was linear over the concentration range of 2.5–500.00 ng/mL for tramadol and 0.025–20.00 μg/mL for paracetamol. A small injection volume of 1 µL, low flow rate of 440 µL/min and short analysis time of 3.5 min reduced the solvent consumption, analysis cost and system contamination. The results of method validation parameters fulfilled the acceptance criteria of bioanalytical guidelines. The method was successfully applied to a bioequivalence study of fixed-dose combination products of tramadol and paracetamol in Malaysian healthy subjects.
Introduction
Tramadol hydrochloride is a centrally acting analgesic and a non-selective agonist of the µ, δ and κ opioid receptors with a relatively higher affinity for the µ receptors. Tramadol has antitussive, antidepressant, anti-inflammatory and immune stimulatory effects [Citation1–3]. On the other hand, paracetamol is commonly used as a drug with analgesic and antipyretic effects to alleviate mild to moderate pain and reduce fever [Citation4, Citation5].
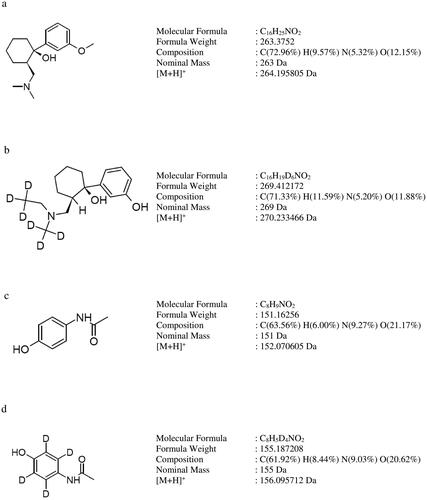
Tramadol and paracetamol are two analgesics proven to be effective in the pain treatment [Citation6, Citation7]. Fixed-dose combination formulation of tramadol and paracetamol (37.5 mg and 325 mg) has been approved by the US Food and Drug Administration (FDA) [Citation8] for the moderate to severe pain symptomatic treatment. The combination has been shown to affect three different and complementary pathways to attain analgesia more superior to that of the individual components while reducing the risk of adverse events [Citation9, Citation10]. The molecular structures of tramadol, paracetamol, tramadol D6 and paracetamol D4 are shown in .
Figure 1. Molecular structures of (a) tramadol, (b) tramadol D6, (c) paracetamol and (d) paracetamol D4.
The numerous reported bioanalytical methods for determination of tramadol or paracetamol and the metabolites in biological samples have been reported. These include capillary electrophoresis [Citation11], high-performance liquid chromatography-fluorescence detection [Citation12–17], high-performance liquid chromatography-ultraviolet detection [Citation18–27], high-performance liquid chromatography-photodiode array detection [Citation28–33], high-performance thin-layer chromatography-densitometer [Citation34], gas chromatography-mass spectrometry [Citation35–38], liquid chromatography-mass spectrometry [Citation39], liquid chromatography-ion trap mass spectrometry [Citation40], liquid chromatography-tandem mass spectrometry [Citation41–62] and UV-Vis spectrophotometer [Citation63]. All these bioanalytical methods share the same objective of enhancing the quantification sensitivity of analytes in the plasma samples using highly sensitive analytical instrument with optimum chromatographic conditions and suitable sample preparation. Hitherto, only one bioanalytical method could simultaneously determine tramadol and paracetamol in human plasma [Citation39]. In the study, laborious- and time-consuming liquid–liquid extraction (LLE) method was utilized to enhance the sensitivity using phenacetinum as internal standard (IS). The molecular structure and elution behaviour of the IS were different from the two analytes. IS is used to track the analyte of interest in different stages namely, sample preparation, chromatographic separation and mass spectrometric detection [Citation64]. It is preferred to have one rather than two different analytical methods that could simultaneously quantitate fixed-dose combination formulations such as tramadol and paracetamol concentrations in human plasma, reducing the analysis time and cost.
The aim of our study was to develop a sensitive and high-throughput liquid chromatography electrospray ionization tandem mass spectrometry (LC-ESI-MS/MS) method that could simultaneously quantitate tramadol and paracetamol in human plasma using a single-step protein precipitation (PPT) technique. In bioequivalence study, it is essential to have a validated bioanalytical method that could reliably quantify the plasma drug concentrations in subjects to estimate the pharmacokinetic parameters. Bioequivalence can then be confidently concluded between the test and reference products. The sample preparation, chromatographic separation, analyte detection and data processing are of major importance to yield high-quality bioanalytical data. Previously reported bioanalytical methods were found to be incomplete in validation as some of the validation parameters were only included recently in the guidelines by the regulatory authority such as carry-over, dilution integrity, re-injection reproducibility, extended batch run precision and accuracy, post-preparative stability of analyte, stability of the stock and working solutions of the analyte and IS. Two deuterated ISs, tramadol D6 hydrochloride and paracetamol D4 were used. During method development, column dead time, tailing factor (Tf), separation factor (K prime) from column dead time, signal to noise (S/N) ratio, peak intensity, peak shape, types of analytical column, mobile phase compositions and protein precipitating agents were studied. Method validation was conducted following the guidelines of the European Medicines Agency (EMA) [Citation65] and FDA [Citation66]. The current method was cost-effective with speedy completion of sample analysis within a short timeline, saving time and effort. The simple, fast and effective sample preparation removed interference from sample matrix and improved analytical system performance. The current method met the rigorous criteria of bioanalytical method validation guidelines of EMA [Citation65] and FDA [Citation66]. The validated method was applied to a bioequivalence study of two fixed-dose combination of tramadol and paracetamol (37.5 mg/325 mg) products in Malaysian healthy subjects. The highly sensitive method was able to quantify more than 90% of the plasma samples above the lower limit of quantification (LLOQ), with only a small injection volume of 1 µL.
Experimental
Materials and chemicals
Tramadol hydrochloride (chemical purity: 100.00%) and paracetamol (chemical purity: 100.00%) were provided by Y.S.P Industries (Selangor, Malaysia). Tramadol D6 hydrochloride (chemical purity: 99.64%) and paracetamol D4 (chemical purity: 91.79%) were purchased from Clearsynth (Hyderabad, India). Methanol (LCMS grade) was purchased from J.T. Baker (Deventer, Netherlands). Formic acid was procured from Merck (Darmstadt, Germany). Dipotassium ethylenediaminetetraacetic acid (K2EDTA) blank plasma was supplied by i-DNA Bio-technology (Kuala Lumpur, Malaysia).
LC-ESI-MS/MS analysis
The LC system was Nexera X2 ultra-high-performance liquid chromatography (UHPLC; Shimadzu, Kyoto, Japan). Poroshell 120 EC-C18 – Fast LC (Agilent, USA) analytical column (100 × 2.1 mm; 2.7 µm particle size) fixed with a guard column (UHPLC Guard Poroshell 120 EC-C18, 5 × 2.1 mmID, 2.7 µm) was used to attain chromatographic separation. The mobile phase consisted of methanol, water and formic acid (30:70:0.1, v/v/v). Sample was eluted isocratically (LC-30AD) at 440 µL/min with a run time of 3.5 min. The column oven (CTO-20AC) temperature was set at 30 °C. The autosampler (SIL-30AC) needle was flushed with 500 µL of water and methanol (1:1, v/v) before and after each injection. The mobile phase was filtered using a 0.2 µm nylon membrane filter (Millipore, USA) and degassed (Fisherbrand FB70155, UK) before use.
The detection was performed using Shimadzu LCMS-8040 tandem mass spectrometer (Kyoto, Japan) with an ESI source operated in positive ionization mode. The settings of the mass spectrometer were as follows: heat block temperature: 400 °C, desolvation line (DL) temperature: 250 °C, detector energy: −2120 V, capillary voltage: 4500 V, conversion dynode voltage: 6000 V, nitrogen drying gas flow: 15 L/min, nitrogen nebulizing gas flow: 3 L/min and argon collision gas: 230 kPa. The multiple reaction monitoring (MRM) transitions for quantification were the following: m/z 264.15 > 58.15 for tramadol, m/z 152.10 > 110.20 for paracetamol, m/z 270.25 > 64.15 for tramadol D6 and m/z 156.15 > 114.10 for paracetamol D4. The MRM transitions for confirmation were m/z 264.15 > 42.15 for tramadol, m/z 152.10 > 65.20 for paracetamol and m/z 156.15 > 69.10 for paracetamol D4. The dwell time for each MRM monitoring channel was 100 msec. shows the optimized MS/MS conditions such as Q1 pre-bias voltage, collision energy and Q3 pre-bias voltage for each MRM transition ion. LabSolutions software (Version 5.91) was used for data processing.
Table 1. Mass spectrometry (MS/MS) conditions of each analyte and IS.
Stock standard solutions, working standard solutions, calibration standards and quality control samples
The reference stock standard solution of tramadol (20 µg/mL), paracetamol (1 mg/mL) and IS (each at 20 µg/mL) were prepared in water and methanol (1:1, v/v). Working standard solutions of tramadol (25.00–5000.00 ng/mL), paracetamol (0.25–200.00 µg/mL) and IS (250.10 ng/mL tramadol D6 and 5000.26 ng/mL paracetamol D4) were prepared by serial dilutions of reference stock standard or working standard solutions. Quality control (QC) stock standard solutions of tramadol and paracetamol were prepared separately for QC working standard solutions (25.00–5000.00 ng/mL for tramadol and 0.25–200.00 µg/mL for paracetamol) with water and methanol (1:1, v/v). These QC working standard solutions were used to prepare the QC samples in the study.
The eight calibration standards of tramadol (2.50–500.00 ng/mL) and paracetamol (0.025–20.00 µg/mL) were prepared by spiking appropriate working standard solutions in blank plasma sample. Six QC plasma samples, LLOQ, low QC (LQC), medium QC1 (MQC1), medium QC2 (MQC2), high QC (HQC) and upper limit of quantification (ULOQ), at concentrations of 2.50, 7.50, 125.00, 250.00, 375.00 and 500.00 ng/mL for tramadol, while 0.025, 0.075, 5.00, 10.00, 15.00 and 20.00 µg/mL for paracetamol, were prepared.
Sample preparation
An aliquot of 250.0 µL of plasma samples, 50 µL of IS standard solution (containing 250.10 ng/mL of tramadol D6 and 5000.26 ng/mL of paracetamol D4) and 1.0 mL of methanol were pipetted into 2 mL microcentrifuge tube. The mixture was vortexed (Heidolph REAX TOP, Schwabach, Germany) for 30 s and centrifuged (Eppendorf 5804, Stevenage, UK) at 10,400.0 g for 5 min. After passing through syringe filter (0.2 µm, PTFE membrane, 25 mm filter, Xiboshi Tianjin, China), the supernatant was injected into the instrument.
System suitability test
Seven samples were used in the study namely, five high system suitability plasma samples (400.00 ng/mL of tramadol and 17.5 µg/mL of paracetamol), water: methanol (1:1, v/v) and LLOQ (2.5 ng/mL of tramadol and 0.025 µg/mL of paracetamol). The conduct and the acceptance criteria of system suitability test have been reported in earlier published studies [Citation67, Citation68].
Method validation
Method validation was conducted according to the EMA Guideline on Bioanalytical Method Validation [Citation65] and recovery in accordance with the Food and Drug Administration Bioanalytical Method Validation Guidance for Industry [Citation66].
Selectivity and specificity
Seven different blank human plasma samples containing the same anticoagulant as in subject samples were utilized to check for the presence of endogenous peaks at the retention times of analytes and IS.
Sensitivity
The method sensitivity was assessed at LLOQ level using signal-to-noise (S/N) ratio with seven individual subject’s blank human plasma.
Linearity and carry-over or residual effect
Linearity was determined from the standard curves constructed in the concentration range of 2.50–500.00 ng/mL for tramadol and 0.025–20.00 µg/mL for paracetamol, using eight calibration standards. Calibration curve was plotted as the peak area ratio of analyte to its own IS against the nominal concentrations of calibration standards. Calibration curve was evaluated with a weighting factor of 1/x2 using least square linear regression.
The carry-over effect was evaluated by injecting a blank sample (without analytes and IS) immediately after ULOQ sample injection.
Precision and accuracy
The accuracy and precision were assessed using six replicates of LLOQ and four QC samples (LQC, MQC1, MQC2 and HQC) within the same day (within-run) and on three different days (between-run). Extended run precision and accuracy were evaluated by injecting 25 replicates of QC samples, a set of system suitability and a set of plasma calibration curve in a single run to mimic the actual analytical run of study samples.
Matrix effect and extraction efficiency
Matrix effect due to plasma components during ionization was assessed by comparing the analytes and IS peak responses in post-extracted sample with neat solutions of analytes and IS at LQC and HQC samples of equivalent concentrations.
Extraction efficiency was evaluated by comparing the analyte and IS peak responses in pre-spiked samples with that of post-spiked supernatants using six determinations at four QC levels (LQC, MQC1, MQC2 and HQC).
Dilution integrity
The blank plasma was spiked with analytes at concentration above ULOQ level of the calibration curve and diluting the samples with a blank matrix, at 2- and 10-fold dilutions.
Re-injection reproducibility
Plasma calibration curve, LLOQ, LQC, MQC1, MQC2, HQC and ULOQ, were used for re-injection reproducibility study.
Stability studies
The stability studies of the analytes were evaluated at two concentration levels (LQC and HQC). The short-term/bench-top stability in plasma was determined by analysing the QC samples after storage for up to 24 h at 25 ± 4 °C. Two types of post-preparative stability studies, kept in instrumentation room (20 ± 5 °C) and autosampler (25 ± 3 °C), were evaluated until 48 h. The freeze and thaw stability in plasma was assessed after seven freeze (−20 ± 10 °C) and thaw (25 ± 4 °C) cycles. Long-term stability of plasma sample was determined after kept in freezer (−20 ± 10 °C) for 74 days. All the processed sample stability was quantitated using a freshly prepared plasma calibration curve and the obtained concentrations were compared against the nominal concentration of the QC samples.
The stability of stock and working standard solutions of analytes and IS were determined after storing in chiller (5 ± 3 °C) and at room temperature (25 ± 4 °C) for 74 days. The stock and working solutions of analytes and IS were appropriately diluted to LLOQ and ULOQ levels before being evaluated against freshly prepared LLOQ and ULOQ levels from new stock standard solutions. IS stock and working solution stability was determined at 250.10 ng/mL and 5000.26 ng/mL concentrations for tramadol D6 and paracetamol D4 against a freshly prepared IS at the equivalent concentration.
Application in bioequivalence study and incurred sample reanalysis
The validated method was applied to a two-way crossover bioequivalence study of two fixed-dose combination products of tramadol and paracetamol (37.5 mg/325 mg) between Tramicet F.C. tablet (Y.S.P. Industries (M) Sdn. Bhd., Malaysia) and Ultracet tablet (Janssen Korea Ltd., Korea) in 26 healthy adult male Malaysian subjects under fasting conditions. The study was approved by the Medical Research and Ethics Committee, National Institute of Health, Malaysia. The subjects signed written informed consent form to participate in the study. Each subject was administered two tablets of either test or reference product with a washout period of 7 days between the two periods. The blood samples were collected in K2EDTA tubes before dosing (pre-dose) and at 0.25, 0.50, 0.75, 1.0, 1.5, 2.0, 2.5, 3.0, 4.0, 6.0, 8.0, 10.0, 12.0, 16.0, 20.0 and 24.0 h after dosing. The plasma samples were centrifuged for 15 min at 3500 rpm. After centrifuging, the supernatant was transferred to a blank tube and kept in a freezer (−20 ± 10 °C) until analysis.
Pharmacokinetic parameters namely, maximum plasma concentration (Cmax), time to reach maximum plasma concentration (Tmax), area under the plasma concentration-time curve from zero to sampling time t (AUC0–t), area under the plasma concentration-time curve from zero to infinity (AUC0–t), elimination rate constant (ke), elimination half-life (t1/2) and mean residence time, were determined.
The test and the reference products are bioequivalent when the 90% confidence interval (CI) of the geometric mean ratios of AUC0–t, AUC0–∞ and Cmax of test over the reference product lie within 0.80–1.25 [Citation69, Citation70].
For incurred sample reanalysis (ISR), 10% of the total analysed samples at Cmax and in the elimination phase was taken for each individual subject. The concentrations for the initial analysis and reanalysis should be within 20% of their mean for at least 67% of the repeats.
Internal standard response variation during sample analysis and incurred sample reanalysis
The IS response variability was set within 50%–150% range from the average of all the known samples (system suitability, plasma standard curve and QC samples) [Citation71]. The IS response of each unknown sample (subject’s sample) was plotted against the IS mean value of the known samples. The unknown samples were re-analysed if the IS response of the unknown samples was not within the pre-set range.
ISR was assessed by re-analysing samples at Cmax and within four times of LLOQ at elimination phase for each subject. A minimum of 10% of all samples were selected for ISR testing. The deviation between initial and re-analysed values should be within ±20% of their mean value.
Results
System suitability
The first five replicates of high system suitability samples of tramadol and paracetamol reported a coefficient of variation (CV, %) of ≤2.46% and 2.24%, respectively. The accuracy values of each pair of system suitability samples during and at the end of the run were within 100 ± 15%, indicating that the drift during the run was negligible and there was no carry-over.
Method validation
Selectivity and specificity
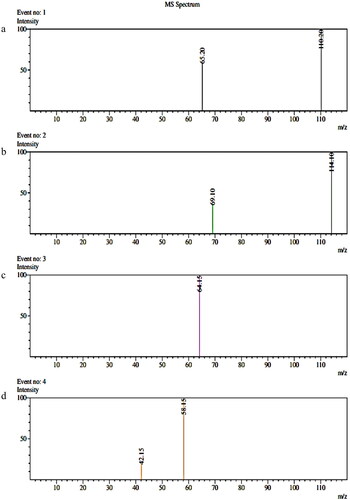
Method selectivity was assessed using seven batches of blank human plasma. demonstrates the chromatograms of blank plasma, zero sample, LLOQ and ULOQ while shows the mass chromatogram with all analytes and IS. Product ion spectra of analytes and IS is presented in . There was no interference from endogenous compounds of plasma for tramadol, paracetamol and IS.
Figure 2. Mass chromatograms of the analysis of (a) blank plasma, (b) zero sample with IS and (c) tramadol and paracetamol at LLOQ level with IS (d) tramadol and paracetamol at ULOQ level with IS.
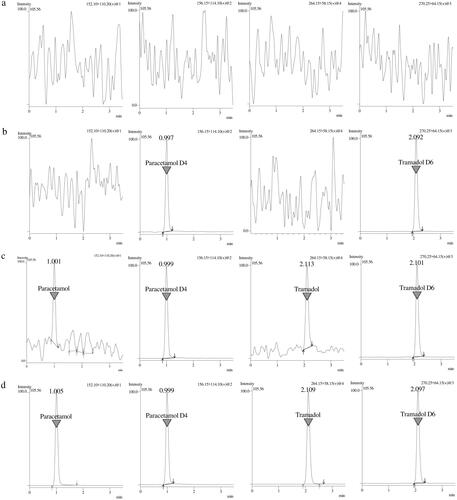
Figure 3. Mass chromatogram with all analytes and IS.
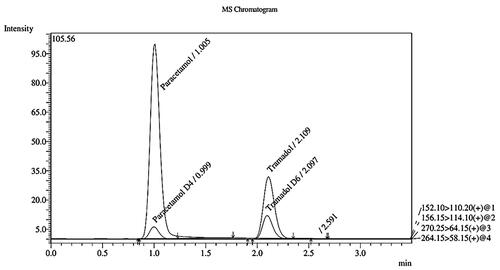
Figure 4. Product ion spectra of (a) paracetamol, (b) paracetamol D4, (c) tramadol D6 and (d) tramadol.
Sensitivity
The LLOQ levels of tramadol and paracetamol were 2.5 ng/mL and 0.025 µg/mL, respectively. The study reported S/N ratios of more than 60, 12, 1400 and 1500 for tramadol, paracetamol, tramadol D6 and paracetamol D4 at LLOQ level.
Linearity or calibration curve and carry-over or residual effect
The calibration curves of tramadol and paracetamol were linear over the concentration range of 2.5–500.00 ng/mL and 0.025–20.00 µg/mL, with a coefficient of determination (r2) of more than 0.99. The regression equations of the calibration curves were y = 0.8759x (±0.027) + 0.0066 (±0.0040) for tramadol and y = 0.0053x (±0.002) + 0.0010 (±0.0002 for paracetamol). The back-calculated concentrations were within ±20% and ±15% of their nominal concentrations for LLOQ and other calibration points.
Carry-over was not found in blank sample after the injection of ULOQ sample at the retention times of analytes and IS.
Precision and accuracy
The results of precision and accuracy are presented in . The within-run precision (CV, %) of LLOQ and QC samples ranged from 0.90% to 16.83% and 0.89% to 16.35%, while within-run mean accuracy ranged from 94.65% to 111.89% and 94.67% to 110.80% for tramadol and paracetamol, respectively. The between-run precision (CV, %) varied from 6.22% to 13.63% and 1.69% to 14.55% for tramadol and paracetamol, while the between-run accuracy varied from 99.88% to 106.56% and 96.00% to 107.20% for tramadol and paracetamol. The extended run precision (CV, %) ranged between 1.30%–5.85% and 1.48%–9.76% while accuracy results ranged between 94.76%–101.15% and 98.99%–101.43% for tramadol and paracetamol. The results indicated that the method would be able to run up to 100 samples including two sets of QC samples.
Table 2. Within-, between- and extended run of precision and accuracy.
Matrix effect and recovery
The IS-normalized matrix effects of tramadol and paracetamol at LQC and HQC levels ranged from 98.66% to 105.74% and 98.69% to 113.93% with the precision (CV, %) values ≤6.11% and 7.27%, indicating that the ionization of the analytes was not affected by the different matrices used in the study.
The mean extraction recovery of tramadol and paracetamol were calculated at the four QC levels, namely LQC, MQC1, MQC2 and HQC, in six replicates. The mean recovery for all QC samples was more than 91% with precision (CV, %) value of <11.55%. It varied from 95.41% to 102.85% and 91.09% to 101.23% for tramadol and paracetamol. The mean recovery values of tramadol D6 and paracetamol D4 (IS) at MQC2 level were 95.67% and 98.60% with precision values of <1.50% and 1.55%. The results demonstrated that the current PPT technique was consistent, efficient and robust.
Dilution integrity
The accuracy values of 2- and 10-time diluted samples were 104.76%–106.49% and 104.45%–104.63% with precision values (CV, %) of ≤1.91% and ≤2.76%.
Re-injection reproducibility
The results of re-injection reproducibility are presented in . The results were within the acceptable range of ±20% and ±15% for LLOQ and QC samples of tramadol and paracetamol. The slope value of re-injected plasma curve reported deviations of <3.68% and 0.88% for tramadol and paracetamol. The coefficient of determination (r2) values for all plasma curves were more than 0.99, showing the re-injection was highly reproducible.
Table 3. Re-injection reproducibility results.
Stability studies
The stability study results of tramadol and paracetamol in human plasma for different testing conditions are presented in . All analytes were stable under the examined conditions, short-term stability (24 h at room temperature), post-preparative stability (48 h in autosampler and instrumentation room), freeze–thaw stability (seven cycles) and long-term stability (74 days), with accuracy values ranging between 90.15% and 111.26%. The stock and working standard solutions of analytes and IS were stable for at least 74 days at room temperature and chiller, within the acceptable criteria.
Table 4. Stability study results of tramadol, paracetamol and IS under different conditions (n = 3).
Application to bioequivalence study
The validated method was successfully applied to quantify the concentrations of tramadol and paracetamol in healthy Malaysian subjects obtained from a bioequivalence study of two fixed-dose combination products of tramadol and paracetamol (37.5/325 mg) under fasting conditions. A total of 26 healthy subjects were recruited and 23 subjects completed both periods of the study. The mean plasma concentration-time profiles of tramadol and paracetamol are shown in . The pharmacokinetic parameters of the bioequivalence study are presented in .
Figure 5. The mean plasma of (a) tramadol and (b) paracetamol concentration-time profiles of Ultracet tablet and Tramicet F.C. tablet.
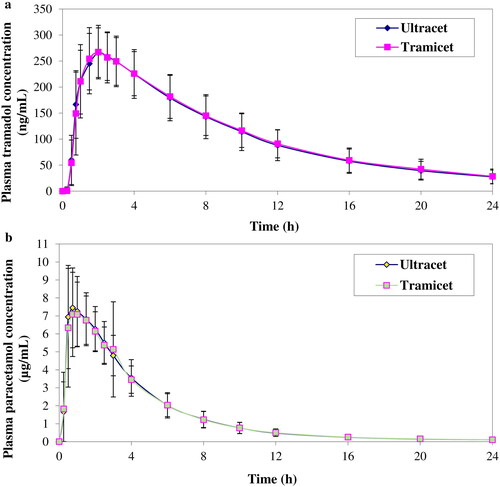
Table 5. Pharmacokinetic parameters of tramadol and paracetamol following oral administration of tramadol and paracetamol (37.5/325 mg × 2) tablet formulations (test and reference) in 23 healthy volunteers under fasting conditions.
The point estimate and 90% CI of the geometric mean ratio between test and reference products of Cmax, AUC0–t and AUC0–∞ were found to be 104.68% (100.06%–109.50%), 103.97% (101.59%–106.40%) and 104.29% (101.59%–107.05%) for tramadol while 103.79% (96.58%–111.55%), 101.62% (97.85%–105.54%) and 101.66% (97.85%–105.62%) for paracetamol, which were within the bioequivalence limit of 0.80–1.25 showing the two products are bioequivalent.
Internal standard response variation and incurred sample reanalysis
In the present study, IS response of all subjects’ samples deviated within ±30% of the mean response of IS of known samples in all runs. For ISR, the re-analyzed values were 100.00% for tramadol and 94.90% for paracetamol, demonstrating the reproducibility of the analytical method.
Discussion
Method development
Optimization of LC-ESI-MS/MS method
Optimization of ionization and fragmentation of tramadol, paracetamol and IS was performed by injecting 1 µL of 2000 ng/mL of individual standard solution at 0.2 mL/min into the ESI source using direct injection analysis. The analytes and deuterated ISs were scanned with Q1 and Q3 transitions in both ESI positive and negative ionization modes. The selection of the precursor ions [M + H]+ was based on the most stable and abundant ion formation observed from Q1 and Q3 scans. ESI positive ionization mode gave a relatively higher signal intensity as the analytes and IS protonated more easily. In the Q1 and Q3 full scan mass spectra, the precursor ions [M + H]+ of tramadol, paracetamol, tramadol D6 and paracetamol D4 were m/z 264.15, 152.10, 270.25 and 156.15. After performing the MRM optimization, the product ion showed the abundant ions of m/z 58.15 for tramadol, m/z 110.20 for paracetamol, m/z 64.15 for tramadol D6 and m/z 114.10 for paracetamol D4 which were used as quantitative transitions. The second highest abundant product ions were m/z 42.15 for tramadol, m/z 65.20 for paracetamol and m/z 69.10 for paracetamol D4 which acted as confirmation transitions. No confirmation product ion was observed for tramadol D6, which could be attributed to the low ESI intensity of detecting the second highest MRM transition for tramadol D6. Having only a single MRM transition for tramadol D6 as deuterated IS of tramadol was not expected to adversely affect the quantification of tramadol.
During optimization of chromatographic separation, parameters which included column dead volume, S/N ratio, peak intensity, peak shape and tailing factors (Tf) of analytes and IS, were examined. The chromatographic conditions such as type of analytical column, sample injection volume, column oven temperature, mobile phase composition and flow rate, were investigated to achieve good separation. The tailing factor (Tf) values of three different analytical columns namely. Poroshell 120 EC-C18 (100 × 2.1 mm, 2.7 µm), Kinetex XB-C18 (100 × 2.1 mm, 2.6 µm) and Shim-Pack Velox C18 (100 × 2.1 mm, 2.7 µm). were compared. The Tf values were 1.0–1.2 for Poroshell, 1.2–1.4 for Kinetex and >2.0 for Shim-Pack Velox, showing that Shim-Pack column was not suitable [Citation72]. Under similar chromatographic conditions, Poroshell exhibited higher signal-to-noise ratio for analytes and IS with a small injection volume of 1 µL, giving better precision and accuracy than the other two columns. Therefore, Poroshell column was selected based on Tf and S/N ratio criteria.
Methanol as organic modifier of mobile phase exhibited a higher ESI sensitivity of more than seven times than that of acetonitrile. The optimum mobile phase composition was methanol and 0.1% formic acid (3:7, v/v) that gave the best ESI sensitivity, peak shape and retention of analytes and IS within 3.5 min. In analytical chromatographic separation, analytes must be well retained and avoid to be eluted in the column dead time. Although high-throughput analysis is desired for studies involving huge number of samples, elution of analytes and IS at column dead time should be avoided. Poroshell column dead time was estimated to be 0.39 min at a flow rate of 440 µL/min. No chromatography or no high-performance liquid chromatography method was developed in the elution of any analyte or IS at or near the column dead time. The retention times of tramadol, tramadol D6, paracetamol and paracetamol D4 were 2.11, 2.10, 1.00 and 1.00 min, indicating that the analytes and IS were well retained. Based on the retention time and column dead time of the study, the retention factor (K prime) of paracetamol and tramadol was noted to be more than 1.5. It showed that the method was highly selective and specific for the analytes to be analysed in the study. The optimal flow rate and column oven temperature were found at 440 µL/min and 30 °C.
Sample preparation
It is indeed a challenge to develop an assay method that could simultaneously determine the levels of two analytes in human plasma samples of fixed-dose combination formulations having huge disparity in dose. It was reported that the Cmax of paracetamol was approximately 40 times higher than tramadol [Citation39].
Injection of large sample volume could lead to MS/MS saturation by paracetamol. Likewise, the use of analyte enrichment methods such as LLE and solid phase extraction (SPE), could saturate MS/MS response to paracetamol. Both SPE and LLE methods are laborious and time-consuming, involving multiple steps. In addition, SPE is expensive while LLE consumes high non-environmental friendly organic solvents. Furthermore, extraction is not a method of choice for high-throughput analysis of studies involving a large number of samples such as pharmacokinetic and bioequivalence studies.
Simple PPT using methanol, acetonitrile mixture of acetone acetonitrile (1:1, v/v) and acetone: methanol (1:1, v/v) were studied. Mixture of acetone and acetonitrile or methanol was unsuitable as precipitating agent. There was an additional evaporation step to remove the organic solvents and the peak response of tramadol and tramadol D6 was inconsistent. Methanol produced higher peak responses and more than 90% of recovery for the analytes and IS. In addition, the use of deuterated IS markedly reduced the matrix effect for both analytes. Matrix factor of 100 ± 15% was obtained for methanol: plasma at ratio of 4: 1 (v/v). The current sample preparation not only circumvented the MS/MS saturation by paracetamol but also increased the sensitivity of tramadol.
The standard calibration ranges of 2.5–500 ng/mL and 0.025–20 µg/mL were linear for tramadol and paracetamol. Based upon the LLOQ levels and injection volume of 1 µL, the present method was more sensitive than the published method of Zhu et al. [Citation39] for simultaneous determination of tramadol and paracetamol in plasma samples. Such a wider range than that reported by Zhu et al. [Citation39] could more accurately determine the concentrations of tramadol and paracetamol in sample analysis. The Cmax values of tramadol and paracetamol for a few subjects were above 350.00 ng/mL and 10.00 µg/mL. Furthermore, all subjects’ sample concentrations were within at least two QC concentrations to fulfil the guideline requirements without the need to include additional QC sample in the study and hence avoiding the need to conduct partial method validation for adding extra QC sample. A low LLOQ value is anticipated and required for BE study to determine at least 80% of the plasma drug concentration-time profile. In the present study, 783 (99.87%) and 741 (94.51%) of tramadol and paracetamol samples out of 784 total samples (excluding the pre-dose samples) quantified, were within the calibration range. In addition, the wider calibration ranges allowed determination of more time points near to LLOQ. Furthermore, the run time of 3.5 min and a low flow rate of 440 µL/min greatly decreased the solvent usage of more than 69% (1.54 mL vs. 5.00 mL per analysis). shows the comparison between the present method and the method of Zhu et al. [Citation39].
Table 6. Comparison between current method and previously published method for simultaneous quantification of tramadol and paracetamol in human plasma.
Comparison of pharmacokinetics with other published studies
The pharmacokinetic results of tramadol and paracetamol were comparable to previously published studies of Zhu et al. [Citation39] for male Chinese volunteers receiving two tablets containing 75 mg tramadol and 650 mg paracetamol. The study reported mean Cmax, AUC0–t, Tmax and t1/2 values of 228 ± 58 ng/mL, 2249 ± 460 h.ng/mL, 0.9 ± 0.5 h and 7.9 ± 1.2 h for tramadol, while 9.43 ± 2.4 µg/mL, 26.38 ± 2.96 h.µg/mL, 0.5 ± 0.3 h and 4.1 ± 0.5 h for paracetamol.
The LLOQ values of 2.50 ng/mL and 0.025 μg/mL for tramadol and paracetamol were highly sensitive and permitted accurate determination of tramadol and paracetamol concentrations in more than 90% of the total plasma samples, which were above LLOQ.
Internal standard response variation
A suitable IS is important for the robustness of the intended bioanalysis. IS response variability is monitored during bioanalysis as there is a possibility of the presence of different variability in study sample analysis and method validation run due to the difference in matrix composition between blank matrices used for preparing system suitability, plasma calibration curve and QC samples and possible different subject’s variation. Furthermore, no sporadic or systematic variation (trending variation) in IS response was found in all unknown samples indicating the method and system were highly stable and robust.
Conclusion
In conclusion, a high-throughput and sensitive LC-ESI-MS/MS method for simultaneous determination of tramadol and paracetamol in human plasma was successfully developed and applied to bioequivalence study of fixed-dose combination products in Malaysian subjects. The method is simple, economical, free of matrix effect, environmentally friendly with low consumption of organic solvents and consistent in recovery. The mentioned method was successfully applied to real samples and it can be used in laboratories with a large number of samples to determine the concentration of tramadol and paracetamol.
Author contributions
Conceptualization: Gabriel Onn Kit Loh and Kok Khiang Peh. Data curation: Kok Khiang Peh and Long Chiau Ming. Formal analysis: Gabriel Onn Kit Loh, Emily Yii Ling Wong, Chen Zhu Goh, Yvonne Tze Fung Tan, Yi Lin Lee, Lai Hui Pang and Siti Halimah Shahridzo. Funding acquisition: Long Chiau Ming, Andi Hermansyah and Kok Khiang Peh. Investigation: Nair Damenthi and Kok Khiang Peh. Methodology: Gabriel Onn Kit Loh, Emily Yii Ling Wong, Chen Zhu Goh, Yvonne Tze Fung Tan, Yi Lin Lee, Lai Hui Pang, Siti Halimah Shahridzo and Kok Khiang Peh. Project administration: Gabriel Onn Kit Loh, Yi Lin Lee, Lai Hui Pang, Siti Halimah Shahridzo and Nair Damenthi. Resources: Nair Damenthi and Kok Khiang Peh. Software: Long Chiau Ming, Andi Hermansyah and Kok Khiang Peh. Supervision: Nair Damenthi and Kok Khiang Peh. Validation, Gabriel Onn Kit Loh, Emily Yii Ling Wong and Chen Zhu Goh. Visualization: Nair Damenthi and Kok Khiang Peh. Writing – original draft, Gabriel Onn Kit Loh, Emily Yii Ling Wong and Kok Khiang Peh. Writing – review and editing, Long Chiau Ming Andi Hermansyah and Kok Khiang Peh.
Acknowledgements
The Y.S.P. Industries (M) Sdn. Bhd. is acknowledged for providing test and reference products of the study.
Disclosure statement
The authors declare no conflict of interest.
Correction Statement
This article has been corrected with minor changes. These changes do not impact the academic content of the article.
Additional information
Funding
References
- Kukanich B, Papich MG. Pharmacokinetics of tramadol and the metabolite O-desmethyltramadol in dogs. J Vet Pharmacol Ther. 2004;27(4):1–16. doi: 10.1111/j.1365-2885.2004.00578.x.
- Yalcin I, Aksu F, Belzung C. Effects of desipramine and tramadol in a chronic mild stress model in mice are altered by yohimbine but not by pindolol. Eur J Pharmacol. 2005;514(2–3):165–174. doi: 10.1016/j.ejphar.2005.03.029.
- Taghaddosinejad F, Mehrpour O, Afshari R, et al. Dart, factors related to seizure in tramadol poisoning and its blood concentration. J Med Toxicol. 2011;7(3):183–188. doi: 10.1007/s13181-011-0168-0.
- Hochberg MC, Altman RD, April KT; American College of Rheumatology, et al. American College of Rheumatology 2012 recommendations for the use of nonpharmacologic and pharmacologic therapies in osteoarthritis of the hand, hip, and knee. Arthritis Care Res (Hoboken). 2012;64(4):465–474. doi: 10.1002/acr.21596.
- Jóźwiak-Bebenista M, Nowak JZ. Paracetamol: mechanism of action, applications and safety concern. Acta Pol Pharm. 2014;71(1):11–23.
- Scott LJ, Perry CM. Tramadol: a review of its use in perioperative pain. Drugs. 2000;60(1):139–176. doi: 10.2165/00003495-200060010-00008.
- Raffa RB. Pharmacology of oral combination analgesics: rational therapy for pain. J Clin Pharm Ther. 2001;26(4):257–264. doi: 10.1046/j.1365-2710.2001.00355.x.
- U.S. Food and Drug Administration. Ultracet (325 mg acetaminophen/37.5 mg tramadol hydrochloride) tablets. R. W. Johnson Pharmaceutical Research Institute. Available from: https://www.accessdata.fda.gov/drugsatfda_docs/nda/2001/21123_Ultracet.cfm
- McClellan K, Scott LJ. Tramadol/paracetamol. Drugs. 2003;63(11):1079–1086. doi: 10.2165/00003495-200363110-00007.
- Pergolizzi JV, M van de L, Langford R, et al. Tramadol/paracetamol fixed-dose combination in the treatment of moderate to severe pain. J Pain Res. 2012;5:327–346. doi: 10.2147/JPR.S33112.
- Rudaz S, Veuthey JL, Desiderio C, et al. Simultaneous stereoselective analysis by capillary electrophoresis of tramadol enantiomers and their main phase I metabolites in urine. J Chromatogr A. 1999;846(1–2):227–237. doi: 10.1016/s0021-9673(99)00028-x.
- Ardakani YH, Rouini MR. Pharmacokinetics of tramadol and its three main metabolites in healthy male and female volunteers. Biopharm Drug Dispos. 2007;28(9):527–534. doi: 10.1002/bdd.584.
- Ardakani YH, Mehvar R, Foroumadi A, et al. Enantioselective determination of tramadol and its main phase I metabolites in human plasma by high-performance liquid chromatography. J Chromatogr B Analyt Technol Biomed Life Sci. 2008;864(1–2):109–115. doi: 10.1016/j.jchromb.2008.01.038.
- Baconi DL, Stan M, Abdul Jalil Ebrahim Z, et al. Determination of tramadol in human plasma by HPLC with fluorescence detection. J Mind Med Sci. 2016;3(1) Article 7.
- Campanero MA, García-Quetglas E, Sádaba B, et al. Simultaneous stereoselective analysis of tramadol and its primary phase I metabolites in plasma by liquid chromatography. Application to a pharmacokinetic study in humans. J Chromatogr A. 2004;1031(1–2):219–228. doi: 10.1016/j.chroma.2003.11.034.
- Ceccato A, Chiap P, Hubert P, et al. Automated determination of tramadol enantiomers in human plasma using solid-phase extraction in combination with chiral liquid chromatography. J Chromatogr B Biomed Sci Appl. 1997;698(1–2):161–170. doi: 10.1016/s0378-4347(97)00267-3.
- Nobilis M, Kopecký J, Kvetina J, et al. High-performance liquid chromatographic determination of tramadol and its O-desmethylated metabolite in blood plasma. Application to a bioequivalence study in humans. J Chromatogr A. 2002;949(1–2):11–22. doi: 10.1016/s0021-9673(01)01567-9.
- Abu-Qare AW, Abou-Donia MB. A validated HPLC method for the determination of pyridostigmine bromide, acetaminophen, acetylsalicylic acid and caffeine in rat plasma and urine. J Pharm Biomed Anal. 2001;26(5–6):939–947. doi: 10.1016/s0731-7085(01)00448-4.
- Dahshan HE, Helal MA, Mostafa SM, et al. Development and validation of an HPLC-UV method for simultaneous determination of sildenafil and tramadol in biological fluids: application to drug-drug interaction study. J Pharm Biomed Anal. 2019;168:201–208. doi: 10.1016/j.jpba.2019.02.025.
- Gorain B, Choudhury H, Nandi U, et al. Development and validation of an HPLC method for simultaneous detection and quantification of paracetamol and etodolac in human plasma and its application to a pharmacokinetic study. J AOAC Int. 2013;96(3):573–579. doi: 10.5740/jaoacint.11-457.
- Ibrahim AE, Hashem H, Elhenawee M, et al. Core-shell particles and monolithic columns; tools for simultaneous LC analysis of avanafil, sildenafil, apomorphine, trazodone, yohimbine, tramadol and dapoxetine in pharmaceutical dosage forms, counterfeit products and human plasma. RSC Adv. 2020;10(3):1379–1387. doi: 10.1039/c9ra08717f.
- Ismaiel OA, Hosny MM. Development and validation of a spectrophotometric method for the determination of tramadol in human urine using liquid-liquid extraction and ion pair formation. Int J Instrum Sci. 2012;1(3):34–40.
- Javanbakht M, Attaran AM, Namjumanesh MH, et al. Solid-phase extraction of tramadol from plasma and urine samples using a novel water-compatible molecularly imprinted polymer. J Chromatogr B Analyt Technol Biomed Life Sci. 2010;878(20):1700–1706. doi: 10.1016/j.jchromb.2010.04.006.
- Jensen LS, Valentine J, Milne RW, et al. The quantification of paracetamol, paracetamol glucuronide and paracetamol sulphate in plasma and urine using a single high-performance liquid chromatography assay. J Pharm Biomed Anal. 2004;34(3):585–593. doi: 10.1016/s0731-7085(03)00573-9.
- Oliveira EJ, Watson DG, Morton NS. A simple microanalytical technique for the determination of paracetamol and its main metabolites in blood spots. J Pharm Biomed Anal. 2002;29(5):803–809. doi: 10.1016/s0731-7085(02)00174-7.
- Silva MF, Schramm SG, Kano EK, et al. Bioequivalence evaluation of single doses of two tramadol formulations: a randomized, open-label, two-period crossover study in healthy Brazilian volunteers. Clin Ther. 2010;32(4):758–765. doi: 10.1016/j.clinthera.2010.03.016.
- Soysa P, Kolambage S. Rapid HPLC/UV method for analysis of urinary and plasma/serum paracetamol concentrations. J Natl Sci Found. 2010;38:(2):131–137.
- Campanero MA, Calahorra B, García-Quétglas E, et al. Rapid liquid chromatographic assay for the determination of acetaminophen in plasma after propacetamol administration: application to pharmacokinetic studies. J Pharm Biomed Anal. 1999;20(1–2):327–334. doi: 10.1016/s0731-7085(99)00051-5.
- Fernández P, Taboada V, Bermejo AM, et al. Simultaneous determination of six analgesics in human plasma using solid-phase extraction and liquid chromatography. Rev Toxicol. 2012;29:95–99.
- Hilal MA, Mohamed KM. Simultaneous determination of tramadol and O-desmethyltramadol in human plasma using HPLC-DAD. J Chromatogr Sci. 2014;52(10):1186–1192. doi: 10.1093/chromsci/bmt174.
- Küçük A, Kadioğlu Y, Celebi F. Investigation of the pharmacokinetics and determination of tramadol in rabbit plasma by a high-performance liquid chromatography-diode array detector method using liquid-liquid extraction. J Chromatogr B Analyt Technol Biomed Life Sci. 2005;816(1–2):203–208. doi: 10.1016/j.jchromb.2004.11.031.
- Locatelli M, Cifelli R, Di Legge C, et al. Simultaneous determination of eperisone hydrochloride and paracetamol in mouse plasma by high performance liquid chromatography-photodiode array detector. J Chromatogr A. 2015;1388:79–86. doi: 10.1016/j.chroma.2015.02.008.
- Ramírez AM, López-Muñoz FJ, Medina JR, et al. HPLC-PDA method for the quantification of paracetamol in plasma: application to PK/PD studies with arthritic rats. Int J Pharm Pharm Sci. 2017;9(5):233–239. doi: 10.22159/ijpps.2017v9i5.17746.
- Gadallah MI, Ali HRH, Askal HF, et al. Facile HPTLC-densitometric determination of ertapenem and paracetamol in pharmaceuticals and rabbit plasma with pharmacokinetic insights. Microchem J. 2019;150:104093. doi: 10.1016/j.microc.2019.104093.
- El-Sayed AA, Mohamed KM, Nasser AY, et al. Simultaneous determination of tramadol, O-desmethyltramadol and N-desmethyltramadol in human urine by gas chromatography-mass spectrometry. J Chromatogr B Analyt Technol Biomed Life Sci. 2013;926:9–15. doi: 10.1016/j.jchromb.2013.02.019.
- Fernández N, Olivera NM, Keller GA, et al. Simultaneous quantitation of meperidine, normeperidine, tramadol, propoxyphene and norpropoxyphene in human plasma using solid-phase extraction and gas chromatography/mass spectrometry: method validation and application to cardiovascular safety of therapeutic doses. Rapid Commun Mass Spectrom. 2017;31(23):2056–2056. doi: 10.1002/rcm.7976.
- Lintz W, Uragg H. Quantitative determination of tramadol in human serum by gas chromatography-mass spectrometry. J Chromatogr. 1985;341(1):65–79. doi: 10.1016/s0378-4347(00)84010-4.
- Trettin A, Zoerner AA, Böhmer A, et al. Quantification of acetaminophen (paracetamol) in human plasma and urine by stable isotope-dilution GC-MS and GC-MS/MS as pentafluorobenzyl ether derivative. J Chromatogr B Analyt Technol Biomed Life Sci. 2011;879(23):2274–2280. doi: 10.1016/j.jchromb.2011.06.012.
- Zhu T, Ding L, Guo XF, et al. Simultaneous determination of tramadol and acetaminophen in human plasma by LC-ESI-MS. Chroma. 2007;66(3–4):171–178. doi: 10.1365/s10337-007-0268-9.
- Ing-Lorenzini KR, Desmeules JA, Besson M, et al. Two-dimensional liquid chromatography-ion trap mass spectrometry for the simultaneous determination of ketorolac enantiomers and paracetamol in human plasma: application to a pharmacokinetic study. J Chromatogr A. 2009;1216(18):3851–3856. doi: 10.1016/j.chroma.2009.02.071.
- Abro K, Memon N, Bhanger MI, et al. Multi-component quantitation of loratadine, pseudoephedrine and paracetamol in plasma and pharmaceutical formulations with liquid chromatography-tandem mass spectrometry utilizing a monolithic column. Quím Nova. 2012;35(10):1950–1954. doi: 10.1590/S0100-40422012001000012.
- Ceccato A, Vanderbist F, Pabst JY, et al. Enantiomeric determination of tramadol and its main metabolite O-desmethyltramadol in human plasma by liquid chromatography-tandem mass spectrometry. J Chromatogr B Biomed Sci Appl. 2000;748(1):65–76. doi: 10.1016/s0378-4347(00)00318-2.
- Celma C, Allué JA, Pruñonosa J, et al. Simultaneous determination of paracetamol and chlorpheniramine in human plasma by liquid chromatography-tandem mass spectrometry. J Chromatogr A. 2000;870(1–2):77–86. doi: 10.1016/s0021-9673(99)01252-2.
- Cha J, Kim BK, Gwon MR, et al. Development and validation of a UPLC-MS/MS method for the quantification of acetaminophen in human plasma and its application to pharmacokinetic studies. Transl Clin Pharmacol. 2016;24(1):30–36. doi: 10.12793/tcp.2016.24.1.30.
- Devarakonda K, Morton T, Margulis R, et al. Pharmacokinetics and bioavailability of oxycodone and acetaminophen following single-dose administration of MNK-795, a dual-layer biphasic IR/ER combination formulation, under fed and fasted conditions. Drug Des Devel Ther. 2014;8:1125–1134. doi: 10.2147/DDDT.S64261.
- Gicquel T, Aubert J, Lepage S, et al. Quantitative analysis of acetaminophen and its primary metabolites in small plasma volumes by liquid chromatography-tandem mass spectrometry. J Anal Toxicol. 2013;37(2):110–116. doi: 10.1093/jat/bks139.
- Guzmán NA, Molina DR, Núñez BF, et al. Bioequivalence and pharmacokinetic evaluation study of acetaminophen vs. acetaminophen plus caffeine tablets in healthy Mexican volunteers. Drugs R D. 2016;16(4):339–345. doi: 10.1007/s40268-016-0145-9.
- Haage P, Kronstrand R, Carlsson B, et al. Quantitation of the enantiomers of tramadol and its three main metabolites in human whole blood using LC-MS/MS. J Pharm Biomed Anal. 2016;119:1–9. doi: 10.1016/j.jpba.2015.11.012.
- Kam RK, Chan MH, Wong HT, et al. Quantitation of paracetamol by liquid chromatography-mass spectrometry in human plasma in support of clinical trial. Future Sci OA. 2018;4(8):FSO331. doi: 10.4155/fsoa-2018-0039.
- Liao Q, Xie Z, Pan B, et al. LC–MS–MS simultaneous determination of paracetamol, pseudoephedrine and chlorpheniramine in human plasma: application to a pharmacokinetic study. Chroma. 2008;67(9–10):687–694. doi: 10.1365/s10337-008-0560-3.
- Li H, Zhang C, Wang J, et al. Simultaneous quantitation of paracetamol, caffeine, pseudoephedrine, chlorpheniramine and cloperastine in human plasma by liquid chromatography-tandem mass spectrometry. J Pharm Biomed Anal. 2010;51(3):716–722. doi: 10.1016/j.jpba.2009.10.009.
- Lou HG, Yuan H, Ruan ZR, et al. Simultaneous determination of paracetamol, pseudoephedrine, dextrophan and chlorpheniramine in human plasma by liquid chromatography-tandem mass spectrometry. J Chromatogr B Analyt Technol Biomed Life Sci. 2010;878(7–8):682–688. doi: 10.1016/j.jchromb.2010.01.005.
- Lu W, Zhao S, Gong M, et al. Simultaneous determination of acetaminophen and oxycodone in human plasma by LC-MS/MS and its application to a pharmacokinetic study. J Pharm Anal. 2018;8(3):160–167. doi: 10.1016/j.jpha.2018.01.006.
- Mohamed D, Hegazy MA, Elshahed MS, et al. Liquid chromatography-tandem MS/MS method for simultaneous quantification of paracetamol, chlorzoxazone and aceclofenac in human plasma: an application to a clinical pharmacokinetic study. Biomed Chromatogr. 2018;32(7):e4232.
- Mohamed D, Hassan O, Bahnasawy N, et al. UPLC-MS/MS estimation of paracetamol, pseudoephedrine hydrochloride and brompheniramine maleate in plasma: application to a pharmacokinetic study on healthy Egyptian volunteers based on ethnic difference. Microchemical J. 2019;150:104146. doi: 10.1016/j.microc.2019.104146.
- Musshoff F, Madea B, Stuber F, et al. Enantiomeric determination of tramadol and O-desmethyltramadol by liquid chromatography-mass spectrometry and application to postoperative patients receiving tramadol. J Anal Toxicol. 2006;30(7):463–467. doi: 10.1093/jat/30.7.463.
- Nagaraju P, Kodali B, Datla PV, et al. LC-MS/MS quantification of tramadol and gabapentin utilizing solid phase extraction. Int J Anal Chem. 2018;2018:1605950–1605959. doi: 10.1155/2018/1605950.
- Patel BN, Sharma N, Sanyal M, et al. An accurate, rapid and sensitive determination of tramadol and its active metabolite O-desmethyltramadol in human plasma by LC-MS/MS. J Pharm Biomed Anal. 2009;49(2):354–366. doi: 10.1016/j.jpba.2008.10.030.
- Simonsen KW, Steentoft A, Buck M, et al. Screening and quantitative determination of twelve acidic and neutral pharmaceuticals in whole blood by liquid-liquid extraction and liquid chromatography-tandem mass spectrometry. J Anal Toxicol. 2010;34(7):367–373. doi: 10.1093/jat/34.7.367.
- Tan QY, Zhu RH, Li HD, et al. Simultaneous quantitative determination of paracetamol and its glucuronide conjugate in human plasma and urine by liquid chromatography coupled to electrospray tandem mass spectrometry: application to a clinical pharmacokinetic study. J Chromatogr B Analyt Technol Biomed Life Sci. 2012;893–894:162–167. doi: 10.1016/j.jchromb.2012.02.027.
- Tonoli D, Varesio E, Hopfgartner G. Quantification of acetaminophen and two of its metabolites in human plasma by ultra-high performance liquid chromatography-low and high resolution tandem mass spectrometry. J Chromatogr B Analyt Technol Biomed Life Sci. 2012;904:42–50. doi: 10.1016/j.jchromb.2012.07.009.
- Yin OQ, Lam SS, Chow MS. Simultaneous determination of paracetamol and dextropropoxyphene in human plasma by liquid chromatography/tandem mass spectrometry: application to clinical bioequivalence studies. Rapid Commun Mass Spectrom. 2005;19(6):767–774. doi: 10.1002/rcm.1850.
- Madrakian T, Afkhami A, Mahmood-Kashani H, et al. Superparamagnetic surface molecularly imprinted nanoparticles for sensitive solid-phase extraction of tramadol from urine samples. Talanta. 2013;105:255–261. doi: 10.1016/j.talanta.2012.12.039.
- Wang M, Wang C, Han X. Selection of internal standards for accurate quantification of complex lipid species in biological extracts by electrospray ionization mass spectrometry – what, how and why? Mass Spectrom Rev. 2017;36(6):693–714. doi: 10.1002/mas.21492.
- European Medicines Agency. Guideline on bioanalytical method validation. Committee for Medicinal Products for Human Use. 2012. Available from: https://www.ema.europa.eu/en/documents/scientific-guideline/guideline-bioanalytical-method-validation_en.pdf
- Food and Drug Administration. Guidance for industry: bioanalytical method validation. U.S. Department of Health and Human Services, Food and Drug Administration, Center for Drug Evaluation and Research (CDER), Center for Veterinary Medicine (CVM). 2018. Available from: https://www.fda.gov/files/drugs/published/Bioanalytical-Method-Validation-Guidance-for-Industry.pdf
- Briscoe CJ, Stiles MR, Hage DS. System suitability in bioanalytical LC/MS/MS. J Pharm Biomed Anal. 2007;44(2):484–491. doi: 10.1016/j.jpba.2007.03.003.
- Loh GOK, Wong EYL, Tan YTF, et al. Simple and rapid LC-MS/MS method for determination of sitagliptin in human plasma and application to bioequivalence study. J Chromatogr B Analyt Technol Biomed Life Sci. 2020;1159:122337. doi: 10.1016/j.jchromb.2020.122337.
- Chow SC, Liu JP. Design and analysis of bioavailability and bioequivalence studies. 3rd ed. New York (NY): CRC Press, Taylor & Francis Group; 2009.
- European Medicines Agency. ASEAN guideline for the conduct of bioequivalence studies. 2015. Available from: https://asean.org/wp-content/uploads/2012/10/BE_Guideline_FinalMarch2015_endorsed_22PPWG.pdf
- Blaye OL. Variations in internal standard response: some thoughts and real-life cases. Bioanalysis. 2019;11(18):1715–1725. doi: 10.4155/bio-2019-0146.
- Czyrski A, Sznura J. The application of Box-Behnken-Design in the optimization of HPLC separation of fluoroquinolones. Sci Rep. 2019;9(1):19458. doi: 10.1038/s41598-019-55761-z.