
Abstract
Background & Objective
The systemic immune-inflammation indicator (SII) has been extensively employed in various diseases for course change, treatment efficacy, or prediction, whereas whether it applies to iron overload or iron deficiency remains unclear. This study aimed at investigating the correlation between SII and serum ferritin in people aged over 20 in the US.
Methods
The measurements of the systemic immune-inflammation indicator (SII = platelet count × neutrophil-to-lymphocyte ratio) and serum ferritin of 5491 participants in the NHANES database served as the independent and dependent variables for the present cross-sectional study, respectively. Moreover, the correlation was investigated through and used multiple linear regression, smooth curve fitting, and threshold effect.
Results
After rigorous inclusion and exclusion of 19,225 participants, a grand total of 5,491 participants conforming to the requirements were covered for relevant analysis. SII showed a significant negative correlation with serum ferritin in unregulated ([β=-0.05,p < 0.0001], micro-regulated [β=-0.02,p = 0.0010], and fully regulated models[β=-0.03,p < 0.0001]). In all participants, the negative correlation between SII and serum ferritin served as a non-linear relationship, as indicated by a smooth curve. Subsequently, in the subgroup analysis (stratified by age, sex, and race) fitted by the smooth curve, the above-mentioned negative correlation turned out to be nonlinear in the subgroups aged ≥40 years, Non-Hispanic Black and female, with U-shaped inflection points reaching 874.59, 930.22, and 615 for SII in the above-described subgroups, respectively. The correlation between SII and serum ferritin in Mexican American, Other Hispanic, Non-Hispanic White, and those aged less than 40 developed a linear negative correlation.
Conclusions
To the best of our knowledge, this study examined the correlation between SII and serum ferritin for the first time. The correlation between SII and serum ferritin was varied with sex, age and race in people aged 20 and older. Therefore, higher or lower SII may be relevant for identifying iron overload and iron deficiency.
Introduction
Extensive studies have shown that ferroptosis, proposed in 2012 as a new type of programmed cell death, not only has great potential in cancer treatment, but also plays a role in the development of 11 organ system diseases in the body [Citation31]. The main causes of ferroptosis are iron metabolism disorder and lipid peroxide accumulation [Citation4]. Ferritin is known to be an iron storage protein that maintains iron homeostasis in the body by storing and releasing iron. Ferritinophagy, as a selective autophagy, mediates the degradation of ferritin to release free iron, and has a certain relationship with ferroptosis [Citation21]. Moreover, serum ferritin measurement is capable of evaluating the status of iron stores in the body; it has been the most sensitive and specific and widely used indicator for determining iron deficiency [Citation8] or iron overload [Citation11]. On the one hand, Iron deficiency has become a global health problem and iron deficiency anemia has become the most common one, affecting infants [Citation9] and adult women [Citation22] in low-income and developed countries. Malnutrition and chronic bleeding have been confirmed as its increasingly common causes. Iron deficiency in brain tissue has been reported to impair the development of cognitive function in adolescent children; it also plays a certain role in neurodegenerative diseases in adults [Citation20]. In general, iron deficiency is also a risk factor for heart failure, kidney disease, and cancer [Citation34]. On the other hand, iron overload has been extensively identified (is commonly seen) in hereditary hemochromatosis and chronic transfusion therapy, but may also be seen in severe autoimmune or inflammatory diseases [Citation18,Citation35]. Excess iron is capable of causing oxidative damage to cells and tissues by generating excess reactive oxygen species(ROS), whereas ROS triggers lipid and protein peroxidation and DNA damage [Citation7], leading to tissue fibrosis and organ dysfunction in the long term [Citation12]. In addition, ferritin serves as an inflammatory marker, and its concentration is increased with inflammation and a wide variety of diseases [Citation16].
The systemic immune-inflammation indicator (SII) refers to a novel marker of inflammation and prognosis based on the corresponding lymphocyte, neutrophil and platelet counts obtained from a complete blood count. As shown in Supplementary Table 1, SII can be used not only as a marker of inflammation in disease development, e.g. elevated SII may be associated with inflammation, immunity and thrombosis in the development of cerebrovascular disease [Citation37]. For instance, systemic immune inflammatory markers can serve as an inexpensive and reliable indicator of the inflammatory process in patients with irritable bowel syndrome [Citation10]. In addition, existing research has confirmed that SII has some predictive applications. For instance, SII can be adopted to predict the activity of autoimmune inflammatory diseases (e.g. psoriatic arthritis) and assess the inflammatory profile of urethral strictures, such that the risk of recurrence of internal urethrotomy operation can be predicted [Citation15,Citation25]. Furthermore, SII is preferred over the existing systemic inflammatory indicators; it serves as the only independent prognostic factor for patients after radical resection of cervical cancer [Citation13].
As revealed by an analysis of chronic kidney disease patients with and without inflammation, the inflammatory response can lead to increased ferritin concentrations [Citation33]. Parminder S Suchdev et al. evaluated the iron status in the presence of inflammation and confirmed (demonstrated) that iron indicator concentrations are affected in the presence of inflammation [Citation30]. However, the application of SII to iron overload or iron deficiency has been rarely investigated. This study attempted to determine whether a link exists, and whether SII is important for measuring iron metabolism and iron homeostasis in vivo. Furthermore, serum ferritin can be considered an inflammatory marker, and the aim of this study was at determining the trends of both inflammatory markers during the development of inflammation.
Methods
Data sources and study population
This cross-sectional analysis employed the data from the National Health and Nutrition Examination Survey (NHANES) conducted for four survey year cycles conducted between 2015-2018. NHANES refers to a nationally representative survey carried out by the Centers for Disease Control and Prevention (NCHS) [Citation3]. We obtained the original data from NHANES for this study, the NHANES Investigation Protocol gained approval from the NCHS Ethics Review Committee, and all participants provided written informed consent. Ethical review of this study is exempt since NHANES database is open to the public.
Exposure and outcome definition
SII is obtained by calculating the total peripheral platelet count × neutrophil-to-lymphocyte ratio (N/L) (SII = P × N/L). Lymphocyte, neutrophil, and platelets counts were measured by complete blood count using automated hematology analyzing devices (Coulter DxH 800 analyzer) and present as ×103 cells/ul. Serum ferritin (ng/ml) is derived from laboratory data and serum ferritin concentrations from 2015-2016 are measured with a Roche Elecsys-170 clinical analyzer, while serum ferritin concentrations from 2017-2018 are measured with a Roche Cobas e601 clinical analyzer (Roche Diagnostics, Indianapolis, USA). We grouped serum ferritin into three groups according to the WHO guideline definition of serum iron status: men and women with serum ferritin < 15 ug/L were defined as iron deficiency; Women with serum ferritin > 150 ug/L and men with serum ferritin >200 ug/L are defined as iron overload; Other serum ferritin levels are considered normal iron status [24].
Inclusion and exclusion criteria
By collating and merging the NHANES database from 2015 to 2018, we primitively obtained 19,225 valid participants and set the exclusion criteria for subjects in this study. The criteria were as follows:
age <20 years
people who lacked complete information about SII and serum ferritin
pregnancy
any cancer or malignancy
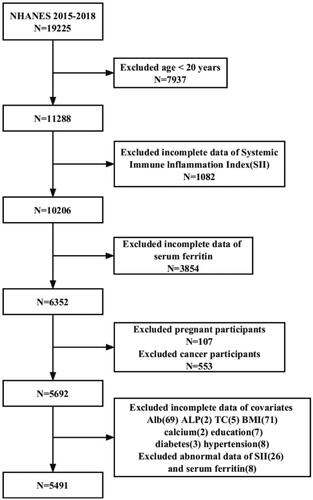
A total of 19,225 participants were initially recruited; after excluding individuals <20 years of age (n = 7937), missing data for SII (= 1082) and serum ferritin (n = 3854), pregnancy (n = 107), and cancer or malignancy (n = 553), 5491 eligible participants ≥20 years of age were included in the final analysis of this study ().
Figure 1. Flowchart of the participants selection from NHANES 2015–2018.
Other variables
Covariates that may potentially exert a certain effect on the correlation between SII and serum ferritin were covered in this study: sex (male/female); age (years); race (Mexican American/non-Hispanic white/non-Hispanic black/other Hispanic/other race); education level (less than high school/high school/above high school); family income-to poverty ratio (low income/low middle income/middle income/high income/unknown); smoking status (never/former/current); physical activity(None/Low/Sufficient/High/Unknown); alcohol consumption (never/moderate/heavy/unknown); BMI (kg/m2); serum albumin (g/dl); globulin (g/dl); alkaline phosphatase (U/L); total protein (g/dl); serum uric acid (mg/dl); total cholesterol (mg/dl); serum calcium (mg/dl); hypertension (yes/no); diabetes (yes/no); depression(yes/no/unknown). Household poverty was defined as the ratio of monthly household income to poverty level in accordance with the Department of Health and Human Services guidelines and then categorized as low income (≤1.30), low to moderate income (1.31-1.85), moderate income (1.86-3.50) and high income (>3.50) [Citation1]. Physical activity was determined using the metabolic equivalent (MET) score originating from the NHANES official website, and physical activity was defined as total MET minutes per week, which was summed across all physical activity questions. Hypertension and diabetes were defined by participants’ self-reported physician diagnosis. Depression was examined among participants aged 18 years and older through the Patient Health Questionnaire-2 (PHQ-2), i.e. a reliable short screening tool for assessing depression levels in the general population [Citation19].
Statistical analysis
NHANES examination sample weights in the study were adopted to regulate nonresponse, noncoverage, and unequal probabilities of selection. All the analyses in this study used MEC exam weight. Baseline characteristics were compared through Weighted linear regression models (continuous variables) and weighted chi-square tests (categorical variables). Weighted multivariate linear regression analysis was used to assess the correlation between SII and serum ferritin. In model 1, no regulation for covariates was performed; in model 2, regulations were made for sex, age and race; and model 3 was regulated for all covariates. In-depth subgroup analyses were conducted to explore the correlation between SII and serum ferritin in different subgroups. Stratification factors included sex (male/female), age (<40/≥40 years), and race (Mexican American/non-Hispanic white/non-Hispanic black/other Hispanic/other race). In addition, smoothed curve fitting and threshold effect models were used to verify whether there was a linear or nonlinear correlation between SII and serum ferritin. All analyses were performed using EmpowerStats (www.empowerstats.com; X&Y solutions, Inc., Boston, MA). p < 0.05 was considered statistically significant.
Results
Baseline characteristics of participants
lists the weighted baseline characteristics of the 5491 participants, divided into three groups in accordance with serum ferritin levels. Participants in the group with higher serum ferritin levels were more likely to be male (p < 0.0001), of other races (p < 0.0001), with a high school education (p = 0.015), and with a high to moderate poverty income ratio (p < 0.0001) compared to the first two groups. They had greater median age (p < 0.0001), BMI (p < 0.0001), higher levels of alkaline phosphatase (p < 0.0001), total protein (p < 0.0001), serum uric acid (p < 0.0001), serum calcium (p < 0.0001), total cholesterol (p < 0.0001), and lower SII (p < 0.0001), serum globulin (p < 0.0001), were prone to depression (p = 0.0002), hypertension (p < 0.0001), and diabetes (p < 0.0001), and would engage in smoking (p < 0.0001) and drinking (p < 0.0001). Differences in physical activity were not significant (p = 0.1474).
Table 1. Basic characteristics of participants (n = 5491) in the NHANES 2015–2018, weighted.
Correlation of the systemic immune-inflammation indicator with serum ferritin
lists the weighted multivariate linear regression models built. In model 1, no regulation was made for any covariates. In model 2, the regulation was performed only for age, gender and race. In model 3, the regulation was performed for all confounding covariates. SII showed a significant negative correlation with serum ferritin in the unregulated model, the minimally regulated model, and the fully regulated model [(model1: −0.05 (-0.07, −0.04); model2: −0.02 (-0.03, −0.01); model3: −0.03 (-0.04, −0.02)]. As indicated by the result of the sensitivity analysis, SII was converted from a continuous variable into a categorical variable (Tertile 1- Tertile 3). In all three models, a significant negative correlation was still identified between SII and serum ferritin and the trend test between the two remained significant (P for trend <0.0001).
Table 2. Association between systemic immune-inflammation index and serum ferritin.
Smoothing curve fitting and threshold effect analysis
A smoothed curve fit was also performed to verify whether the negative correlation between SII and serum ferritin was linear ( and ). When a clear U-shape appeared in the curve fit for the respective subgroup, a threshold effect analysis was further conducted (). In curve fits fully regulated for all covariates (except for the stratification variables themselves), negative correlations between the two were continuously reported in the Mexican American, Non-Hispanic White, and Other Hispanic subgroups [Mexican American: −0.01 (−0.04, 0.03) 0.7136; Non-Hispanic White: −0.03 (−0.05, −0.01) 0.0072; Other Hispanic: −0.04 (−0.08, −0.00) 0.0294]. Nevertheless, inflection points existed in the fitted graphs in the female or Non-Hispanic Black groups. In the female group, the inflection point SII was determined to be 615; in the Non-Hispanic Black group the inflection point reached 930.22. Whether unregulated or fully regulated for covariates (except for the stratification variables themselves), the SII showed a linear negative correlation with serum ferritin in the <40 years group, and the fitted graphs for both in the ≥40 years group turned out to be positive U-shaped, at which point the inflection point reached 874.59.
Figure 2. The association between SII and serum ferritin. (A) Each black point represents a sample. (B) The solid red line represents the smooth curve fit between variables. Blue bands represent the 95% CI from the fit. All covariates were adjusted.
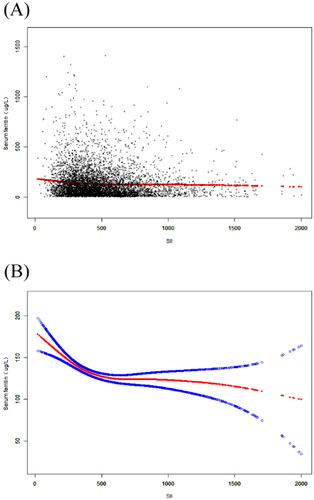
Figure 3. (A) The association between SII and serum ferritin stratified by age. All covariates were adjusted. (B) The association between SII and serum ferritin stratified by age. No covariates were adjusted. (C) The association between SII and serum ferritin stratified by gender. All covariates were adjusted. (D) The association between SII and serum ferritin stratified by race. All covariates were adjusted.
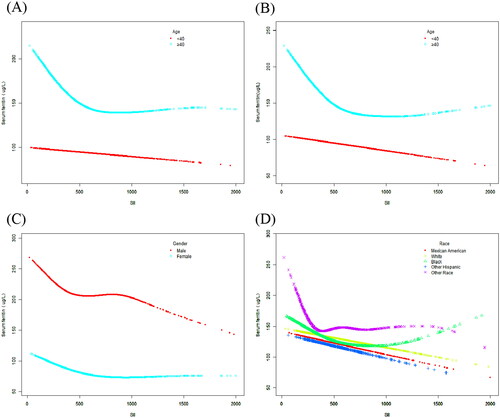
Table 3. Threshold effect analysis of systemic immune-inflammation index and serum ferritin stratified by age (years).
Table 4. Threshold effect analysis of systemic immune-inflammation index and serum ferritin stratified by gender.
Table 5. Threshold effect analysis of systemic immune-inflammation index and serum ferritin stratified by race.
Discussion
We innovatively investigated the correlation between SII and serum ferritin. Whether SII was used as a continuous variable or turned into a categorical variable, we found a significant nonlinear negative correlation between SII and serum ferritin. After stratified analysis, the two indicators showed a U-shaped correlation in the ≥40 years, Non-Hispanic Black, and female populations, while negative correlations remained in other populations.
When serum ferritin serves as a marker of inflammation, some research has suggested that inflammation in the body leads to the increased concentration of CRP (i.e. a common acute chronological response protein) and also the elevated concentration of serum ferritin [Citation29,Citation32]. Moreover, regardless of age or sex, the effect exerted by elevated serum ferritin concentrations that arise from infection is proportional to the baseline serum ferritin measurement at each stage [Citation23]. The possible reason for the above result is that elevated serum ferritin levels may show a correlation with cell damage-based biomarkers, instead of cell count-based indicators [Citation6], while SII is a composite indicator based on neutrophil, lymphocyte and platelet counts. During inflammation or infection, macrophages secrete a large number of cytokines, including interleukin-6 (IL-6), IL-1β, IL-22, etc. Different cytokines induce the production of hepcidin through different pathways, and therefore, hepcidin levels are increased during this period [Citation5,Citation28]. When hepcidin production is insufficient it leads to iron overload, while hepcidin overload results in iron deficiency [Citation2]. In brief, the findings of this study can be well explained following the mechanism of action of iron-tonic hormones. Furthermore, animal experiments have demonstrated that fever and decreased serum iron concentration in the body may be a defense mechanism for the body to address infection, when the decrease in serum iron concentration allows bacterial growth and reproduction to be inhibited and the inflammatory response to be reduced [Citation17]. Accordingly, the correlation between inflammation and iron metabolism-associated indicators should be investigated in depth.
A study of adults men in the US demonstrated different patterns of iron accumulation between blacks and whites in the presence of inflammatory conditions, due to different racial differences [Citation26]. We speculate that the differences may be due to genetics, socioeconomic pressures, environment, and other factors. A study published in 1992 using data from NHANES II found that although blacks had lower average hemoglobin levels, they had higher serum ferritin levels than whites, possibly indicating reduced utilization of stored iron for synthetic hemoglobin in blacks [Citation27]. In addition, serum ferritin levels were significantly lower in women than in men among whites, whereas among blacks, gender differences had little effect on serum ferritin levels [Citation36]. In a subgroup fit plot stratified by gender () it was concluded that serum ferritin levels were significantly lower in both women (without differentiating between premenopausal or postmenopausal) than in men, which is consistent with previous findings [Citation14]. And the difference in serum ferritin levels due to gender differences may also be related to the race of the subjects.
This study was the first to examine the correlation between SII and serum ferritin and regulated for as many covariates as possible to make our findings more reliable. We must admit that this study has some limitations. First, this cross-sectional study can only elucidate whether SII is associated with serum ferritin and cannot indicate whether there is a causal correlation between the two. Second, this study aimed at investigating the correlation between SII and serum ferritin in an adult population in the US. On the one hand, since some variables in the NHANES database defined adults as those aged 20 and older, (e.g. Education level - Adults 20+) in the demographic characteristics. On the other hand, since there has been a small amount of data on certain covariates in the database from 2015 to 2018 regarding the adolescent population, the study population was set as a larger group of adults aged 20 and older, with the aim of making the covered covariates more comprehensive and making the study results more accurate and reliable. Therefore, it remains to be confirmed whether the findings from this study can be generalized to adolescents. Third, there may be potential confounders that have not been regulated for. At last, in the analysis of the female population, no distinction was made between premenopausal and postmenopausal status. Therefore, more retrospective studies and cohort studies are needed to confirm the correlation between the novel inflammatory indicator SII and serum ferritin.
Conclusion
In this study, a non-linear negative correlation was identified between SII and serum ferritin in overall participants. The correlation between SII and serum ferritin varied with sex, age, and race in people aged 20 and older. Within a certain range, elevated SII was likely to indicate reduced iron stores in ≥40 years (inflection point: SII:874.59) or women (inflection point: SII:615) or non-Hispanic blacks (inflection point: SII:930.22), whereas higher SII indicated elevated iron stores. Thus, SII is likely to take on great significance in identifying iron overload and iron deficiency. Under the effect of the limitations of cross-sectional studies, the findings of this study require more prospective studies to verify whether a causal correlation exists between the two.
Authors contributions
YZ and YM: data analysis and writing—original draft; MC and BK: editing; YF: software; YY: supervision; MZ: funding. All authors contributed to the article and approved the submitted version.
Supplemental Material
Download MS Word (14.9 KB)Acknowledgments
We thank everyone who contributed to this National Health and Nutrition Examination Survey.
Disclosure statement
There is no potential interest competition in this article.
Data availability statement
Publicly available datasets were analyzed in this study. These data can be found here: https://www.cdc.gov/nchs/nhanes/.
Additional information
Funding
References
- Alaimo K, Briefel RR, Frongillo EA, Jr., et al. Food insufficiency exists in the United States: results from the third National Health and Nutrition Examination Survey (NHANES III). Am J Public Health. 1998;88(3):1–10. doi:10.2105/ajph.88.3.419.
- Camaschella C, Nai A, Silvestri L. Iron metabolism and iron disorders revisited in the hepcidin era. Haematologica. 2020;105(2):260–272. doi:10.3324/haematol.2019.232124.
- Chen TC, Clark J, Riddles MK, et al. National Health and Nutrition Examination Survey, 2015-2018: sample design and estimation procedures. Vital Health Stat. 2020;2(184):1–35.
- Chen X, Kang R, Kroemer G, et al. Broadening horizons: the role of ferroptosis in cancer. Nat Rev Clin Oncol. 2021;18(5):280–296. doi:10.1038/s41571-020-00462-0.
- D’Angelo G. Role of hepcidin in the pathophysiology and diagnosis of anemia. Blood Res. 2013;48(1):10–15. doi:10.5045/br.2013.48.1.10.
- DePalma RG, Hayes VW, O’Leary TJ. Optimal serum ferritin level range: iron status measure and inflammatory biomarker. Metallomics. 2021;13(6):mfab030. doi:10.1093/mtomcs/mfab030.
- Fleming RE, Ponka P. Iron overload in human disease. N Engl J Med. 2012;366(4):348–359. doi:10.1056/NEJMra1004967.
- Garcia-Casal MN, Pasricha SR, Martinez RX, et al. Serum or plasma ferritin concentration as an index of iron deficiency and overload. Cochrane Database Syst Rev. 2021;5(5):CD011817. doi:10.1002/14651858.CD011817.pub2.
- Gupta PM, Perrine CG, Mei Z, et al. Iron, anemia, and iron deficiency anemia among young children in the United States. Nutrients. 2016;8(6):330. doi:10.3390/nu8060330.
- Güven İE, Başpınar B, Atalay R. Relationship between systemic immune-inflammation index and irritable bowel syndrome. Turk J Gastroenterol. 2022;33(1):30–34. doi:10.5152/tjg.2021.21321.
- Herran OF, Bermudez J, N, Del Pilar Zea M. Red meat and egg intake and serum ferritin concentrations in Colombian children: results of a population survey, ENSIN-2015. J Nutr Sci. 2020;9:e12. doi:10.1017/jns.2020.5.
- Hsu CC, Senussi NH, Fertrin KY, et al. Iron overload disorders. Hepatol Commun. 2022;6(8):1842–1854. doi:10.1002/hep4.2012.
- Huang H, Liu Q, Zhu L, et al. Prognostic value of preoperative systemic immune-inflammation index in patients with cervical cancer. Sci Rep. 2019;9(1):3284. doi:10.1038/s41598-019-39150-0.
- Jehn M, Clark JM, Guallar E. Serum ferritin and risk of the metabolic syndrome in U.S. adults. Diabetes Care. 2004;27(10):2422–2428. doi:10.2337/diacare.27.10.2422.
- Kelesoglu Dincer AB, Sezer S. Systemic immune inflammation index as a reliable disease activity marker in psoriatic arthritis. J Coll Physicians Surg Pak. 2022;32(6):773–778. doi:10.29271/jcpsp.2022.06.773.
- Kell DB, Pretorius E. Serum ferritin is an important inflammatory disease marker, as it is mainly a leakage product from damaged cells. Metallomics. 2014;6(4):748–773. doi:10.1039/c3mt00347g.
- Kluger MJ, Rothenburg BA. Fever and reduced iron: their interaction as a host defense response to bacterial infection. Science. 1979;203(4378):374–376. doi:10.1126/science.760197.
- Knovich MA, Storey JA, Coffman LG, et al. Ferritin for the clinician. Blood Rev. 2009;23(3):95–104. doi:10.1016/j.blre.2008.08.001.
- Kroenke K, Spitzer RL, Williams JB. The patient health questionnaire-2: validity of a two-item depression screener. Med Care. 2003;41(11):1284–1292. doi:10.1097/01.MLR.0000093487.78664.3C.
- Larsen B, Bourque J, Moore TM, et al. Longitudinal development of brain iron is linked to cognition in youth. J Neurosci. 2020;40(9):1810–1818. doi:10.1523/JNEUROSCI.2434-19.2020.
- Latunde-Dada GO. Ferroptosis: role of lipid peroxidation, iron and ferritinophagy. Biochim Biophys Acta Gen Subj. 2017;1861(8):1893–1900. doi:10.1016/j.bbagen.2017.05.019.
- Mei Z, Addo OY, Jefferds ME, et al. Physiologically based serum ferritin thresholds for iron deficiency in children and non-pregnant women: a US National Health and Nutrition Examination Surveys (NHANES) serial cross-sectional study. Lancet Haematol. 2021;8(8):e572–e582. doi:10.1016/S2352-3026(21)00168-X.
- Nel E, Kruger HS, Baumgartner J, et al. Differential ferritin interpretation methods that adjust for inflammation yield discrepant iron deficiency prevalence. Matern Child Nutr. 2015;11(Suppl 4):221–228. doi:10.1111/mcn.12175.
- World Health Organization. WHO guideline on use of ferritin concentrations to assess iron status in individuals and populations. 2020.
- Ozsoy E, Kutluhan MA, Tokuc E, et al. Predictive value of systemic immune-inflammation index in recurrent urethral strictures. Urologia,. 2023;90(3):510–515. doi:10.1177/03915603221132033.
- Pan Y, Jackson RT. Ethnic difference in the relationship between acute inflammation and serum ferritin in US adult males. Epidemiol Infect. 2008;136(3):421–431. doi:10.1017/S095026880700831X.
- Perry GS, Byers T, Yip R, et al. Iron nutrition does not account for the hemoglobin differences between blacks and whites. J Nutr. 1992;122(7):1417–1424. doi:10.1093/jn/122.7.1417.
- Rana S, Prabhakar N. Iron disorders and hepcidin. Clin Chim Acta. 2021;523:454–468. doi:10.1016/j.cca.2021.10.032.
- Skinner AC, Steiner MJ, Henderson FW, et al. Multiple markers of inflammation and weight status: cross-sectional analyses throughout childhood. Pediatrics. 2010;125(4):e801–e809. doi:10.1542/peds.2009-2182.
- Suchdev PS, Williams AM, Mei Z, et al. Assessment of iron status in settings of inflammation: challenges and potential approaches. Am J Clin Nutr. 2017;106(Suppl 6):1626S–1633S. doi:10.3945/ajcn.117.155937.
- Tan Y, Dong X, Zhuang D, et al. Emerging roles and therapeutic potentials of ferroptosis: from the perspective of 11 human body organ systems. Mol Cell Biochem. 2023. doi:10.1007/s11010-023-04694-3.
- Thurnham DI, McCabe LD, Haldar S, et al. Adjusting plasma ferritin concentrations to remove the effects of subclinical inflammation in the assessment of iron deficiency: a meta-analysis. Am J Clin Nutr. 2010;92(3):546–555. doi:10.3945/ajcn.2010.29284.
- Ueda N, Takasawa K. Impact of inflammation on ferritin, hepcidin and the management of iron deficiency anemia in chronic kidney disease. Nutrients. 2018;10(9):1173. doi:10.3390/nu10091173.
- von Haehling S, Ebner N, Evertz R, et al. Iron deficiency in heart failure: an overview. JACC Heart Fail. 2019;7(1):36–46. doi:10.1016/j.jchf.2018.07.015.
- Wang W, Knovich MA, Coffman LG, et al. Serum ferritin: past, present and future. Biochim Biophys Acta. 2010;1800(8):760–769. doi:10.1016/j.bbagen.2010.03.011.
- Williams DM. Racial differences of hemoglobin concentration: measurements of iron, copper, and zinc. Am J Clin Nutr. 1981;34(9):1694–1700. doi:10.1093/ajcn/34.9.1694.
- Xu M, Chen R, Liu L, et al. Systemic immune-inflammation index and incident cardiovascular diseases among Middle-aged and elderly Chinese adults: the Dongfeng-Tongji cohort study. Atherosclerosis. 2021;323:20–29. doi:10.1016/j.atherosclerosis.2021.02.012.